10-K: Annual report pursuant to Section 13 and 15(d)
Published on March 30, 2022
UNITED STATES
SECURITIES AND EXCHANGE COMMISSION
Washington, D.C. 20549
FORM
(Mark One)
ANNUAL REPORT PURSUANT TO SECTION 13 OR 15(d) OF THE SECURITIES EXCHANGE ACT OF 1934 |
For the fiscal year ended
or
TRANSITION REPORT PURSUANT TO SECTION 13 OR 15(d) OF THE SECURITIES EXCHANGE ACT OF 1934 |
For the transition period from to
Commission file number:

(Exact name of registrant as specified in its charter)
|
||
|
(State or other jurisdiction of incorporation or organization) |
(I.R.S. Employer Identification Number) |
|
|
(Address of principal executive offices) |
(Zip Code) |
Registrant’s telephone number, including area code: (
Securities registered pursuant to Section 12(b) of the Act:
(Title of class) |
(Trading Symbol) |
(Name of each exchange on which registered) |
Securities registered pursuant to Section 12(g) of the Act: None
Indicate by check mark if the registrant is a well-known seasoned issuer, as defined in Rule 405 of the Securities Act.
Indicate by check mark if the registrant is not required to file reports pursuant to Section 13 or Section 15(d) of the Act. Yes ◻
Indicate by check mark whether the registrant (1) has filed all reports required to be filed by Section 13 or 15(d) of the Securities Exchange Act of 1934 during the preceding 12 months (or for such shorter period that the registrant was required to file such reports), and (2) has been subject to such filing requirements for the past 90 days.
Indicate by check mark whether the registrant has submitted electronically every Interactive Data File required to be submitted pursuant to Rule 405 of Regulation S-T (§232.405 of this chapter) during the preceding 12 months (or for such shorter period that the registrant was required to submit such files).
Indicate by check mark whether the registrant is a large accelerated filer, an accelerated filer, a non-accelerated filer, a smaller reporting company, or an emerging growth company. See the definitions of “large accelerated filer,” “accelerated filer,” “smaller reporting company,” and “emerging growth company” in Rule 12b-2 of the Exchange Act.
⌧ |
|
Accelerated filer |
☐ |
|
Non-accelerated filer |
☐ |
Smaller reporting company |
||
Emerging growth company |
||||
If an emerging growth company, indicate by check mark if the registrant has elected not to use the extended transition period for complying with any new or revised financial accounting standards provided pursuant to Section 13(a) of the Exchange Act. ◻
Indicate by check mark whether the registrant has filed a report on and attestation to its management’s assessment of the effectiveness of its internal control over financial reporting under Section 404(b) of the Sarbanes-Oxley Act (15 U.S.C. 7262(b)) by the registered public accounting firm that prepared or issued its audit report.
Indicate by check mark whether the registrant is a shell company (as defined in Rule 12b-2 of the Exchange Act). Yes
As of July 30, 2021, the last business day of the registrant’s most recently completed second quarter, the approximate market value of the registrant’s common stock held by non-affiliates was $
As of March 25, 2022,
RH
INDEX TO FORM 10-K
SPECIAL NOTE REGARDING FORWARD-LOOKING STATEMENTS AND MARKET DATA
This annual report contains forward-looking statements that are subject to risks and uncertainties. Forward-looking statements give our current expectations and projections relating to our financial condition, results of operations, plans, objectives, future performance and business. You can identify forward-looking statements by the fact that they do not relate strictly to historical or current facts. These statements may include words such as “anticipate,” “estimate,” “expect,” “project,” “plan,” “intend,” “believe,” “may,” “will,” “short-term,” “non-recurring,” “one-time,” “unusual,” “should,” “likely” and other words and terms of similar meaning in connection with any discussion of the timing or nature of future operating or financial performance or other events.
Forward-looking statements are subject to risk and uncertainties that may cause actual results to differ materially from those that we expected. We derive many of our forward-looking statements from our operating budgets and forecasts, which are based upon many detailed assumptions. While we believe that our assumptions are reasonable, we caution that it is very difficult to predict the impact of known factors and it is impossible for us to anticipate all factors that could affect our actual results and matters that we identify as “short term,” “non-recurring,” “unusual,” “one-time,” or other words and terms of similar meaning may in fact recur in one or more future financial reporting periods. Important factors that could cause actual results to differ materially from our expectations, or cautionary statements, are disclosed in Item 1A—Risk Factors, Item 7—Management’s Discussion and Analysis of Financial Condition and Results of Operations, and elsewhere in this annual report. All forward-looking statements attributable to us, or persons acting on our behalf, are expressly qualified in their entirety by these cautionary statements, as well as other cautionary statements. You should evaluate all forward-looking statements made in this annual report in the context of these risks and uncertainties.
We cannot assure you that we will realize the results or developments we expect or anticipate or, even if substantially realized, that they will result in the consequences or affect us or our operations in the way we expect. The forward-looking statements included in this annual report are made only as of the date hereof. We undertake no obligation to publicly update or revise any forward-looking statement, whether as a result of new information, future events or otherwise, except as required by law.
Risk Factors Summary
We operate in a rapidly changing environment that involves a number of risks that could materially and adversely affect our business, financial condition, prospects, operating results or cash flows, including those highlighted in this Risk Factors Summary. These summary risks provide an overview of many of the risks we are exposed to in the normal course of our business. As a result, the following summary risks do not contain all of the information that may be important to you, and you should read them together with the more detailed discussion of risks that affect our business disclosed in Item 1A—Risk Factors.
We are undertaking a large number of business initiatives at the same time, and if such initiatives are not successful, they may have a negative effect on our results of operations.
We have experienced significant fluctuations in the growth rate of our business and our high rates of growth may not be sustained in future time periods.
The COVID-19 pandemic has posed significant and widespread risks to our business as well as to the business environment and the markets in which we operate, including the resulting lags in manufacturing and inventory receipts.
Changes in consumer spending may adversely affect our revenue and results of operations, including as a result of economic downturns and the cyclicality of the luxury housing sector.
We may be adversely affected by any disruptions in our ability to obtain quality merchandise, including products that are produced by artisans and specialty vendors, particularly in light of the fact that our supply chain has not yet fully recovered from the dislocations resulting from the COVID-19 pandemic.
We face various risks related to the quality of our products, including risks to our brand and reputation as well as risks from product liability and product recalls.
If we are unable to maintain and enhance our brand or market for our product offerings or fail to successfully manage our mailings or other promotional programs, our business could be adversely affected.
We could be adversely affected by competition in the home furnishings sector.
We are subject to risks associated with our dependence on foreign manufacturing and imports.
Our results may be adversely affected by fluctuations in raw materials, energy and transportation costs and currency exchange rates.
We are subject to risks associated with occupying substantial amounts of space, including future increases in occupancy costs and other risks related to real estate development.
We may be adversely affected by factors beyond our control that affect our ability to open new stores within the time frames we initially target.
Reductions in the volume of mall and other in-store traffic or the closing of shopping malls as a result of changing consumer demographic patterns could adversely affect our sales.
Our results of operations may be harmed if we encounter issues with our distribution centers, furniture home delivery centers and other aspects of our supply chain and customer delivery network.
We are subject to risks related to our reliance upon independent third-party transportation providers.
Our operations have significant liquidity and capital requirements and depend on the availability of adequate financing and sources of capital on reasonable terms and we have elected to raise substantial amounts of capital through debt which exposes our business to risks related to obligations of indebtedness.
If we lose key personnel or are unable to hire qualified personnel, our business may be harmed.
Material damage to, or interruptions in, our information systems, including cybersecurity breaches or cyber fraud, could have a material adverse effect on our business or results of operations, and we may be exposed to certain risks associated with protecting our customers’ information.
We may be affected by legal and regulatory proceedings in which we are involved from time to time, including litigation, claims, investigations and regulatory and other proceedings.
Intellectual property claims by third parties or our failure or inability to protect our intellectual property rights could diminish the value of our brand and weaken our competitive position.
Compliance with laws, including laws relating to our business activities outside of the U.S., may be costly or otherwise adversely affect the way we do business.
Labor organizing and other activities could adversely affect us.
Fluctuations in our tax obligations and effective tax rate and realization of our deferred tax assets, including net operating loss carryforwards, may result in volatility of our results of operations.
Changes to accounting rules or regulations may adversely affect our results of operations.
We may be unsuccessful in identifying acquisition opportunities or unsuccessful in completing or realizing the expected benefits of acquisitions we undertake.
Our total assets include intangible assets with an indefinite life, goodwill, tradename and trademarks, and long-lived assets, principally property and equipment and lease right-of-use assets; changes to estimates or projections used to assess the fair value of these assets may cause us to incur impairment charges that could adversely affect our results of operations.
If we are unable to implement and maintain effective internal control over financial reporting in the future, the accuracy and timeliness of our financial reporting may be adversely affected.
Risks of natural or man-made disasters, acts of war, terrorism or widespread illness.
Risks related to our common stock price, including volatility or declines regardless of our operating performance.
We face various risks in connection with our share repurchase program.
Expectations of our company relating to environmental, social and governance factors may impose additional costs and expose us to new risks.
Risks related to our convertible notes financings, including our related bond hedge and warrant transactions, and the possible dilution we may experience in connection with the exercise at maturity of the warrants issued in connection with such convertible notes financings.
PART I
ITEM 1. BUSINESS
Overview
RH (collectively, “we,” “us,” or the “Company”) is a curator of design, taste and style in the luxury lifestyle market. Our curated and fully integrated assortments are presented consistently across our sales channels in sophisticated and unique lifestyle settings. We offer dominant merchandise assortments across a number of categories, including furniture, lighting, textiles, bathware, décor, outdoor and garden, and child and teen furnishings. Our retail business is fully integrated across our multiple channels of distribution, consisting of our retail locations, websites and Source Books. We position our Galleries as showrooms for our brand, while our websites and Source Books act as virtual and print extensions of our physical spaces. We operate our retail locations throughout the United States, Canada, and the U.K., and have an integrated RH Hospitality experience in 13 of our Design Gallery locations, which includes Restaurants and Wine Bars.
We have experienced a significant improvement in our business during fiscal 2021 despite the ongoing challenges presented by the COVID-19 pandemic and the disruption it has caused in our business operations beginning in the first quarter of fiscal 2020 and throughout fiscal 2021. Our performance demonstrates both the desirability of our exclusive products and our ability to overcome supply chain challenges, including port delays, which impacted our ability to convert business demand into revenues at normal historical rates. We have continued to navigate changes in operational restrictions based upon changes in local conditions and regulations, and as pandemic-related restrictions continue to be lifted in fiscal 2022 we may see consumer spending patterns shift away from spending on the home and home-related categories, such as home furnishings, and consumers return to pre-COVID consumption trends, such as spending on travel and leisure, and other activities.
For more information, refer to Item 1A—Risk Factors—The COVID-19 pandemic poses significant and widespread risks to our business as well as to the business environment and the markets in which we operate and Item 7—Management’s Discussion and Analysis of Financial Condition and Results of Operations—Overview.
Key Value-Driving Strategies
In order to drive growth across our business, we are focused on the following long-term key strategies and business initiatives:
Product Elevation. We have built the most comprehensive and compelling collection of luxury home furnishings under one brand in the world. Our products are presented across multiple collections, categories and channels that we control, and their desirability and exclusivity has enabled us to achieve industry-leading revenues and margins. Our customers know our brand concepts as RH Interiors, RH Modern, RH Beach House, RH Ski House, RH Outdoor, RH Baby & Child, RH TEEN and Waterworks. Our strategy to elevate the design and quality of our product will continue as we introduce RH Contemporary in 2022. We also have plans to introduce RH Couture Upholstery, RH Bespoke Furniture and RH Color over the next several years.
Gallery Transformation. Our product is elevated and rendered more valuable by our architecturally inspiring Galleries. We believe our strategy to open new Design Galleries in every major market will unlock the value of our vast assortment, generating a revenue opportunity for our business of $5 to $6 billion in North America. We believe we can significantly increase our sales by transforming our real estate platform from our existing legacy retail footprint to a portfolio of Design Galleries that is sized to the potential of each market and the size of our assortment. In addition, we plan to incorporate hospitality into most of the new Design Galleries that we open in the future, which further elevates and renders our product and brand more valuable. We believe hospitality has created a unique new retail experience that cannot be replicated online, and that the addition of hospitality drives incremental sales of home furnishings in these Galleries.
Brand Elevation. We are evolving the brand beyond curating and selling product to conceptualizing and selling spaces by building an ecosystem of Products, Places, Services and Spaces designed to elevate and render our product more valuable while establishing the RH brand as a thought leader, taste and place maker. We believe our seamlessly integrated ecosystem of immersive experiences inspires customers to dream, design, dine, travel and live in a world thoughtfully curated by RH, creating an impression and connection unlike any other brand in the world. Our hospitality efforts will continue to elevate the RH brand as we extend beyond the four walls of our Galleries into RH Guesthouses, where our goal is to create a new market for travelers seeking privacy and luxury in the $200 billion North American hotel industry. Additionally, we are creating bespoke experiences like RH Yountville, an integration of Food, Wine, Art & Design in the Napa Valley, RH1 & RH2, our private jets, and RH3, our luxury yacht that is available for charter in the Caribbean and Mediterranean, where the wealthy and affluent visit and vacation. These immersive experiences expose new and existing customers to our evolving authority in architecture, interior design and landscape architecture.
Digital Reimagination. Our strategy is to digitally reimagine the RH brand and business model both internally and externally. Internally our multi-year effort began with the reimagination of our Center of Innovation & Product Leadership to incorporate digitally integrated visuals and decision data designed to amplify the creative process from product ideation to product presentation. Externally our strategy is designed to come to life digitally as we launch The World of RH, an online portal where customers can explore and be inspired by the depth and dimension of our brand. The World of RH will include rich, immersive content with simplified navigation and search functionality, all designed to enhance the shopping experience and render our product and brand more valuable. We believe an opportunity exists to create similar strategic separation online as we have with our Galleries offline, reconceptualizing what a website can and should be.
Global Expansion. We believe that our luxury brand positioning and unique aesthetic have strong international appeal, and that pursuit of global expansion will provide RH a substantial long-term market opportunity to build a $20 to $25 billion global brand over time. Our view is that the competitive environment globally is more fragmented and primed for disruption than the North American market, and there is no direct competitor of scale that possesses the product, operational platform, and brand of RH. As such, we are actively pursuing the expansion of the RH brand globally with the objective of launching international locations in Europe, beginning in 2022 with the opening of RH England, The Gallery at the Historic Aynhoe Park. We have secured a number of locations in various markets in the United Kingdom and continental Europe for future Design Galleries and are in lease or purchase negotiations for additional locations.
Products and Product Development
We have positioned RH as a lifestyle brand and design authority by offering expansive merchandise assortments. We are merchants of luxury home furnishings and our products embody our design aesthetic and reflect inspiration from across the centuries and around the globe.
We have developed a proprietary product development platform that is fully integrated from ideation to presentation. Key aspects of our product development platform are:
Organization—We have established a collaborative, cross-functional organization leading our product development, sourcing, merchandising, inventory and creative teams. Our product teams are focused on maximizing the sales potential of each product category across all channels, which eliminates channel conflicts and functional redundancies.
Process—For many of our products, we work closely with our network of artisan partners who possess specialized product development and manufacturing capabilities and who we consider an extension of our product development team. We collaborate with our global network of specialty vendors and manufacturers to produce artisanal pieces of high quality and value on a large scale, including both distinctive original designs and reinterpretations of antiques.
Facility—We have built the RH Center of Innovation & Product Leadership, a facility that supports the entire product development process from product ideation to presentation across all channels.
Our proprietary organization, process and facility enhance our ability to introduce more new products with each collection. In addition, our product development platform, sourcing capabilities and significant scale enable us to reduce our product costs.
Sales Channels
We distribute our products through a fully integrated sales platform comprising our retail locations, including RH Galleries and Waterworks Showrooms, in addition to our websites, Source Books, Trade and Contract, and Outlets. We believe the level of integration among all of our channels and our approach to the market distinguish us from other retailers. We encourage our customers to shop across our channels, which complement one another, and have aligned our business and internal organization to be channel agnostic.
Retail Locations
As of January 29, 2022, our retail locations comprise RH Galleries and Waterworks Showrooms:
AVERAGE LEASED SELLING |
||||
|
COUNT |
|
SQUARE FOOTAGE (1) |
|
RH |
||||
Design Galleries (2) |
27 |
33,500 |
||
Legacy Galleries |
36 |
7,500 |
||
Modern Galleries |
1 |
12,800 |
||
Baby & Child and TEEN Galleries |
3 |
2,800 |
||
Total Galleries |
67 |
|||
Waterworks Showrooms |
14 |
4,100 |
||
Total retail locations |
81 |
| (1) | Average leased selling square footage is calculated based on total leased selling square footage divided by total locations. Leased selling square footage is retail space at our retail locations used to sell our products, as well as space for our restaurants. Leased selling square footage excludes backrooms at retail locations used for storage, office space, food preparation, kitchen space or similar purpose, as well as exterior sales space located outside a retail location, such as courtyards, gardens and rooftops. |
| (2) | Thirteen of our Design Galleries include an integrated RH Hospitality experience. |
Our Galleries reinforce our luxury brand aesthetic and are highly differentiated from other home furnishings retailers. We have revolutionized the customer experience by showcasing products in a sophisticated lifestyle setting, consistent with the imagery and product presentation featured on our websites and in our Source Books. Products in our Galleries are presented in fully appointed rooms, emphasizing collections over individual pieces. This presentation inspires our customers to consider purchasing a full collection of products to replicate the design aesthetic experienced in our Galleries. In addition, our associates use iPads and other devices to allow customers to shop our entire merchandise assortment while in a retail location.
We believe situating our Galleries in desirable locations, such as iconic buildings and luxury retail malls, is critical to the success of our business. New sites are identified based on a variety of store-specific factors – including unique architecture, geographic location, demographics, and proximity to affluent consumers – in addition to our ability to negotiate favorable economic terms and to procure permits and complete construction in a timely manner. We pursue a market-based sales strategy, whereby we assess each market’s overall sales potential and how best to approach the market across all of our channels. We customize square footage, as well as Source Book circulation, to maximize each market’s sales potential and increase our return on invested capital.
We believe our integrated RH hospitality experience, which includes Restaurants and Wine Bars, has created a unique new retail experience that cannot be replicated online, and that the addition of hospitality drives incremental sales of home furnishings in these Galleries. We plan to incorporate hospitality into most of the new Galleries that we open in the future.
We have identified key learnings from our real estate transformation that have supported the development of a multi-tier market approach described below that we believe will optimize both market share and return on invested capital.
PART I |
FORM 10-K | 3 |
First, we have developed prototype Design Galleries that are innovative and flexible blueprints that enable us to more quickly place our disruptive product assortment and immersive retail experience into the market. The prototype model is a standard we will continue to utilize and innovate based on key learnings from more recent Design Gallery openings. The prototype has approximately 40,000 leased selling square feet, inclusive of our integrated hospitality experience, presents our assortments across our businesses and contains interior design offices and presentation rooms where design professionals can work with clients on their projects. The prototype model is capital efficient and accelerates the development process. Our most recently opened Design Galleries in Dallas, Texas, Oak Brook, Illinois and Jacksonville, Florida are prototype Design Galleries, and an upcoming prototype location includes Palo Alto, California, which is expected to open in the second half of fiscal 2022. We anticipate the prototype Design Galleries will represent the format of most of our upcoming Design Galleries in North America.
Second, we will continue to develop and open larger Bespoke Design Galleries in the top metropolitan markets, similar to those we opened in New York and Chicago. These iconic locations are highly profitable statements for our brand, and we believe they create a long-term competitive advantage that will be difficult to duplicate. We will be opening our Bespoke Design Gallery, RH San Francisco, The Gallery at the Historic Bethlehem Steel Building, in spring 2022 and expect to open additional Bespoke locations in the coming years.
Third, we will continue to open indigenous Bespoke Galleries in the best second-home markets where the wealthy and affluent visit and vacation. These Galleries are tailored to reflect the local culture and are sized to the potential of each market. Examples of current indigenous Bespoke Galleries include our location in Yountville, California, as well as our Gallery under development in Aspen, Colorado.
The cadence of our Gallery openings depends upon a number of factors. We plan to expand our product sales to additional international markets and have signed leases for Design Galleries in several locations outside of North America, including the United Kingdom, France and Germany.
4 | FORM 10-K |
PART I |
The following tables present our retail location metrics:
|
YEAR ENDED |
|||||||||
|
JANUARY 29, |
JANUARY 30, |
||||||||
|
2022 |
2021 |
||||||||
|
|
|
TOTAL LEASED |
|
|
TOTAL LEASED |
||||
SELLING SQUARE |
SELLING SQUARE |
|||||||||
COUNT |
FOOTAGE (1) |
COUNT |
FOOTAGE (1) |
|||||||
|
(in thousands) |
(in thousands) |
||||||||
Beginning of period |
|
82 |
|
1,162 |
|
83 |
|
1,111 |
||
RH Design Galleries: |
|
|
|
|
|
|
|
|
||
Dallas Design Gallery |
1 |
38.0 |
— |
— |
||||||
Oak Brook Design Gallery |
|
1 |
37.7 |
— |
— |
|||||
Jacksonville Design Gallery |
1 |
37.7 |
— |
— |
||||||
Marin Design Gallery |
|
— |
— |
1 |
32.9 |
|||||
Charlotte Design Gallery |
|
— |
— |
1 |
32.4 |
|||||
RH Modern Galleries: |
|
|||||||||
Dallas RH Modern Gallery |
(1) |
(3.9) |
— |
— |
||||||
RH Baby & Child and TEEN Galleries: |
||||||||||
Santa Monica Baby & Child and TEEN Gallery |
(1) |
(7.3) |
— |
— |
||||||
RH Legacy Galleries: |
||||||||||
Tysons legacy Gallery (relocation) |
— |
8.5 |
— |
— |
||||||
Dallas legacy Gallery |
(1) |
(8.4) |
— |
— |
||||||
Oak Brook legacy Gallery |
(1) |
(10.0) |
— |
— |
||||||
Raleigh legacy Gallery |
— |
— |
1 |
4.4 |
||||||
Charlotte legacy Gallery |
— |
— |
(1) |
(7.0) |
||||||
Corte Madera legacy Gallery |
— |
— |
(1) |
(7.0) |
||||||
Westport legacy Gallery |
— |
— |
(1) |
(6.5) |
||||||
St. Louis legacy Gallery (relocation) |
— |
— |
— |
2.9 |
||||||
Waterworks Showrooms: |
||||||||||
New York 59th Street Showroom |
— |
— |
(1) |
(1.4) |
||||||
End of period |
|
81 |
|
1,254 |
|
82 |
|
1,162 |
||
Total leased square footage at end of period (2) |
1,672 |
1,559 |
||||||||
Weighted-average leased square footage (3) |
|
|
1,602 |
|
|
1,536 |
||||
Weighted-average leased selling square footage (3) |
1,197 |
1,141 |
||||||||
| (1) | Leased selling square footage is retail space at our retail locations used to sell our products, as well as space for our restaurants. Leased selling square footage excludes backrooms at retail locations used for storage, office space, food preparation, kitchen space or similar purpose, as well as exterior sales space located outside a retail location, such as courtyards, gardens and rooftops. |
Leased selling square footage includes approximately 4,800 square feet as of both fiscal 2021 and fiscal 2020 related to an owned retail location.
| (2) | Total leased square footage includes approximately 5,400 square feet as of both fiscal 2021 and fiscal 2020 related to an owned retail location. |
| (3) | Weighted-average leased square footage and leased selling square footage are calculated based on the number of days a retail location was opened during the period divided by the total number of days in the period. |
PART I |
FORM 10-K | 5 |
The following list shows the number of retail locations in each U.S. state, each Canadian province and in the U.K. where we operate as of January 29, 2022:
LOCATION |
|
COUNT |
|
LOCATION |
|
COUNT |
|
LOCATION |
|
COUNT |
Alabama |
|
1 |
|
Massachusetts |
|
2 |
|
Tennessee |
|
1 |
Arizona |
|
2 |
|
Michigan |
|
1 |
|
Texas |
|
7 |
California |
|
19 |
|
Minnesota |
|
1 |
|
Utah |
|
1 |
Colorado |
|
2 |
|
Missouri |
|
1 |
|
Virginia |
|
2 |
Connecticut |
|
3 |
|
Nevada |
|
1 |
|
Washington |
|
1 |
Florida |
|
6 |
|
New Jersey |
|
2 |
|
District of Columbia |
|
1 |
Georgia |
|
2 |
|
New York |
|
4 |
|
Alberta |
|
2 |
Illinois |
|
3 |
|
North Carolina |
|
2 |
|
British Columbia |
|
1 |
Indiana |
|
1 |
|
Ohio |
|
3 |
|
Ontario |
|
1 |
Kansas |
|
1 |
|
Oklahoma |
|
1 |
|
London (1) |
|
1 |
Louisiana |
|
1 |
|
Oregon |
|
1 |
|
|
|
|
Maryland |
|
1 |
|
Pennsylvania |
|
2 |
|
Total |
|
81 |
| (1) | The London retail location is a Waterworks Showroom. |
We continually analyze opportunities to selectively consolidate retail locations in connection with openings of our Design Galleries or close retail locations that have been under-performing or are no longer consistent with our brand positioning. In many cases, we continue to operate a retail location until our lease has expired in order to effect the closure in a cost-efficient manner.
Websites
Our primary RH websites, www.rh.com, www.rhmodern.com, www.rhbabyandchild.com and www.rhteen.com, provide our customers with the ability to chat with a designer and purchase our merchandise online. We sell Waterworks products online through www.waterworks.com.
Our websites allow our customers to experience the unique lifestyle settings reflected in our Source Books and throughout our Galleries and Showrooms, and to shop all of our current product assortment. We update our websites regularly to reflect new products, product availability and occasional special offers.
The RH websites also offer room-based navigation, which allows the customer to envision and shop items by room or by product, expanding on the richness of the online experience. Customers can search the websites for products by size or color, browse through our extensive product categories and see detailed information about each item and collection, such as dimensions, materials and care instructions. Additionally, customers can select color swatches and view merchandise displayed with different color and fabric options.
Source Books
We produce a series of catalogs, which we refer to as Source Books, to showcase our merchandise assortment. Our Source Books include RH Interiors, RH Modern, RH Outdoor, RH Baby & Child and TEEN, RH Beach House, RH Ski House and RH Rugs. Additionally, we plan to launch the RH Contemporary Source Book in fiscal 2022. Our Source Books are one of our primary branding and advertising vehicles. We have found that merchandise assortments displayed in our Source Books contribute to increased sales of those products across all of our channels. As in our Galleries, our Source Books present our merchandise in lifestyle settings that reflect our unique design aesthetic. Our Source Books also feature profiles of select artisan vendors and other compelling editorial content regarding home décor. All creative work on our Source Books is coordinated in-house in our RH Center of Innovation & Product Leadership, providing us greater control over the brand image presented to our customers, while also reducing our Source Book production costs.
6 | FORM 10-K |
PART I |
Our Source Book mailings serve as a key driver of sales through both our retail locations and websites. Our customers respond to the Source Books across all of our channels, with sales trends closely correlating to the assortments that we emphasize and feature prominently in our Source Books, websites and Galleries. Our Source Books, in concert with our websites, are a cost-effective means to test new products, and allow us to launch categories in a disciplined, expeditious and cost-effective manner. We continue to evaluate and optimize our Source Book strategy based on our experience.
We maintain a database of customer information, including information from our RH Members Program. Our customer database includes sales patterns, detailed purchasing information and certain demographic information, as well as mailing and email addresses. We mail our Source Books to addresses within this database and to addresses provided to us by third parties. The database, which is maintained in accordance with our privacy policy disclosed on our website, supports our ability to analyze our customers’ buying behaviors across sales channels, facilitates the development of targeted marketing strategies, and supports prospecting new customers. We segment our customer files based on multiple variables, and we tailor our Source Book mailings and emails in response to the purchasing patterns and product needs of our customers. We continue to improve the segmentation of customer files and the expansion of our customer database.
Trade and Contract
In the Trade channel, we work directly with residential interior designers and decorators purchasing products for their clients’ residential projects. We also sell directly to consumers who make purchases with the assistance of their residential interior designer or decorator. Our Contract business supplies products to large-scale, luxury hospitality, commercial and residential development projects globally, working directly with hotel ownership groups and brands, commercial property owners, single-family and multi-family builders and developers and their ecosystem of architecture, interior design and purchasing business partners. These channels enable us to reach new business customers and the consumers they influence.
Outlet Stores
Our outlet stores are branded as RH Outlet or Restoration Hardware Outlet and are typically located in outlet malls. Our outlet stores serve as a key part of our reverse logistics platform and provide an efficient means to sell primarily returned merchandise and, to a lesser extent, discontinued and overstock merchandise outside of our core sales channels. As of January 29, 2022, we operated 38 outlet stores.
Marketing and Advertising
Our Galleries, websites and Source Books are the primary branding and advertising vehicles for the RH brands. In addition, we employ a variety of marketing and advertising techniques to drive customer traffic across all our channels, strengthen and reinforce our brand image and acquire new customers. These include targeted Source Book circulation, email communications, promotional mailings, print advertisements, and public relations activities and events. We use our customer database to tailor our programs and increase the efficiency of our marketing and promotion initiatives. We leverage our marketing and advertising expenses across all our channels as we seek to optimize the efficiency of our investment.
The highly differentiated design aesthetic and environment of our Galleries drives customer traffic not only to our physical spaces but also to our websites. Our Source Books and targeted emails further reinforce the RH brand image and drive sales across all of our sales channels. We also participate in a wide range of other marketing, promotional and public relations activities. These campaigns include media coverage in design, lifestyle, culture/society and specialty publications, as well as in-Gallery events related to new Gallery openings and product launches. In addition, we engage in print advertising in brand-relevant publications such as Architectural Digest, Elle Décor, Luxe Interiors + Designs, T: The New York Times Style Magazine, WSJ. Magazine, Business of Home and others. We believe that these efforts drive increased brand awareness, leading to higher sales over time.
RH Members Program
The RH Members Program reimagines and simplifies the shopping experience. For an annual fee, the RH Members Program provides a set discount every day across all RH brands, excluding RH Hospitality and Waterworks, in addition to other benefits including complimentary interior design services through the RH Interior Design program and eligibility for preferred financing plans on the RH Credit Cards. The RH Members Program allows our customers to shop for what they want, when they want, and receive the greatest value, which has resulted in orders and sales being more evenly distributed throughout the year. During fiscal 2021, our members drove approximately 97% of sales in our core RH business, and we had approximately 459,000 members at year end. Our core RH business reflects the product categories that the membership discount can be applied to, and, as a result, sales generated via Outlet, Contract, Hospitality or Waterworks are excluded. We believe our membership model enhances the customer experience, renders our brand more valuable, improves operational execution and reduces costs.
PART I |
FORM 10-K | 7 |
Sourcing
Our sourcing strategy focuses on identifying and using vendors that can provide the quality materials and fine craftsmanship that our customers expect of our brand. We work closely with vendors and manufacturers to ensure that our high standards of quality and timely delivery of merchandise are met. We seek to ensure the consistent quality of our manufacturers’ products by selectively inspecting pre-production samples, conducting periodic site visits to certain of our vendors’ production facilities and selectively inspecting inbound shipments at our distribution facilities. In fiscal 2021, we sourced approximately 75% of our purchase dollar volume from approximately 29 vendors. In fiscal 2021, one vendor accounted for 11% of our purchase dollar volume. Based on total dollar volume of purchases for fiscal 2021, 69% of our products were sourced from Asia, with 34% sourced from China, 15% from the United States and the remainder from other countries and regions. In addition, we perform limited manufacturing activities in the United States.
We have a limited number of long-term merchandise supply contracts, but we believe that we generally have strong relationships with our product vendors. Although we transact business primarily on an order-by-order basis, we typically work with most of our vendors over extended periods of time, and many vendors continue to make long-term capacity investments to serve our increasing demands. We develop close relationships with our vendors in order to achieve significant cost savings and improve our product development process by eliminating the use of most third-party purchasing agents in favor of a model in which we directly manage our vendors.
Distribution and Delivery
We manage the distribution and delivery of our products through our distribution centers. We currently operate three furniture fulfillment centers and one small-parcel fulfillment center servicing RH products, which are located strategically in four markets throughout the United States. We have one fulfillment center in the United States servicing Waterworks products. In addition, we continue to develop our supply chain in the U.K. and Europe in connection with our global expansion and plan to use third-party providers to serve our customers.
We operate portions of our home delivery services in 22 key markets to leverage operating costs and improve our customers’ delivery experience, while reducing returns and damage to our products. We offer a white glove home delivery service for our larger merchandise and furniture categories, where third-party personnel deliver fully assembled items to the location of our customers’ choice. We believe there is an opportunity to improve the customer experience by taking greater control of the home delivery experience over time. We believe that many third-party furniture delivery providers are designed to support mass and mid-market companies and that significant opportunity exists for developing improved solutions for the luxury market. We believe we have dramatically enhanced the customer experience while reducing return rates, damages and deliveries per order by enhancing the quality of our delivery providers through metric-based accountability standards.
We believe our supply chain and fulfillment operations allow us to manage customer orders and distribute merchandise to our customers in an efficient and cost-effective manner.
Competition
The home furnishings sector is highly competitive. We believe that we compete primarily on the basis of the design, style and quality of our products, the breadth of our assortment of high-quality merchandise and the luxury positioning of our brand. We believe that customers respond favorably to the style and presentation of our products and that we offer consumers a substantial assortment of curated merchandise selections as part of a lifestyle experience. We continue to elevate our product assortment and create separation between our brand and that of many of our competitors.
We compete with the interior design trade and specialty stores, as well as antique dealers and other merchants that provide unique items and custom-designed product offerings at higher price points, by providing a broader product assortment at an exceptional value based both upon the price and quality of our products. We also compete with national and regional home furnishing retailers and department stores, in addition to mail order catalogs and online retailers focused on home furnishings, by offering what we believe is superior quality, highly distinctive design styles and a sophisticated lifestyle presentation in our product offering.
We also believe that our success depends in substantial part on our ability to originate and define product trends, as well as to timely anticipate, gauge and react to changing consumer demands. Certain of our competitors are larger and have greater financial, marketing and other resources than us. However, many smaller specialty retailers may lack the financial resources, infrastructure, scale and national brand identity necessary to compete effectively with us. We believe we are positioned to gain market share from both of these segments and drive growth.
8 | FORM 10-K |
PART I |
Our People
At RH, we believe deeply that the “right” people are our greatest asset. As of January 29, 2022, we had approximately 6,500 associates, of which approximately 800 were part-time associates. As of that date, approximately 2,300 of our associates were based in our retail locations and outlets. None of our employees are represented by a union, and we have had no labor-related work stoppages. We believe that relations with our associates are good.
The success of our business depends upon our ability to retain continued service of certain key personnel, particularly our Chairman and Chief Executive Officer, Gary Friedman, and to attract, retain and motivate qualified leaders throughout our Company, as well as qualified associates across all parts of our organization, including Galleries, Restaurants, distribution centers, home delivery centers and customer care centers, both in the United States and internationally. Our goal is to have the most qualified person in every position throughout our organization. As we are headquartered in the San Francisco Bay Area, a highly dynamic and competitive market for talent, we seek to provide competitive compensation for our people in order to attract and retain the best available talent.
We do not discriminate against any applicant or associate and have a policy outlining these principles. This policy governs all aspects of employment, including recruitment, hiring, training, promotion, compensation, discipline, job assignments, benefits, transfer and discharge. We maintain a diverse workforce. RH is an equal opportunity employer, and we believe in meritocratic hiring. We strongly believe our performance is enhanced by a workforce comprising individuals with diverse backgrounds, skills and experience that align with the needs of our business. We are committed to operating our environments with the highest safety standards to ensure the health and well-being of our guests and team members.
Our culture is driven by our Chairman and Chief Executive Officer and the senior leadership team, who instill a company-wide commitment to our values of People, Quality, Service and Innovation. We believe our distinct corporate culture allows us to attract highly talented individuals who are passionate, driven and who share our vision. We expect our values to be maintained throughout our business, including our supply chain. We require our vendors to adhere to our Vendor Code of Conduct, which can be found on the Investor Relations section of our website, located at ir.rh.com under “Governance / Environmental, Social & Governance.”
Intellectual Property
The “RH,” “Restoration Hardware,” “RH Interiors,” “RH Modern,” “RH Outdoor,” “RH Baby & Child,” “RH TEEN,” “RH Beach House,” “RH Ski House,” “RH Rugs” and “Waterworks,” and “Waterworks Studio” trademarks, among others, are registered or are the subject of pending trademark applications with the United States Patent and Trademark Office and with the trademark registries of several foreign countries. Each of our trademark registrations is perpetually renewable provided that we use or continue to use the trademarks in commerce in the particular geographic market and for the goods or services covered by the registration. In addition, we own many domain names, including “rh.com,” “restorationhardware.com,” “rhmodern.com,” “rhbabyandchild.com,” “rhteen.com,” “rhbeachouse.rh.com,” “rhskihouse.rh.com,” “waterworks.com” and others that include our trademarks. These domain names are perpetually renewable. We own design patents or pending design patent applications to protect the ornamental appearance of several of our products. These design patents are valid for 15 years from their date of issuance. We own copyrights, including copyright registrations or pending applications, for our website and for several of our Source Books. We believe that our trademarks, design patents, and copyrights have significant value and we vigorously protect them against infringement.
Fluctuation in Quarterly Results
Our quarterly results vary depending upon a variety of factors, including changes in our product offerings and the introduction of new merchandise assortments and categories, changes in retail locations, the timing of Source Book releases, and the extent of our realization of the costs and benefits of our numerous strategic initiatives, among other things. For example, we have historically experienced some seasonality in our business trends as our sales are typically higher in the second fiscal quarter, which correlates to a peak selling season for outdoor items including outdoor furniture. As a result of these factors, our working capital requirements and demands may fluctuate during the year. Unique factors in any given quarter may affect period-to-period comparisons, and the results for any quarter are not necessarily indicative of the results that we may achieve for a full fiscal year.
Corporate Information
The Company was formed as a Delaware corporation on August 18, 2011. On November 7, 2012, the Company completed an initial public offering. On December 15, 2016, Restoration Hardware Holdings, Inc. filed a Certificate of Amendment to its Amended and Restated Certificate of Incorporation with the Secretary of State of the State of Delaware to change its name to “RH,” effective January 1, 2017.
PART I |
FORM 10-K | 9 |
Regulation and Legislation
We are subject to numerous regulations, including labor and employment laws, customs, laws governing truth-in-advertising, consumer protection, privacy, safety, real estate, environmental and zoning and occupancy laws, and other laws and regulations that regulate retailers and govern the promotion and sale of merchandise and the operation of our retail and hospitality locations, outlets and warehouse facilities, in the United States and other international locations in which we operate presently or plan to in the future, as well as in jurisdictions from which we source our products. We believe we are in material compliance with laws applicable to our business.
Where You Can Find More Information
We are required to file or furnish annual, quarterly and current reports, proxy statements and other information as required by the Securities Exchange Act of 1934, as amended (the “Exchange Act”), with the SEC. The SEC maintains a website that contains reports, proxy statements and other information about issuers, like us, who file electronically with the SEC. The address of that website is www.sec.gov.
We maintain public internet sites at www.rh.com and www.restorationhardware.com and make available, free of charge, through these sites our Annual Reports on Form 10-K, Quarterly Reports on Form 10-Q, Current Reports on Form 8-K, Proxy Statements and Forms 3, 4 and 5 filed on behalf of directors and executive officers, as well as any amendments to those reports filed or furnished pursuant to the Exchange Act as soon as reasonably practicable after we electronically file such material with, or furnish it to, the SEC. The charters for our Board of Directors’ Audit Committee, Compensation Committee, and Nominating and Corporate Governance Committee, as well as our Code of Business Conduct, our Corporate Governance Guidelines and Code of Ethics governing our chief executive and senior financial officers and other related materials are available on our websites. The information on our websites is not part of this annual report.
Our Investor Relations Department can be contacted at RH, 15 Koch Road, Corte Madera, California 94925, Attention: Investor Relations; telephone: 415-945-3500; e-mail: investorrelations@rh.com.
10 | FORM 10-K |
PART I |
ITEM 1A. RISK FACTORS
Certain factors may have a material adverse effect on our business, financial condition, and results of operations. You should consider carefully the risks and uncertainties described below, in addition to other information contained in this Annual Report on Form 10-K, including our consolidated financial statements and related notes. The events and consequences discussed in these risk factors could materially and adversely affect our business, financial condition, results of operations, and future prospects. In that event, the trading price of our common stock could decline, and you could lose part or all of your investment. The risks and uncertainties described below are not the only ones we face. Additional risks and uncertainties that we are unaware of, or that we currently believe are not material, may also become important factors that adversely affect our business.
Risks Related to Our Business
We are undertaking a large number of business initiatives at the same time, including international expansion and exploring opportunities to expand into new categories and complementary businesses. If these initiatives are not successful, they may have a negative impact on our results of operations.
We are undertaking a large number of new business initiatives at the same time in order to support our future growth. We have multiple growth initiatives and innovation in our development pipeline, including efforts to expand our business through (i) international expansion of our business, (ii) enhancement of our merchandise assortment including improvements to quality of our products and services, (iii) launching new business initiatives including real estate development and an expanded scope of RH Hospitality as well as other new categories of products and services. We have introduced a number of new product categories such as RH Modern and are in the process of launching other major new offerings such as RH Contemporary, a new collection that bridges the gap between RH Interiors and RH Modern. We are continuing to pursue a substantial expansion of the RH Hospitality offering which includes integrated Restaurants and wine bars in a number of our Galleries and will also incorporate standalone restaurants and guesthouses as well as other innovations such as our private jets RH1 and RH2, and our luxury yacht RH3. We are also investing in other new business initiatives including through business acquisitions and investment in joint ventures such as a number of real estate development projects such as the RH Ecosystem in Aspen, Colorado, which will include retail locations, hospitality concepts, residential properties, and workforce housing projects.
We can provide no assurances that customers will respond favorably to our new product offerings, Galleries or complementary businesses or that we will successfully execute on such business initiatives. Such new business opportunities may not achieve market acceptance or may only achieve market acceptance in limited geographic areas or at certain Design Galleries. In addition, developing and testing new and multiple business opportunities and strategies often requires knowledge in areas of expertise that may be new to our organization and may require significant time from our senior leadership team as well as substantial resources. We can provide no assurances that we will be successful in expanding our operations into any new businesses and product lines.
Any new businesses we enter may also expose us to additional laws, regulations and risks, including the risk that we may incur ongoing operating expenses in such businesses in excess of revenues, which could harm our financial condition and results of operations. The financial profile of any such new businesses may be different than our current financial profile, which could affect our financial performance and the market price for our common stock.
We are undertaking a substantial effort to expand our business internationally by establishing a new retail presence in global markets including Europe and the U.K. International expansion will expose us to new risks related to operating internationally, including, but not limited to, risks related to currency fluctuation, supply chain and product sourcing, new regulatory regimes applicable to our products, Galleries and employees, global health emergencies such as the coronavirus disease (“COVID-19”) pandemic, and the consequences of international economic or political events including but not limited to the U.K.’s withdrawal from the European Union in January 2020, commonly referred to as “Brexit,” which has resulted in considerable change in the regulatory framework governing business in the U.K. and which may negatively impact the luxury market or our plans to operate in the U.K. We may be unsuccessful in adapting our operations to address such risks. We also may be unsuccessful in accurately selecting which international markets would support demand for our products or sizing our Gallery openings to such markets. We may determine to curtail and/or slow our international expansion initiative as part of our efforts to manage liquidity in response to overall market conditions and to address priorities in the different capital requirements of our business. Expanding our business internationally will also require that we develop operational expertise in new markets and regulatory regimes, and an inability to adapt our business quickly and efficiently to support our international expansion could materially adversely affect our financial condition and results of operations.
PART I |
FORM 10-K | 11 |
As of January 29, 2022, we have an integrated RH Hospitality experience in 13 of our locations, including Restaurants and Wine Bars, and based on the success of our hospitality offering to date, we plan to incorporate an integrated RH Hospitality offering in many of the new Galleries that we open in the future. We continue to refine and develop the RH Hospitality model as we seek to optimize this part of our business and its integration with the operation of our Gallery locations. Although we have experienced a number of positive business outcomes from the RH Hospitality operations, there can be no assurance that these benefits will be sustained, that we will avoid operational or other complications from the hospitality business or that new aspects of our hospitality offering such as the launch of guesthouses will be successful.
We often have in the past, and may in the future, incur significant costs for any new initiative before we realize any corresponding revenue with respect to such initiative. For example, as we continue to develop and invest in new business formats and initiatives such as the redevelopment of existing historical buildings into our larger format Design Galleries in select major metropolitan markets and the introduction of guesthouses, we may incur substantial investments before the location is open to customers and is able to generate revenue, and we anticipate that a number of Galleries to be opened during the next several years will continue to require this form of significant upfront investment before they generate revenue from the food and beverage offerings. Some of these projects have taken substantially more time and investment in contrast to our initial expectations and as a result may have difficulty recouping our costs and investment in some of these developments or our payback on investment could take much longer than we had initially targeted.
In addition, we are continuing a number of new initiatives to improve the operations of our business, including ongoing refinements to our organizational structure. Some of the improvements we are pursuing include changing the ways we source and deliver our products to our customers, as well as streamlining and realigning the senior leadership and personnel structure in our home office operations. We have also focused on elevating the customer experience, which includes improving our distribution and delivery of products and architecting a new fully integrated back-end operating platform, inclusive of the supply chain network, the home delivery experience as well as a new metric-driven quality system and company-wide decision data. We have focused on rationalizing our SKU count and optimizing inventory, which includes selling slower moving, discontinued and other inventory through markdowns and our outlet channel, as well as enhancing and optimizing our product sourcing capabilities and adding new management information systems.
If we are not successful in managing the large number of new initiatives that are underway, we might experience an adverse impact on our financial condition and results of operations. Given the large number of organizational initiatives we are pursuing, as well as the complexity and untested nature of many of these efforts, there can be no certainty that we will be successful in executing on these initiatives. We may not experience the operational or financial benefits we expect these improvements to generate and we may face unanticipated costs related to pursuing these initiatives such as personnel turnover, senior leadership distraction, or compliance and quality control risks, any of which could have a material adverse effect on our financial condition or results of operations.
All of the foregoing risks may be compounded due to various factors including the rapidly changing macroeconomic conditions as a result of the COVID-19 pandemic or any economic downturn. If we fail to achieve the intended results of our current business initiatives, or if the implementation of these initiatives is delayed or abandoned, diverts our senior leadership team’s attention or resources from other aspects of our business or costs more than anticipated (including, as a result of personnel turnover or compliance and control risks), we may experience inadequate return on investment for some of these business initiatives, which could have a material adverse effect on our financial condition or results of operations.
We have experienced significant fluctuations in the growth rate of our business and high levels of growth may not be achieved in future periods.
We have experienced significant fluctuations in the growth rate of our business. We may continue to experience wide fluctuations in our quarterly performance. We are currently engaged in a number of growth initiatives, including investments to elevate our brand and improvements to our products and customer experience. There can be no assurance that these efforts will be successful or that we will not encounter other operational difficulties that may have a material negative impact on growth and profitability. In addition, these initiatives may have near-term material negative impacts on growth and profitability as we incur costs or pursue strategies that may not contribute to our profits and margins until future periods, if at all. Some factors affecting our business, including macroeconomic conditions and government policies are not within our control. In prior periods, our results of operations have been adversely affected by weakness in the global economic environment such as slowdowns in the housing market. In addition, our rates of revenue growth have sharply fluctuated from quarter to quarter and we expect volatility in the rates of our growth to continue in future quarterly periods. Unique factors in any given quarter may affect period-to-period comparisons in our revenue growth, including:
12 | FORM 10-K |
PART I |
the overall economic and general retail sales environment including factors affecting the housing market such as housing prices, the pace of housing construction and secondary market transactions in the housing market as well as other activities in the housing sector;
the availability of our products and the impact of delays or disruption in our supply chain;
consumer preferences and demand;
other factors affecting the retail business sector including issues related to the COVID-19 pandemic,
the state of the mortgage industry and other aspects of consumer credit tied to housing, including the availability and pricing of mortgage refinancing and home equity lines of credit;
the number, size and location of stores we open, close, remodel or expand in any period;
changes in Source Book circulation, and the number of pages in our Source Books and timing of mailing;
our ability to efficiently source and distribute products;
changes in our product offerings and the introduction, and timing thereof, of introduction of new products and new product categories;
our competitors introducing similar products or merchandise formats;
the timing of various holidays, including holidays with potentially heavy retail impact; and
the success of our marketing programs and any promotional efforts.
Due to these factors, our results for any quarter are not necessarily indicative of the results that we may achieve for a full fiscal year. Our results of operations may also vary relative to corresponding periods in prior years. We may take certain pricing, merchandising or marketing actions that could have a disproportionate effect on our business, financial condition and results of operations in a particular quarter or selling season, and as a result we believe that period-to-period comparisons of our results of operations are not necessarily meaningful and cannot be relied upon as indicators of future performance. We cannot assure you that we will succeed in offsetting any increases in our expenses with improved efficiency or price increases for our products and services or that cost increases associated with our business will not have an adverse effect on our financial results.
The COVID-19 pandemic has posed significant and widespread risks to our business as well as to the business environment and the markets in which we operate.
The COVID-19 pandemic has had a widespread impact on our customers and on our merchandise supply chain, on the overall business climate in the U.S. and globally, and on financial and consumer markets. Depending on the future course of the pandemic, including potential further outbreaks with new strains or variants of the virus, we may experience further impact to our product supply chain including delays in inventory receipts and backorders as well as restrictions on and closures of our physical operations with respect to Galleries, Outlets and Restaurants. Future adverse developments in connection with the COVID-19 crisis, including new strains or variants of the virus, evolving international, federal, state and local restrictions and safety regulations in response to COVID-19 risks, changes in consumer behavior and health concerns, the pace of economic activity, or other similar issues could adversely affect our business, results of operations or financial condition in future periods. The evolution of the COVID-19 pandemic around the world may continue to have an adverse impact on elements of our supply chain including the manufacture, supply, distribution, transportation and delivery of our products and our inventory levels. There have been substantial disruptions with respect to the global supply chain as a result of the pandemic. The presence of the virus and the response to the health crisis in various countries is likely to have a continuing impact on our supply chain, for example by affecting the speed at which the factories that manufacture our products are able to resume normal operations and production levels after closures.
PART I |
FORM 10-K | 13 |
Changes in consumer spending and factors that influence spending of the specific categories of consumers that purchase from us, including the health of the high-end housing market, may significantly impact our revenue and results of operations.
We target consumers of high-end home furnishings as customers for our products. As a result, we believe that our sales are sensitive to a number of factors that influence consumer spending generally, but are particularly affected by the financial health of and demand levels from the higher-end customer demographic. In addition, not all macroeconomic factors are highly correlated in their impact on lower end housing versus the higher-end customer. Demand for lower priced homes and first-time home buying may be influenced by factors such as employment levels, interest rates, demographics of new household formation and the affordability of homes for the first-time home buyer. The higher-end of the housing market may be disproportionately influenced by other factors including the number of foreign buyers in higher-end real estate markets in the U.S., activity in luxury and second home markets, the number of second and third homes being built and sold, stock market valuation and overall equity market conditions, global economic uncertainty, inflation, decreased availability of income tax deductions for mortgage interest and state income and property taxes, and the perceived prospect for capital appreciation in higher-end real estate. The stock market recently has experienced periods of significant volatility and there have been declines in some asset prices. Increases in interest rates may affect asset valuations and may dampen growth in and consumer optimism about the U.S. housing market and could depress home buying and/or prices in the higher-end of the housing market. We believe that the purchasing patterns of our customers are influenced by a number of factors much more than the overall housing market including activity in the high-end and secondary housing segment as well as the health and volatility of the stock market. Previous declines in the stock market and periods of high equity market volatility have correlated with a reduction in consumer demand for our products. We believe that a number of these factors have in the past had, and may in the future have, an adverse impact on the high-end retail home furnishings sector and affect our business and results. These factors may make it difficult for us to accurately predict our operating and financial results for future periods and some of these factors could contribute to a material adverse effect on our business and results of operations.
If we fail to successfully and timely deliver merchandise to our customers and manage our supply chain commensurate with demand, our results of operations may be adversely affected.
We must successfully manage our supply chain and vendors in order to produce sufficient quantities of products that our customers wish to purchase in a timely manner. We must manage our inventory levels, including predicting the appropriate levels and type of inventory to stock within each of our distribution centers, such that our “in stock” position in merchandise correlates well to consumer demand and expected delivery times. Because much of our merchandise requires that we provide vendors with significant ordering lead times, often before market factors are known, we may not be able to source sufficient inventory to meet demand if our products prove more popular than anticipated. In addition, our current initiatives to streamline and optimize our inventory levels may not be successful and implementing such initiatives may complicate our efforts to manage our supply chain. To the extent our business initiatives result in new product lines or service offerings or further expansion into new markets, we may need to establish new vendor relationships or supply chain operations, which may expose us to new counterparty, regulatory, market or other risks and which may not be successful. We have experienced periods in which some of our vendors were not able to meet customer demand for certain products resulting in significant back orders for goods, higher rates of cancellation on orders in process and, in some instances, loss of customer sales when orders could not be completed in a timely manner. During the COVID-19 pandemic and continuing in fiscal 2021, disruptions in the global supply chain have adversely affected our business including leading to substantial back orders and deferred sales. There can be no assurance as to how long such conditions in the supply chain will persist or exactly how they may continue to affect our business during fiscal 2022 and beyond. For example, increases in costs for shipping merchandise from China to the United States could increase our costs. In addition, the seasonal nature of some of our products requires us to carry a significant amount of inventory prior to certain selling seasons. If we are unable to accurately predict and track demand, we may be required to mark down the price of certain products in order to sell excess inventory or we may be required to sell such inventory through our outlet stores or warehouse sales. If the dislocations in our supply chain do not recover as quickly as we anticipate, we may be delayed in our ability to convert business demand into revenues and we may experience increased costs for merchandise. For these reasons, our results of operations in any given quarterly period may be adversely affected. We expect these factors to continue from time to time as we add new product assortments and new merchandise categories into our business.
14 | FORM 10-K |
PART I |
Merchandise purchased from our vendors that is defective or otherwise does not meet our product quality standards could damage our reputation and brand image and harm our business, and we may not have adequate remedies against our vendors for such merchandise.
Some of our merchandise has failed to meet our expectations and objectives concerning quality. Our emphasis on merchandise quality is increasing as we strive to elevate our brand. In recent periods we have recalled products due to quality or other issues and may recall others in the future. Despite our ongoing efforts to improve customer satisfaction, we may fail to maintain the level of quality for some of our products that is necessary to satisfy our customers. For example, our vendors may not adhere to our quality control standards, and we may not identify a quality deficiency before merchandise ships to our stores or customers. Failure to supply our customers with high-quality merchandise in a timely and effective manner, additional product recalls, or any perception that we are not maintaining adequate sourcing and quality control processes could damage our reputation and brand image and lead to an increase in product returns or exchanges or in customer litigation (including class-action lawsuits), increasing routine and non-routine litigation costs. In addition, social media may magnify any harm to our business, reputation and brand image. We are changing many aspects of our business processes, including improving product quality and enhancing sourcing and product availability, which may complicate our supply chain and quality control processes and result in quality issues or product recalls. Even if we detect that merchandise is defective or otherwise not in compliance with our product quality standards, we may not be able to return such products to the vendor or obtain a refund or other indemnification from the vendor. The limited capacities of certain of our vendors may constrain the ability of such vendors to replace any defective merchandise in a timely manner. Similarly, the limited capitalization and liquidity of certain of our vendors and their lack of insurance coverage for product recall claims may result in such vendors being unable to refund our purchase price or pay applicable penalties or damages associated with any such defects or resulting product recalls.
Our business depends on the strength of our brand and continuing investments in our brand will be an important requirement for our future success.
Our business depends in part on a strong brand image, and we continue to invest in the development of our brand and the marketing of our business. We believe that our brand image has contributed significantly to the success of our business to date. Our increased focus on elevating RH as a luxury brand further increases the importance of our brand image, position and reputation. We also believe that maintaining and enhancing our brand is integral to the future of our business and the implementation of our strategies for expansion. This will require us to continue making investments in areas that support the strength of our brand. Our brand image may be diminished if new products, services or other businesses fail to maintain or enhance our distinctive brand image. Additionally, our reputation could be jeopardized if we fail to maintain high standards for merchandise and service quality. With the growth in importance and the impact of social media, any negative publicity from product defects, recalls or service failures may be magnified and reach a large portion of our customer base in a short period of time, which could harm the value of our brand and, consequently, our financial performance. We may also suffer reputational harm if we fail to maintain high ethical, social and environmental standards for all of our operations and activities, if we fail to comply with local laws and regulations, if we fail to deliver high-quality merchandise, or if we experience other negative events that affect our image. Any failure to maintain a strong brand image could have an adverse effect on our sales and results of operations.
As a luxury brand, we rely on a number of initiatives to sustain our image and to promote our products in the marketplace. Our physical retailing presence, primarily in the form of our galleries, is one of the most important initiatives that we use to display our product offering. We also use our website and other digital efforts, as well as our Source Books, to showcase a larger portion of our assortment. We continue to adjust and refine our strategy based on a variety of factors, including the success of the various changes that we adopt. During fiscal 2021, we increased our investment in certain digital initiatives and we expect to continue these initiatives. Expenditures on our catalog strategy have historically represented a substantial portion of our expense in marketing and promoting our business. We are adjusting our strategies with respect to the use of Source Books. There can be no assurance that we will be successful as we make changes in order to optimize our Source Book strategy including with respect to the cadence and timing of mailings, the format of the Source Books and the use of the Source Books as a marketing and promotional tool including with respect to prospecting for new customers. If we fail to adequately adjust our catalog strategy to meet our goals, or if our catalog strategy is unsuccessful, our results of operations could be negatively impacted. Future increases in shipping rates, paper costs or printing costs would have a negative impact on our results of operations to the extent that we are unable to offset such increases through increased sales or by raising prices, by implementing more efficient printing, mailing, delivery and order fulfillment systems, or by using alternative direct-mail formats. If the performance of our catalogs declines, if we misjudge the correlation between our catalog circulation and net revenues, or if our catalog circulation optimization strategy is not successful, our results of operations could be negatively impacted.
PART I |
FORM 10-K | 15 |
Competition in the home furnishings sector may adversely affect our future financial performance.
The home furnishings sector is highly competitive. We compete with the interior design trade and specialty stores, as well as antique dealers and other merchants that provide unique items and custom-designed products at higher price points. We also compete with national and regional home furnishing retailers and department stores and will face new competitors as we expand our business into new geographic markets. In addition, we compete with mail order catalogs and online retailers focused on home furnishings. There are an increasing number of online and digital centric business models in the home furnishings sector and the impact of these competitors on other home furnishing businesses is uncertain. There can be no assurance that such competitors will not be more successful than us, based on imitation or otherwise, or that we will be able to continue to maintain a leadership position in style and innovation in the future. Increased competition also has resulted, and may in the future result, in potential or actual litigation between us and our competitors related to a variety of activities, including hiring practices. If we are not successful in such litigation, our business could be harmed.
We are subject to risks associated with our dependence on foreign manufacturing and imports for our merchandise.
Based on total dollar volume of purchases for fiscal 2021, 69% of our products were sourced from Asia, with 34% sourced from China, 15% from the U.S. and the remainder from other countries and source regions. We expect the amount of products that we source from China will be lower in fiscal 2022 compared to fiscal 2021, but the exact product mix in terms of vendor factory locations is subject to a range of different factors and is inherently difficult to predict with accuracy. In addition, some of the merchandise we purchase from vendors in the U.S. also depends, in whole or in part, on vendors located outside the U.S. As a result, our business highly depends on global trade, as well as any trade and or other factors that impact the specific countries where our vendors’ production facilities are located. Our future success will depend in large part upon our ability to maintain our existing foreign vendor relationships and to develop new ones and any changes in trade dynamics that might dictate changes in the locations for sourcing of products. In addition, we face risks related to the ability of our vendors to scale their operations whether in connection with new products we introduce or new production manufacturing locations added to our supply chain, which in some cases would require substantial ongoing investments to support additional capacity. In addition, we have previously encountered difficulties in the ability of our vendors to scale production commensurate with demand from our customers. While we rely on long-term relationships with many of our vendors, we do not rely on long-term contracts with our vendors and generally transact business with them on an order-by-order basis.
Many of our imported products are subject to existing duties, tariffs, anti-dumping duties and other similar trade restrictions that may limit the quantity or affect the price of some types of goods that we import into the U.S. and Canada. In addition, substantial regulatory uncertainty exists regarding international trade relations and trade policy. An introduction of new duties, tariffs, quotas or other similar trade restrictions, or increases in existing duties or tariff rates, on products imported into the U.S. and Canada, whether actual, pending or threatened, may have a negative impact on our results of operations. Significant uncertainty exists as to whether and when tariffs may be reduced or imposed, and what countries may be implicated. Given that we cannot reasonably predict the timing or outcomes of trade actions by the U.S. government or other countries, the impact of such actions on our business and results of operations remains uncertain. Additionally, such uncertainties, even if not directly applicable to our imported products, may have a negative influence on the domestic and international economy generally and indirectly reduce market demand for our products.
The U.S. has imposed tariffs on certain products imported into the U.S. from China and could propose additional tariffs. A significant subset of our products sourced from China has been affected by increased tariffs imposed in 2018 and 2019. In January 2020, the U.S. and China signed a “Phase One” trade agreement pursuant to which, among other things, the U.S. will modify its Section 301 tariff actions and which suspended the tariff on this additional set of goods. Further, as of February 14, 2020, the 15 percent tariff implemented on September 1, 2019 was reduced to 7.5 percent. While the trade deal remains effective, there is no guarantee that the agreement will be honored by either party, and it could be subject to further revision or renegotiation. The Biden Administration has indicated that it will not take immediate action to modify these existing tariffs, there is substantial uncertainty regarding the possible application of additional tariffs with respect to China and other countries as well as potential retroactive liabilities for additional duties. In addition, the U.S. Government has imposed import restrictions under the Withhold Release Orders for goods such as cotton products from the Xinjiang Uyghur Autonomous Region (“XUAR”) and under the Uyghur Forced Labor Prevention Act which may induce greater supply chain compliance costs and delays to us and to our vendors. We may not be able to anticipate the exact contours of tariffs and other burdens on global trade that become applicable and our efforts to respond to these circumstances may be inadequate. In particular, we may not be able to receive or sustain adequate pricing concessions from our vendors with respect to applicable tariffs and any applicable pricing increases that we seek to pass through to our customers may not be successful in achieving our objectives. Our sales may fall in response to any price increases and our vendors may not be able to support the level of pricing concessions that we seek.
16 | FORM 10-K |
PART I |
Our dependence on foreign imports makes us vulnerable to other risks associated with products manufactured abroad, including, among other things, risks of damage, destruction or confiscation of products while in transit to our U.S. distribution centers, product quality control charges on or assessment of additional import duties, tariffs, anti-dumping duties and quotas, loss of “most favored nation” trading status by our foreign trading partners with the U.S., work stoppages, including without limitation as a result of events such as longshoremen strikes, transportation and other delays in shipments, including without limitation as a result of heightened security screening and inspection processes or other port-of-entry limitations or restrictions in the U.S., freight cost increases, political unrest, economic uncertainties, including inflation, foreign government regulations, trade restrictions, increased labor costs and other similar factors that might affect the operations of our vendors in specific countries such as China or related to Russia. Due to the recent developments in Ukraine and the ensuing sanctions imposed on certain regions of Ukraine and on Russia, Russian entities, and Russian financial institutions, our supply chain may be impacted by applicable restrictions and the scope of such restrictions is subject to ongoing change in response to the conflict in Ukraine. In addition, due to countermeasures (“countersanctions”) imposed by the Russian government, the sourcing of certain products that use Russian wood may be affected. While we do not directly source wood from Russia, the global impact of the unprecedented trade restrictions on Russia and by Russia could require us to change our practices and impose greater compliance measures to protect us from sanctions or countersanctions. We are continually monitoring the evolving sanctions and regularly review our sourcing practices for compliance purposes.
In addition, there is a risk of compliance violations by our vendors, which could lead to adverse consequences related to the failure of our vendors to adhere to applicable manufacturing requirements or other applicable rules or regulations. Any such noncompliance could have an adverse impact on our business and may result in product recalls, regulatory action, product liabilities, investigation by governmental agencies and other similar adverse consequences. Any failure by our vendors outside the U.S. to adhere to applicable legal requirements or our global compliance standards, such as fair labor standards and prohibitions on forced labor and child labor, could give rise to a range of adverse consequences, including supply chain disruption, potential liability, harm to our reputation and brand, and boycotts by consumers or special interest groups, any of which could negatively affect our business and results of operations.
Our growth strategy and performance depend on our ability to purchase quality merchandise in sufficient quantities at competitive prices, including products that are produced by artisans and specialty vendors. Any disruptions we experience in our ability to obtain quality products in a timely fashion or in the quantities required could have a material adverse effect on our business.
We purchase substantially all of our merchandise from a number of third party vendors. Many such vendors are the sole sources for particular products, and we generally transact business with such vendors on an order-by-order basis without any long-term or other contractual assurances of continued supply, pricing or access to new products with our vendors. Therefore, we may be dependent on particular vendors that produce popular items, and any vendor could discontinue selling to us at any time. In addition, the expansion of our business into new U.S. or international markets or new product categories could put pressure on our ability to source sufficient quantities of our products from such vendors. In the event that one or more of our vendors is unable or unwilling to meet the quantity or quality of our product requirements, we may not be able to develop relationships with new vendors in a manner that is sufficient to supply the shortfall. We also may be required to develop such new vendor relationships in response to changes in our supply chain. Even if we do identify such new vendors, we may experience product shortages and customer backorders as we transition our product requirements to incorporate alternative suppliers.
PART I |
FORM 10-K | 17 |
Furthermore, our growth strategy includes expanding our product assortment, and our performance depends on our ability to purchase our merchandise in sufficient quantities at competitive prices. However, many of our key products are produced by artisans, specialty vendors and other vendors that are small, undercapitalized or that may have limited production capacity, and we have from time to time in prior periods experienced supply constraints that have affected our ability to supply high demand items or new products due to such capacity and other limits in our vendor base. A number of our vendors, particularly our artisan vendors, may have limited financial or other resources and operating histories and may receive various forms of credit from us, including with respect to payment terms or other arrangements. In some cases, we have advanced payments to vendors in order to assist a vendor in funding additional merchandise production to meet our orders. These advance payments are normally unsecured. Vendors may become insolvent and their failure to repay our advances, and any failure to deliver products to us, could have a material adverse impact on our results of operations. Because the arrangements with our vendors are generally not exclusive, many of our vendors might be able to sell similar or identical products to our competitors or directly to consumers. Our competitors may enter into arrangements with suppliers that could impair our ability to sell those suppliers’ products, including by requiring suppliers to enter into exclusive arrangements, which could limit our ability to enter into arrangements with such suppliers or otherwise access their products. Such competitors may also purchase products in significantly greater volume that we do, which may enable them to sell the products at reduced cost or flood the market with similar products. Any difficulties that we experience in our ability to obtain products in sufficient quality and quantity from our vendors could have a material adverse effect on our business.
Our results may be adversely affected by fluctuations in raw materials, energy and transportation costs and currency exchange rates.
Increases in the prices of the components and raw materials used in our products and other costs such as transportation could negatively affect the sales of our merchandise and our product margins. For example, in recent periods the cost of our products have come under pressure from increased prices for raw materials and shipping and other costs including in part as a result of the COVID-19 pandemic. Our business may also be affected by changes in currency exchange rates and as we expand our business internationally, we may be increasingly exposed to risks related to currency values. Changes in prices for raw materials, energy and transportation and fluctuations in exchange rates are dependent on a number of factors beyond our control, including macroeconomic factors that may affect commodity prices (including prices for oil, lumber and cotton); changes in supply and demand; general economic conditions; inflation; significant political events; labor costs; duties and tariffs and other similar factors. Depending on the nature of changes in these different factors that affect our business, we may experience an adverse impact on our business for different reasons including increased costs of operation or lower demand for our products. Changes in the value of the U.S. dollar relative to foreign currencies, including the Chinese Yuan, may increase our vendors’ cost of business and ultimately our cost of goods sold and our selling, general and administrative costs. If we are unable to pass such cost increases on to our customers or the higher cost of the products results in decreased demand for our products, our results of operations could be harmed.
We are subject to risks associated with occupying substantial amounts of space, including future increases in occupancy costs. We are pursuing various alternatives to traditional leasing of our Gallery locations that may subject us to a range of risks related to real estate development including risks related to construction and development of locations, risks related to the financing of commercial real estate and the market for commercial real estate.
We lease nearly all of our retail store locations, our outlet stores, our corporate headquarters, other storage and office space, and our distribution and home delivery facilities. The initial lease term of our retail locations generally ranges from ten to fifteen years, and certain leases contain renewal options for anywhere from ten to twenty-five years. The initial lease term for one of our future Design Galleries is forty-six years and contains a renewal option for five years. Most leases for our retail locations provide for a minimum rent, typically including escalating rent amounts, plus a percentage rent based upon sales after certain minimum thresholds are achieved, as well as common area maintenance charges, real property insurance and real estate taxes.
18 | FORM 10-K |
PART I |
We are currently pursuing several other models for the transformation of our real estate beyond a traditional leasing approach including a real estate development model, a joint venture model and a capital light model. While these alternative models are designed to achieve superior financial returns to traditional real estate lease structures for a retail business, some of these new ways of operation will expose us to a range of different risks. Various aspects of our multi-tier real estate strategy may expose us to new forms of risk versus our traditional leasing model. Our strategies include (1) our “capital light” leasing deals, where a substantial portion of the capital requirement would be funded by the landlord; (2) our real estate development model where we expect either to do a sale-leaseback transaction or to pre-sell the property and structure the transaction such that the capital to build the project is advanced by the buyer during construction; and (3) various joint venture approaches, where we share the upside of the development with third parties including the developer/landlord.
In fiscal 2020, we entered into equity method investments in connection with real estate development initiatives in Aspen, Colorado. The investments include properties that will be developed into retail locations, hospitality concepts, residential developments and workforce housing projects. We have also selected Aspen as the location to develop the first RH Ecosystem inclusive of an RH Bespoke Gallery, RH Guesthouse, RH Bath House & Spa, RH Restaurants and our first RH Residences. We plan to operate the RH branded businesses and be a real estate investor and partner for the remaining properties.
These new approaches might cause us to pursue complicated real estate transactions and may require additional capital investment and could present different risks related to the ownership and developments of real estate compared to those risks associated with a traditional store lease with a landlord, including greater financial exposure if our plans for the relevant real estate are not as successful as we originally anticipate or if the value of the real estate we acquire or invest in subsequently decreases. Pursuing multiple different paths for addressing our real estate needs may create various other risks including increased complexity and challenges related to the time and costs of real estate development and construction as well as the need for additional capital and risks related to resale of real estate projects. These risks could distract our senior leadership team’s focus, strain our operational resources and personnel, or expose us to new regulatory or tax regimes in which we must develop expertise.
Several of our new real estate development strategies expose us to additional risks related to operating in commercial real estate from a development perspective. Such risks include the cost and financing of the acquisition of real estate interests, market risks related to real estate prices, the time and costs related to developing real estate projects including construction and development risks and other factors that affect the commercial real estate industry more generally. We have not historically operated directly in all phases of real estate development including managing all aspects of construction of large scale real estate projects. With respect to projects such as the future Gallery and Guesthouse in Aspen, we are broadly undertaking increased development risk with respect to our real estate investments and these risks could increase our financial exposure to development cost overruns or other negative factors stemming from these real estate development efforts. Although our strategy in assuming greater risk and responsibility for real estate development in certain projects such as the Aspen project is designed to achieve greater financial returns and a higher overall return on investment, we could face increased downside risks if we encounter difficulties in implementing these strategies such as cost overruns or delays in construction.
If we decide to close an existing or future store, we may nonetheless have continuing obligations with respect to that property pursuant to the applicable lease or ownership arrangements, including, among other things, paying the base rent for the balance of the lease term. Our ability to re-negotiate favorable terms on an expiring lease, to arrange for the sale of an owned property or to negotiate favorable terms for a suitable alternate location could depend on conditions in the real estate market, competition for desirable properties, our relationships with current and prospective landlords and other factors that are not within our control. Our inability to enter into new leases or renew existing leases on terms acceptable to us or be released from our obligations under leases or other obligations for stores that we close could materially adversely affect our business and results of operations.
PART I |
FORM 10-K | 19 |
A number of factors that affect our ability to successfully open new stores within the time frames we initially target or optimize our store footprint are beyond our control, and these factors may harm our ability to execute our strategy to transform our real estate, which may negatively affect our results of operations.
We are focused on sizing our assortments and our stores to the potential of the market by adjusting the square footage and number of stores on a geographic market-by-market basis. We plan to optimize our real estate by continuing to open larger square footage Galleries in key markets and relocating or closing selected stores in these or adjacent markets. In addition, we have developed prototype Design Galleries that are suited to many smaller North American markets, we intend to continue to open indigenous Bespoke Galleries in the second home markets such as our initiative in Aspen, Colorado, and we intend to open larger Bespoke Design Galleries in the top international markets. When we address the introduction of new stores in a particular market or changes to, or closure of, existing stores, we must make a series of decisions regarding the size and location of new stores (or the existing stores slated to undergo changes or closure) and the impact on our other existing stores in the area or being without presence or “out of the market.”
Our ability to maximize the productivity of our retail store base, depends on many factors, including, among others, our ability to:
identify suitable locations, the availability of which is largely outside of our control;
size the store locations to the market opportunity;
retain customers in a certain geographic market when we close stores in such market or an adjacent market;
negotiate acceptable new lease terms or lease renewals, modifications or terminations;
efficiently build and equip new stores or remodel existing locations;
source sufficient levels of inventory to meet the needs of changes in our store footprint in a timely manner;
successfully integrate changes in our store base into our existing operations and information technology systems;
obtain or maintain adequate capital resources on acceptable terms;
avoid construction or local permit delays, construction accidents and injuries and cost overruns in connection with the opening of new stores or the expansion or remodeling of existing stores;
maintain adequate distribution facilities, information systems and other operational systems to serve our new stores and remodeled stores; and
address competitive, merchandising, marketing, distribution and other challenges encountered in connection with expansion into new geographic areas and markets.
We have experienced delays in opening some new stores and may experience further delays in the future. We also have incurred higher levels of capital and other expenditures associated with the opening of some of our new Gallery locations. In addition, construction costs and the price of building materials related to construction have experienced substantial price increases in recent years. While we are adopting various measures to improve the efficiency and effectiveness of our real estate development efforts with respect to opening new Galleries, the strategies may not be effective and may not have the effects that we anticipate. Any of the above challenges or other similar impediments could delay or prevent us from completing store openings and adversely affect the return on investment that we target from these initiatives. To the extent that we experience delays in the opening of a store or cost overruns, our results of operations will be negatively affected as we could incur various costs during a delay without associated store revenue at such location and such delays and increased costs could impact our overall return on investment and profit goals for some locations. Unfavorable economic and business conditions and other events could also interfere with our plans to expand or modify store footprints. Changes in regulation or increases in building or construction costs including with respect to the cost of building materials could result in unanticipated increases in real estate development costs or delays in the completion of our real estate projects. Our failure to effectively address challenges such as those listed above could adversely affect our ability to successfully open new stores or change our store footprint in a timely and cost-effective manner and could have a material adverse effect on our business, results of operations and financial condition.
20 | FORM 10-K |
PART I |
Reductions in the volume of mall and other in-store traffic or the closing of shopping malls as a result of changing demographic patterns could adversely affect our sales.
Although many of our most recently opened Design Galleries are developed outside of the shopping mall setting, a significant portion of our existing footprint of legacy Galleries is currently located in shopping malls. Sales at stores located in malls are derived, in part, from the volume of traffic in those malls. These stores benefit from the ability of the malls to generate consumer traffic in the vicinity of our stores and the continuing popularity of the malls as shopping destinations and positive experiences. However, in recent years there has been a shift in consumer preferences to purchasing certain products online rather than in stores. The decline in shopping malls may in turn adversely affect the financial health of other retailers and mall operators leading to store closures and a decline in the productivity of mall shopping environments due to the network effect of mall operations. A continuation of adverse trends affecting mall operations could have a negative impact on the sales generated by our stores currently located in shopping malls.
If we are unable to successfully optimize and operate our distribution centers, furniture home delivery centers and other aspects of our supply chain and customer delivery network, or if we are not able to fulfill orders and deliver our merchandise to our customers in an effective manner, our business and results of operations will be harmed.
Our business depends upon the successful operation of our distribution centers, furniture home delivery centers and other aspects of our supply chain and customer delivery network, as well as upon our order management and fulfillment services and the re-stocking of certain inventories within our stores. The efficient flow of our merchandise requires that our facilities have adequate capacity to support our current level of operations and any anticipated increased levels that may follow from any growth of our business.
We are currently engaged in efforts to improve the quality of our customer experience, which includes making changes to the way in which we operate our distributions centers, furniture home delivery centers and other aspects of our supply chain and customer delivery network. Additionally, we are in the process of architecting and implementing a new fully integrated back-end operating platform, inclusive of the supply chain network, the home delivery experience as well as a new metric driven quality system and enhanced corporate decision data. Some of these efforts may require us to make significant expenditures in periods in the near term, which may also have a negative effect on our results of operations if there is no associated increase in revenues or decrease in returns or if any such effect is less than anticipated. There can be no assurance however that any of these efforts will be successful or that we will not encounter additional difficulties in achieving higher levels of customer satisfaction.
We are also engaged in initiatives to rationalize our SKU count, and in order to realize the anticipated benefits of such initiatives, including through lower inventories and reduced working capital, we have focused on optimizing the use of our distribution centers, furniture home delivery centers and outlets. For example, we have consolidated our distribution center network and we are in the process of opening new outlet and home delivery center locations and reconfiguring our furniture home delivery centers and outlets in order to streamline our operations. While we believe that optimizing and consolidating our distribution centers and other aspects of our supply chain and customer delivery network will allow us to more efficiently manage our inventory and optimize our uses of capital, in the short term such strategy may result in additional costs, including increased freight costs and lease early termination fees. Furthermore, in the past, during periods of significant customer growth and demand, we have found that our distribution centers often run at capacity. If we fail to accurately anticipate the future capacity requirements of our distribution centers, we may experience delays and difficulties in fulfilling orders and delivering merchandise to customers in a timely manner. Furthermore, we may be unable to remedy such issues quickly as opening additional distribution and home delivery facilities can face operational difficulties, such as disruptions in transitioning fulfillment orders to the new distribution facilities, competition for distribution facility space and problems associated with operating new facilities or reducing the size and changing functions of existing facilities. These difficulties can result in a negative experience for our customers. Any delays in fulfilling orders and delivering merchandise to customers, or related negative experience of our customers, could harm our results of operations.
PART I |
FORM 10-K | 21 |
We currently rely upon independent third-party transportation providers for the majority of our product shipments, which subjects us to certain risks.
We currently rely upon independent third-party transportation providers for product shipments from our vendors to our stores and to our customers outside of certain areas. Our utilization of third-party delivery services for shipments is subject to risks, including increases in fuel prices, which would increase our shipping costs, as well as strikes, work stoppages and inclement weather, which may impact shipping companies’ abilities to provide delivery services that adequately meet our shipping needs. For example, strikes or even threat of strikes involving longshoreman and clerical workers at ports in the past have completely shut down such ports for periods of time, impacting retail and other industries. If we change shipping companies, we could face logistical difficulties that could adversely affect deliveries and we would incur costs and expend resources in connection with such change. Moreover, we may not be able to obtain terms as favorable as those received from the third-party transportation providers we currently use, which in turn would increase our costs.
Our operations have significant liquidity and capital requirements and depend on the availability of adequate financing and sources of capital on reasonable terms. We have elected to raise substantial amounts of capital through debt which exposes our business to risks related to obligations of indebtedness including the terms and conditions of debt financing and the need to manage our financial resources in order to repay such debt in accordance with its terms.
We have historically relied on the availability of debt financing as one primary source of capital in order to fund our operations, including borrowings under our revolving line of credit under our ABL Credit Agreement. We have also incurred indebtedness to finance other strategic initiatives, including our share repurchase programs, and we may continue to incur indebtedness to support such initiatives in future time periods.
We completed convertible debt financings in fiscal 2014 ($350 million), fiscal 2015 ($300 million), fiscal 2018 ($335 million) and fiscal 2019 ($350 million) for an aggregate principal amount of $1,335 million. We have completed repayment of the first two of these convertible notes financings in connection with their final maturity in an aggregate principal amount of $650 million. In addition, holders of a substantial portion of the remaining two series of convertible notes have elected to exercise the early conversion option applicable with respect to these convertible notes. We had $294 million remaining in aggregate principal amount of these remaining two series of convertible notes outstanding as of January 29, 2022. Based upon the strength in our common stock price, we expect that holders of these remaining two series of convertible notes may continue to elect early conversion of such notes in advanced of the scheduled maturity dates.
On October 20, 2021, RHI entered into a Term Loan Credit Agreement with respect to an initial term loan in an aggregate principal amount equal to $2.0 billion with a maturity date of October 20, 2028. Our existing indebtedness and any other indebtedness we may incur in the future could have significant consequences on our future operations and financial results, including:
making it more difficult for us to meet our payments and other obligations;
reducing the availability of our cash flows to fund working capital, capital expenditures, acquisitions or strategic investments and other general corporate requirements, and limiting our ability to obtain additional financing for these or other purposes;
subjecting us to increased interest expense related to any indebtedness we may incur with variable interest rates;
limiting our flexibility in planning for, or reacting to (and increasing our vulnerability to), changes in our business, the industry in which we operate and the general economy; and
placing us at a competitive disadvantage compared to our competitors that have less debt or are less leveraged.
Any of the foregoing factors could have an adverse effect on our business, financial condition, results of operations, or ability to meet our payment obligations.
Our ABL Credit Agreement and Term Loan Credit Agreement contain various restrictive covenants, including, among others, limitations on the ability to incur liens, make loans or other investments, incur additional debt, issue additional equity, merge or consolidate with or into another person, sell assets, pay dividends or make other distributions, or enter into transactions with affiliates. These restrictive covenants may limit the amount of borrowings available to us under our ABL Credit Agreement and our operational and financial flexibility. We may face financial and contractual consequences to the extent we are not able to maintain our compliance with such covenants, which could have a materially adverse effect on our business, financial condition and results of operations.
22 | FORM 10-K |
PART I |
We will have significant capital requirements for the operation of our business in the near term if we are to continue to pursue all of our current business initiatives. We have substantial capital requirements related to investments in our business, our real estate strategy, our international expansion, the development of new businesses and our significant number of concurrent initiatives. We have invested significant capital expenditures in remodeling and opening new Galleries, and these capital expenditures have increased in the past and may continue to increase in future periods as we open additional Design Galleries, which may require us to undertake upgrades to historical buildings or construction of new buildings. During fiscal 2021, our adjusted capital expenditures were $254 million, inclusive of cash received related to landlord tenant allowances of $22 million. The exact scope of our capital plans in future fiscal years, including fiscal 2022, will depend on a variety of factors including the level of gross capital expenditures that we undertake in our business, the amount of any proceeds from the sale of assets, including sales of real estate, and the way that our business performs. We may elect to pursue additional capital expenditures beyond those that are anticipated during any given fiscal period inasmuch as our strategy is to be opportunistic with respect to our investments and we may choose to pursue certain capital transactions based on the availability and timing of unique opportunities.
At various times we have elected to incur substantial levels of aggregate indebtedness in connection with our business including in connection with our share repurchase program. Although we have previously been successful in reducing such indebtedness due in part to the strong cash flow of our business, we may in the future elect to incur further debt in addition to the $2.0 billion of debt that we raised in October 2021 in connection with our Term Loan Credit Agreement. Existing and future increases in debt and in the aggregate level of our indebtedness could expose us to greater risks in the event of a financial or operational downturn or other events including unanticipated adverse developments that affect our financial performance or the ability to access financial markets. To the extent we pursue additional debt as a source of liquidity, our capitalization profile may change and may include significant leverage, and as a result we may be required to use future liquidity to repay such indebtedness and may be subject to additional terms and restrictions which affect our operations and future uses of capital. Our ability to raise funds will depend in part on the capital markets and our financial condition at such time and we cannot assure you that we will be able to raise necessary funds on favorable terms, if at all, or that future financing requirements would not be dilutive to holders of our capital stock. If we fail to raise sufficient additional funds, we may not be able to meet our payment obligations under our convertible senior notes and other debt obligations. We may also be required to delay or abandon some of our planned future expenditures or aspects of our current operations.
In addition, while we anticipate that we should be able to repay our debt maturities as they come due, there can be no assurance that we will have sufficient financial resources at the maturity of any specific indebtedness, whether upon its stated maturity or otherwise. In particular, we may need to incur additional debt or refinance existing debt in order to achieve repayment of existing debt. If the Company is not able to arrange financing to repay its debt obligations, or to extend the maturities of existing debt or otherwise refinance the Company’s obligations as needed, we may experience a material adverse effect on our business and operations.
Our business is dependent on certain key personnel; if we lose key personnel or are unable to hire additional qualified personnel, our business may be harmed.
The success of our business depends upon our ability to retain continued service of certain key personnel, particularly our Chairman and Chief Executive Officer, Gary Friedman, and our ability to attract and retain additional qualified key personnel in the future. We have experienced a number of changes in our senior leadership in recent years and face risks related to losses of key personnel and to any such changes that occur in key senior leadership positions. Any disruption in the services of our key personnel could make it more difficult to successfully operate our business and achieve our business goals and could adversely affect our results of operation and financial condition. These changes could also increase the volatility of our stock price.
Many of our key personnel periodically travel together while on company business. We do not have a policy that prohibits key officers and directors from flying together, whether flying commercially or in our corporate aircraft. We face risks related to any loss of key personnel that might arise as a result of such travel arrangements. In addition, we do not maintain key man life insurance policies on any of our key personnel. As a result, we may not be able to cover the financial loss we may incur in losing the services of any of our key personnel.
PART I |
FORM 10-K | 23 |
Competition for qualified employees and personnel is intense, particularly in the retail and hospitality industry. In addition, the San Francisco Bay Area, where our headquarters are located, is a high cost of living location in which there is vigorous competition for qualified personnel. The process of identifying personnel with the combination of skills and attributes required to carry out our goals is often lengthy and the cost of securing the right talent can be substantial. Our success depends to a significant degree upon our ability to attract, retain and motivate qualified senior leadership, marketing and sales personnel, and store managers, and upon the continued contributions of these people. In addition, our complex operations require the services of qualified and experienced senior leadership personnel, with expertise in the areas including information technology and supply chain management. We cannot assure you that we will be successful in attracting and retaining qualified executives and personnel. In addition, we are pursuing a dynamic business model which is subject to a number of new business initiatives as we seek to optimize our business and financial performance. As a result of the ongoing evolution of our business, we frequently implement changes to our organizational design in order to more closely align our senior leadership structure with the needs of the business. In connection with such changes to our senior leadership structure, we also implement changes in personnel and reductions in force as a result of which we may incur severance costs and other reorganization charges and expenses. Changes in our organizational structure may also have an impact on retention of personnel.
Inasmuch as our success depends in part upon our ability to attract, motivate and retain a sufficient number of store and other employees who understand and appreciate our corporate culture and customers. Turnover in the retail industry and food and beverage industry is generally high. Excessive employee turnover will result in higher employee costs associated with finding, hiring and training new store employees. If we are unable to hire and retain store and other personnel capable of consistently providing a high level of customer service, our ability to open new stores, service the needs of our customers and expand our food and beverage business may be impaired, the performance of our existing and new stores and operations could be materially adversely affected and our brand image may be negatively impacted.
Material damage to, or interruptions in, information systems as a result of external factors, staffing shortages, cybersecurity breaches or cyber fraud, or difficulties in updating our existing software or developing or implementing new software could have a material adverse effect on our business or results of operations, and we may be exposed to risks and costs associated with protecting the integrity and security of our customers’ information.
We depend largely upon our information technology systems in the conduct of all aspects of our operations, many of which we have only adopted and implemented within the past several years or are in the midst of implementing. These systems can be complex to develop, maintain, upgrade and protect against emerging threats, and we may fail to adequately hire or retain adequate personnel to manage our information systems, we may fail to accurately gauge the level of financial and managerial resources to invest in our information systems, or we may fail to realize the anticipated benefits of resources invested in our information systems particularly as our business changes as a result of the many initiatives that we are pursuing. Any material interruptions or failures in our systems or the products or systems of our third party vendors or other third parties that we share data with may have a material adverse effect on our business or results of operations.
Over the last several years, there has been a substantial increase in the scope of reported cybersecurity attacks. During this time, we have experienced numerous cybersecurity attacks and have had to expend increasing amounts of human and financial capital to address this issue. We expect that these cybersecurity attacks will continue and that the scope of sophistication of these efforts may increase in future periods. While we aim to remediate known vulnerabilities on a timely basis, and to adopt countermeasures to address risks, we do not expect that our efforts will eliminate these risks or result in 100% success in thwarting attacks. Any failure to address vulnerabilities in a timely and comprehensive matter, including shortcomings in our efforts to timely replace and upgrade network equipment, servers, or other technology assets, could result in a successful breach of our systems.
Our operations are also dependent on the information technology systems and cybersecurity measures of third parties including our vendors, a number of whom have experienced cybersecurity attacks. In addition, our information systems can face risks to the extent we acquire new businesses but are not able to quickly or comprehensively integrate such acquired businesses into our policies and procedures for addressing cybersecurity risks or identify and address weaknesses in such acquired entity’s information systems, which risks may be compounded to the extent the information systems of an acquired entity are integrated with ours, thus providing access to a broader set of sensitive customer information through a compromised network at the acquired entity level.
24 | FORM 10-K |
PART I |
In addition, for our business to function successfully, we and other market participants must be able to handle and transmit confidential and personal information securely, including in customer orders placed through our website. That information includes data about our customers, including personally identifiable information and credit card information, as well as sensitive information about our vendors and workforce, including social security numbers and bank account information. Various jurisdictions have enacted additional laws and regulations to protect consumers against identity theft, including laws governing treatment of personally identifiable information. For example, the EU General Data Protection Regulation (“GDPR”), which took effect in May 2018, and the California Consumer Privacy Act, which took effect in January 2020, impose stringent requirements on how we and third parties with whom we contract collect and process personal information, and provide for significant penalties for noncompliance. These laws have increased the costs of doing business and, if we fail to implement appropriate safeguards or we fail to detect and provide prompt notice of unauthorized access as required by some of these laws, we could be subject to potential claims for damages and other remedies. If we were required to pay any significant amount in satisfaction of claims under these laws, or if we were forced to cease our business operations for any length of time as a result of our inability to comply fully with any such law, our business, results of operations and financial condition could be adversely affected. We may also incur legal costs if we are required to defend our methods of collection, processing and storage of personal data. Investigations, lawsuits, or adverse publicity relating to our methods of handling personal data could result in increased costs and negative market reaction.
If our systems, or those of third parties on whom are business depends, are damaged, interrupted or subject to unauthorized access, information about our customers, vendors or workforce could be stolen or misused. Any security breach could expose us to risks of data loss, fines, litigation and liability and could seriously disrupt our operations and harm our reputation, any of which could adversely affect our business. We may be subject to one or more claims or lawsuits related to the intentional or unintentional release of confidential or personal information, including personally identifiable information about our customers, vendors or workforce. In addition to the possibility of fines, lawsuits and other claims, we could be required to expend significant resources to change our business practices or modify our service offerings in connection with the protection of personally identifiable information, which could have a material adverse effect on our business. Any breach could also cause consumers to lose confidence in the security of our website and information technology systems and choose not to purchase from us.
We are also subject to payment card association rules and network operating rules, including data security rules, certification requirements and rules governing electronic funds transfers, which could change over time. For example, we are subject to payment card industry data security standards, which contain compliance guidelines and standards with regard to our security surrounding the physical and electronic storage, processing and transmission of individual cardholder data. In addition, if our internal systems are breached or compromised, we may be liable for card re-issuance costs, subject to fines and higher transaction fees and lose our ability to accept credit and/or debit card payments from our members, and our business and operating results could be adversely affected.
We currently maintain insurance to protect against cybersecurity risks and incidents. However, there can be no assurance that such insurance coverage will be available in the future on commercially reasonable terms or at commercially reasonable rates. In addition, insurance coverage may be insufficient or may not cover certain cybersecurity losses and liability.
PART I |
FORM 10-K | 25 |
We face product liability risks and certain of our products may be subject to recalls or other actions by regulatory authorities, and any such recalls or similar actions could have a material adverse effect on our business and reputation.
We face product liability, product safety and product compliance risks relating to the design, manufacturing, raw material sourcing, testing, contents, importation, sale, use and performance of some of our products. The products we sell must be designed and manufactured to be safe for their intended purposes. Some of our products must comply with certain federal and state laws and regulations. For example, some of our products are subject to the Consumer Product Safety Act, as amended by the Consumer Product Safety Improvement Act of 2008 (the “CPSIA”) and the Federal Hazardous Substances Act, which empower the Consumer Product Safety Commission (the “CPSC”) to establish product bans, substance bans, substance limits, performance requirements, test methods and other compliance verification processes. The CPSC is empowered to take action against hazards presented by consumer products, up to and including product recalls. We are required to report certain incidents related to the safety and compliance of our products to the CPSC, and failure to do so could result in a civil penalty. The CPSC is particularly active in regulation and enforcement activities related to the kinds of children’s products sold in our RH Baby & Child division. Certain of the products we sell are subject to the Lacey Act, prohibiting the importation and sale of products containing illegally harvested wood, among other things. Likewise, many of our products are subject to the regulations of the California Air Resources Board (the “CARB”) and the Environmental Protection Agency regarding formaldehyde emissions from composite wood products (e.g., plywood and medium density fiberboard). If we experience negative publicity, regardless of any factual basis, customer complaints or litigation alleging illness or injury, related to our products, or if there are allegations of failure to comply with applicable regulations, our brand reputation would be harmed.
We maintain a product safety and compliance program to help ensure our products are safe, legal and made consistently in compliance with our values. Nevertheless, our products have in the past (including during fiscal 2021) been, and may in the future be, subject to recall for product safety and compliance reasons. Our efforts to address the sources of these product recalls, including those due to products sourced from our vendors, may not be successful and we may continue to face additional product recalls. Concerns of product safety and compliance could result in future voluntary or involuntary removal of products, product recalls, other actions by applicable government authorities or product liability, personal injury or property damage claims. To the extent future product recalls create a negative public perception of our business, we could face reputational harm or could be subject to elevated levels of legal claims. There can be no assurance that we will have the benefit of adequate insurance or payments from third parties including our product vendors in order to address losses and expenses that we may incur in connection with product recalls. Not all of the costs and expenses that we have previously incurred in connection with product recalls have been covered by insurance or reimbursement from third parties including our product vendors. We and our product vendors may be unable to obtain such insurance or the insurance may be prohibitively expensive and any coverage that is available may be inadequate to cover costs we incur in connection with product recalls.
Legislators and regulators in the U.S., Canada and the U.K., where our products are sold, continue to adopt new product laws and regulations. These new laws and regulations have increased or likely will increase the regulatory requirements governing the manufacture and sale of certain of our products as well as the potential penalties for noncompliance. In addition, product recalls, removal of products, product compliance enforcement actions and defending product liability claims can result in, among other things, lost sales, diverted resources, potential harm to our reputation and increased customer service costs, any of which could have a material adverse effect on our business and results of operations.
We are involved in legal and regulatory proceedings from time to time that may affect our Company and/or our senior leadership including litigation, claims, investigations and regulatory and other proceedings, which could distract senior leadership from our business activities and result in significant liability.
From time to time, we and/or members of our senior leadership team are involved in legal and regulatory proceedings including litigation, claims, investigations and regulatory and other proceedings related to a range of matters in connection with the conduct of our business, including (i) privacy and data security, (ii) our labor and employment practices, including laws related to discrimination, wages and benefits, ERISA and disability claims, (iii) intellectual property issues with respect to copyright, trademarks, patents and trade dress, (iv) trade and business practices including unfair competition and unfair business practices, (v) consumer class action claims relating to our consumer practices including the collection of zip code or other information from customers, (vi) product safety and compliance including products liability, product recalls personal injury, (vii) advertising and promotion of products and services, including class actions and regulatory actions related to advertising, (viii) compliance with securities laws including class actions related to allegations of securities fraud, (ix) taxation, (x) contractual disputes, and (xi) health and safety regulations.
26 | FORM 10-K |
PART I |
Claims and legal proceedings may involve arbitration, mediation, private litigation, class action matters, derivative claims, internal and governmental investigations and enforcement matters. We are subject to regulatory oversight and legal enforcement by a range of government and self-regulatory organizations including federal, state and local governmental bodies both within the U.S. and in other jurisdictions where we operate such as, among others, the Equal Employment Opportunity Commission, the CPSC, the Federal Trade Commission, the Department of Labor, the SEC, FINRA, the NYSE, the Department of Justice and numerous state and local governmental authorities including state attorney generals and state agencies. Litigation against us, depending on the outcome of such claims, could lead to further claims and proceedings including on new and otherwise unrelated matters, for example by attracting the attention of plaintiff’s firms or of regulators.
In the past we have faced certain securities litigation matters, including securities class action cases that were consolidated by the court (the “Class Action Case”) and certain related legal proceedings (collectively, the “Derivative Case”)and various governmental investigations including with respect to trading in our securities. We settled the Class Action Case, and the court granted final approval of the Class Action Case settlement on October 25, 2019 and entered a final judgment dismissing the action, and such settlement has been funded entirely by our insurance carriers. On March 24, 2020, we reached an agreement in principle to settle the Derivative Case and subsequently entered into a stipulation of settlement that was preliminarily approved by the Court on August 3, 2020. The settlement involved certain non-monetary terms as well as payment of the plaintiffs’ attorneys’ legal fees, which payment was funded entirely by our insurance carriers. On October 6, 2020, the Court held a final settlement hearing. On December 18, 2020, the court granted final approval of the settlement and entered a final judgment dismissing the action.
Legal proceedings and investigations often involve complex factual, legal and other issues, which are subject to risks and uncertainties and which could require significant leadership time that could otherwise be focused on our operations. Furthermore, legal proceedings and investigations where the related matters under review involve members of our leadership team could distract our senior leadership from the operation of our business, damage the reputation of our leadership team and otherwise materially adversely affect our operations and leadership morale. Litigation, investigation and other claims and regulatory proceedings against or involving members of our senior leadership team or us could result in unexpected expenses and liability and could also materially adversely affect our operations and our reputation. We maintain insurance for legal proceedings but there can be no assurance that such insurance will be available for the payment of all or any portion of the costs associated with any particular investigation, legal proceedings or other claims against us, or that coverage under any such insurance will be adequate to fund the full cost of any such legal proceedings including the costs of investigation, defense and resolution of any such legal proceedings.
Intellectual property claims by third parties or our failure or inability to protect our intellectual property rights could diminish the value of our brand and weaken our competitive position.
Third parties have in the past asserted, and may in the future assert, intellectual property claims against us, particularly as we expand our business to include new products and product categories, and expand in new geographic markets, where intellectual property laws and rights differ. Our defense of any claim, regardless of its merit, could be expensive and time consuming and could divert senior leadership resources. Successful infringement claims against us could result in significant monetary liability and prevent us from selling some of our products or using some of our trademarks in certain geographic markets. In addition, resolution of claims may require us to redesign some of our products, license rights from third parties or stop selling some of our products altogether, or to cease using some of our trademarks, which could have a material adverse impact on our business, financial condition or results of operations. We currently rely on a combination of copyright, trademark, patent, trade dress and unfair competition laws, as well as confidentiality procedures and licensing arrangements, to establish and protect our intellectual property rights. We believe that our trademarks, copyrights (including in photographs, Source Books and our website), and other proprietary rights have significant value and are important to identifying and differentiating our brand and certain of our products from those of our competitors and creating and sustaining demand for certain of our products. We have from time to time encountered other retailers selling products substantially similar to our products or misrepresenting that the products such retailers were selling were our products. We cannot assure you that the steps taken by us to protect our intellectual property rights will be adequate to prevent infringement of our rights by others, including imitation of our products and misappropriation of our images and brand, particularly in jurisdictions that do not have strong intellectual property protection or in which we do not have strong rights. The costs of defending and enforcing our intellectual property assets may incur significant time and legal expense, and we may not be entirely successful in protecting our assets, enforcing our rights or collecting on judgments as a prevailing party. If we are unable to protect and maintain our intellectual property rights, the value of our brand could be diminished and our competitive position could suffer.
PART I |
FORM 10-K | 27 |
Compliance with laws, including laws relating to our business activities outside of the U.S., may be costly, and changes in laws could make conducting our business more expensive or otherwise change the way we do business.
We are subject to numerous regulations, including labor and employment, customs, truth-in-advertising, consumer protection, e-commerce, privacy, health and safety, real estate, environmental and zoning and occupancy laws, intellectual property laws and other laws and regulations that regulate retailers, food and beverage providers or otherwise govern our business. In addition, to the extent we expand our operations as a result of engaging in new business initiatives or product lines, pursuing our multi-tier real estate strategy or expanding into new international markets, we may become subject to new regulations and regulatory regimes. We may need to continually reassess our compliance procedures, personnel levels and regulatory framework in order to keep pace with the numerous business initiatives that we are pursuing, and there can be no assurance that we will be successful in doing so. If the regulations applicable to our business operations were to change or were violated by us or our vendors or buying agents, the costs of certain goods could increase, or we could experience delays in shipments of our goods, be subject to fines or penalties, or suffer reputational harm, which could reduce demand for our products and harm our business and results of operations. In addition to increased regulatory compliance requirements, changes in laws could make ordinary conduct of our business more expensive or require us to change the way we do business. In addition, as a retail business, changes in laws related to employee benefits and treatment of employees, including laws related to limitations on employee hours, supervisory status, leaves of absence, mandated health benefits or overtime pay, could negatively impact us by increasing compensation and benefits costs for overtime and medical expenses. Changes to U.S. health care laws, or potential global and domestic greenhouse gas emission requirements and other environmental legislation and regulations, could result in increased direct compliance costs for us (or may cause our vendors to raise the prices they charge us in order to maintain profitable operations because of increased compliance costs), increased transportation costs or reduced availability of raw materials.
The foreign and U.S. laws and regulations that are applicable to our operations are complex and may increase the costs of regulatory compliance, or limit or restrict the products or services we sell or subject our business to the possibility of regulatory actions or proceedings. The U.S. Foreign Corrupt Practices Act, and other similar laws and regulations, generally prohibit companies and their intermediaries from making improper payments to foreign governmental officials for the purpose of obtaining or retaining business. While our policies mandate compliance with applicable laws and regulations, including anti-bribery laws and other anti-corruption laws, we cannot assure you that we will be successful in preventing our employees or other agents from taking actions in violation of these laws or regulations. Such violations, or allegations of such violations, could disrupt our business and result in a material adverse effect on our financial condition, results of operations and cash flows.
Labor organizing and other activities could negatively impact us.
Currently, none of our employees are represented by a union. However, our employees have the right at any time to form or affiliate with a union, and union organizational activities have occurred from time to time. We cannot predict the negative effects that any future organizing activities will have on our business and operations. If we were to become subject to work stoppages, we could experience disruption in our operations and increases in our labor costs, either of which could materially adversely affect our business, financial condition or results of operations. In addition, one of our key value-driving strategies involves the development and introduction of new Gallery locations. We pursue a range of different real estate development models for these projects. In a number of these projects, we perform a significant role in various aspects of the design and construction of the Gallery location. Both we and third party contractors that we use in these construction projects may be subject to efforts and activities by organized labor to drive the hiring of union labor on these projects. To the extent that union workers are not involved in these projects, we and our third party contractors may be subject to picketing and other labor actions that could affect our business including protests in front of our Gallery locations in order to discourage our customers from entering our stores, which could adversely affect our business at those locations and our results of operations, including our same-store sales metrics. In addition, to the extent that we become more directly involved in additional aspects of the construction work at our Gallery locations, we could be subject to additional pressure from organized labor including union organizing efforts.
28 | FORM 10-K |
PART I |
Fluctuations in our tax obligations and effective tax rate and realization of our deferred tax assets, including net operating loss carryforwards, may result in volatility of our results of operations.
We are subject to income taxes in the U.S. and certain foreign jurisdictions. We record income tax expense based on our estimates of future payments, which include reserves for uncertain tax positions in multiple tax jurisdictions, and valuation allowances related to certain net deferred tax assets, including net operating loss carryforwards. At any one time, many tax years are subject to audit by various taxing jurisdictions. The results of these audits and negotiations with taxing authorities may affect the ultimate settlement of these issues. We expect that throughout the year there could be ongoing variability in our quarterly tax rates as events occur and exposures are evaluated. In addition, our effective tax rate in a given financial statement period may be materially impacted by changes in the mix and level of earnings, timing of the utilization of net operating loss carryforwards, changes in the valuation allowance for deferred taxes or by changes to existing accounting rules or regulations.
Changes to accounting rules or regulations may adversely affect our results of operations.
New accounting rules or regulations and varying interpretations of existing accounting rules or regulations have occurred and may occur in the future. It is difficult to predict the impact of future changes to accounting principles or current accounting practice and the exact impact of such changes may not be what we anticipate. A change in accounting rules or regulations may even affect our reporting of transactions completed before the change is effective and future changes to accounting rules or regulations or the questioning of current accounting practices may adversely affect our results of operations. For example, we adopted Accounting Standards Update 2016-02—Leases (Topic 842) in the first quarter of fiscal 2019, the adoption of which materially impacted our financial statements including (i) our consolidated balance sheets due to the initial recognition of right of use assets and lease liabilities for our operating and finance lease arrangements, (ii) our consolidated statements of income, specifically cost of goods sold and interest expense—net, primarily due to the change from the build-to-suit lease transactions under the previous accounting guidance to the new finance lease classification treatment, and (iii) our cash flows due to amortization and interest expense for our operating and finance lease arrangements and classification of landlord assets under construction. For information regarding recently issued accounting pronouncements, refer to “Recently Issued Accounting Standards” within Note 3—Significant Accounting Policies in our consolidated financial statements within Part II of this Annual Report on Form 10-K.
We may be unsuccessful in identifying attractive acquisition opportunities or, to the extent that we pursue attractive acquisition opportunities, we may be unsuccessful in completing or realizing the expected benefits of such acquisitions.
As part of exploring growth opportunities, we may from time to time seek to acquire value-creating, add-on businesses that we believe will broaden our existing position and market reach and have completed several different acquisitions in recent years. For example, in fiscal 2016, we acquired a controlling interest in Waterworks. In the fourth quarters of fiscal 2018 and fiscal 2017, we recorded goodwill impairment charges of $17 million and $34 million, respectively, with respect to Waterworks due to indicators identified in the fourth quarters of fiscal 2018 and fiscal 2017 that there could be an impairment of the Waterworks reporting unit. In addition, in the first quarter of fiscal 2020 and fourth quarter of fiscal 2018, we recorded tradename impairment charges of $20 million and $15 million, respectively, with respect to Waterworks due to indicators identified in the first quarter of fiscal 2020 and fourth quarter of fiscal 2018 that there could be an impairment of the Waterworks reporting unit. Refer to Note 3—Significant Accounting Policies in our consolidated financial statements within Part II of this Annual Report on Form 10-K. There can be no assurance that the Waterworks business will meet its future operating or financial objectives and if its results do not improve we may recognize additional charges related to this business and our financial results of operation may be adversely affected. Furthermore, there can be no assurance that in the future we will be able to find suitable businesses to purchase if we choose to acquire additional businesses, that we will be able to acquire such businesses on acceptable terms, that we will be successful in realizing the benefits of any acquisition we pursue or that any of the businesses which we acquire will meet our objectives. If we are unsuccessful in any such acquisition efforts, then our ability to continue to grow at rates we anticipate could be adversely affected. The success of any completed acquisition will depend on our ability to effectively manage the business after the acquisition.
PART I |
FORM 10-K | 29 |
Our total assets include intangible assets with an indefinite life, goodwill, tradename, trademarks, and other intellectual property, and substantial amounts of long-lived assets, principally property and equipment and lease right-of-use assets. Changes to estimates or projections used to assess the fair value of these assets, or results of operations that are lower than our current estimates at certain store locations, may cause us to incur impairment charges that could adversely affect our results of operations.
Our total assets include intangible assets with an indefinite life, goodwill, tradename, trademarks and domain names, patents, copyrights, trade secrets, and substantial amounts of property and equipment and lease right-of-use assets. We evaluate these long-lived assets for possible impairment annually or earlier if impairment indicators exist and make certain estimates and projections in connection with the impairment analyses for these long-lived assets. We also review the carrying value of these assets for impairment whenever events or changes in circumstances indicate that the carrying value of the asset may not be recoverable. We will record an impairment loss when the carrying value of the underlying asset, asset group or reporting unit exceeds its fair value. These calculations require us to make a number of estimates and projections of future results. If these estimates or projections change, we may be required to record additional impairment charges on certain of these assets. If these impairment charges were significant, our results of operations would be adversely affected. Refer to “Impairment” within Note 3—Significant Accounting Policies in our consolidated financial statements within Part II of this Annual Report on Form 10 K.
If we are unable to implement and maintain effective internal control over financial reporting in the future, the accuracy and timeliness of our financial reporting may be adversely affected.
We are subject to Section 404 of the Sarbanes-Oxley Act of 2002, as amended (the “Sarbanes-Oxley Act”), which requires us to maintain internal control over financial reporting and to report any material weaknesses in such internal control. We have in the past periodically experienced deficiencies in our internal controls that have been identified during the audit process or at other times. If we identify in the future one or more material weaknesses in our internal control over financial reporting, we will be unable to assert that our internal control over financial reporting is effective. In addition, our independent registered public accounting firm is required to attest to the effectiveness of our internal control over financial reporting. Therefore, even if our senior leadership team concludes that our internal control over financial reporting is effective, our independent registered public accounting firm may issue a report that is qualified if they are not satisfied with our controls or the level at which our controls are documented, designed, operated, or reviewed. Material weaknesses and significant deficiencies may be identified during the audit process or at other times.
Our reporting obligations as a public company place a significant strain on our senior leadership team and our operational and financial resources and systems and will continue to do so for the foreseeable future. In addition, we have experienced changes in personnel who are involved in our financial reporting. Although we believe that we have invested adequate resources in developing and maintaining the procedures, personnel and systems necessary to support our reporting obligations, there can be no assurance that these efforts have been or will be successful. Changes in personnel, systems or procedures, as well as other events might have an adverse impact on our internal controls. Deficiencies in our internal controls or other challenges in the financial reporting aspects of our business may have an adverse impact on our ability to provide financial statements in accordance with generally accepted accounting procedures and may give rise to errors in our financial statement. There can be no assurance that our internal controls and financial reporting infrastructure and personnel have in the past complied, or will continue in the future to comply, with our financial reporting obligations. If we fail to timely achieve and maintain the adequacy of our internal control over financial reporting, we may not be able to produce reliable financial reports. Our failure to achieve and maintain effective internal control over financial reporting could prevent us from filing our periodic reports on a timely basis, which could result in the loss of investor confidence in the reliability of our financial statements, harm our business, and negatively impact the trading price of our common stock.
30 | FORM 10-K |
PART I |
Our operations are subject to risks of natural or man-made disasters, acts of war, terrorism or widespread illness, any one of which could result in a business stoppage and negatively affect our results of operations.
Our business operations depend on our ability to maintain and protect our facilities, computer systems and personnel. Our operations and consumer spending may be affected by natural or man-made disasters or other similar events, including floods, hurricanes, earthquakes, widespread illness, fires, loss of power, interruption of other utilities, industrial accidents, social unrest and riots. In particular, our corporate headquarters is located in Northern California and other parts of our operations are located in Northern and Southern California, each of which is vulnerable to the effects of disasters, including fires and earthquakes that could disrupt our operations and affect our results of operations, and there is evidence that extreme weather, extended drought and shifting climate patterns have intensified the frequency and severity of wildfires in California. Many of our vendors are also located in areas that may be affected by such events. Moreover, geopolitical or public safety conditions which affect consumer behavior and spending, economic conditions, global trade or overall business conditions may adversely affect our business. Terrorist attacks, armed conflict such as what has been occurring in Ukraine, or other hostilities, or threats thereof, in the U.S. or in other countries around the world, as well as future events occurring in response to or in connection with such events and circumstances, could again result in reduced levels of consumer spending or other adverse effects on business conditions. Any of these occurrences could have a significant impact on our results of operations, revenue and costs.
If in the future we encounter difficulties associated with any of our facilities, such as the disruptions we experienced related to the COVID-19 pandemic, or if any of our facilities were to shut down for any reason, including as a result of a natural disaster, we could face shortages of inventory resulting in backorders, significantly higher costs and longer lead times associated with distributing our products to both our stores and online customers and the inability to process orders in a timely manner or ship goods to our customers. Further, any significant interruption in the operation of our customer service centers could also reduce our ability to receive and process orders and provide products and services to our stores and customers, which could result in lost sales, cancelled sales and a loss of loyalty to our brand and have a material adverse effect on our business, financial condition and results of operations.
Risks Related to Ownership of Our Common Stock
Our common stock price may be volatile or may decline regardless of our operating performance.
The market price for our common stock has experienced extreme volatility. As a retailer, our results are significantly affected by factors outside our control, particularly consumer spending and consumer confidence, which can significantly affect our stock price. In addition, the market price of our common stock may fluctuate significantly in response to a number of other factors, including those described elsewhere in this “Risk Factors” section, as well as the following:
macroeconomic conditions including inflation and factors affecting the housing market;
quarterly variations in our results of operations compared to market expectations;
changes in preferences of our customers;
announcements of new products or significant price reductions by us or our competitors;
size of our public float and the price per share of our common stock;
stock price performance of our competitors;
fluctuations in stock market prices and volumes;
default on our indebtedness;
actions by competitors or other shopping center tenants;
changes in senior leadership or key personnel;
changes in financial estimates by securities analysts or failure to meet their expectations;
actual or anticipated negative earnings or other announcements by us or other retail companies;
downgrades in our credit ratings or the credit ratings of our competitors;
natural or man-made disasters or other similar events including health issues such as COVID-19;
PART I |
FORM 10-K | 31 |
issuances or expected issuances of capital stock; and
global economic, legal and regulatory changes unrelated to our performance.
In the future, we may issue our securities in connection with financings or acquisitions. The amount of shares of our common stock issued in connection with financings or acquisitions could result in dilution to our shares of common stock. Sales of substantial amounts of our common stock, or the perception that these sales could occur, could adversely affect the price of our common stock and impair our ability to use common stock or other instruments linked to our common stock as a means of obtaining future financing.
In addition, stock markets have experienced extreme price and volume fluctuations that have affected and continue to affect the market prices of equity securities of many retail companies. Stockholders can institute securities class action litigation following periods of market volatility. We have been subject to such class action securities litigation and may experience further claims of this kind. Any such securities litigation can result in substantial costs and expenses and the attention of our senior leadership could be diverted from our business.
Anti-takeover provisions in our charter documents and Delaware law might discourage or delay acquisition attempts for us that you might consider favorable.
Our certificate of incorporation and bylaws contain provisions that may make the acquisition of our Company more difficult without the approval of our board of directors. These provisions:
establish a classified board of directors so that not all members of our board of directors are elected at one time;
authorize the issuance of undesignated preferred stock, the terms of which may be established and the shares of which may be issued without stockholder approval, and which may include super voting, special approval, dividend or other rights or preferences superior to the rights of the holders of common stock;
prohibit stockholder action by written consent, which requires all stockholder actions to be taken at a meeting of our stockholders;
provide that our board of directors is expressly authorized to make, alter or repeal our bylaws; and
establish advance notice requirements for nominations for elections to our board of directors or for proposing matters that can be acted upon by stockholders at stockholder meetings.
Our certificate of incorporation also contains a provision that provides us with protections similar to Section 203 of the Delaware General Corporation Law (“DGCL”), and prevents us from engaging in a business combination with a person who acquires at least 15% of our common stock for a period of three years from the date such person acquired such common stock unless board or stockholder approval is obtained prior to the acquisition, subject to certain exceptions. These anti-takeover provisions and other provisions under Delaware law could discourage, delay or prevent a transaction involving a change in control of our Company, even if doing so would benefit our stockholders. These provisions could also discourage proxy contests and make it more difficult for you and other stockholders to elect directors of your choosing and to cause us to take other corporate actions you desire.
We do not expect to pay any cash dividends for the foreseeable future.
We have never declared or paid any cash dividends on shares of our common stock and do not anticipate that we will pay any such cash dividends for the foreseeable future. Any determination to pay dividends in the future will be at the discretion of our board of directors and will depend upon results of operations, financial condition, contractual restrictions, restrictions imposed by applicable law and other factors our board of directors deems relevant. Accordingly, realization of a gain on your investment will depend on the appreciation of the price of our common stock, which may never occur. Investors seeking cash dividends in the foreseeable future should not purchase our common stock.
32 | FORM 10-K |
PART I |
We face various risks in connection with our share repurchase program.
We have previously allocated a substantial amount of capital to the repurchase of shares of our common stock in open market stock repurchases. Although we believe that such allocation of capital has been very beneficial to our investors, there can be no assurance that future decisions to allocate capital to the repurchase of our shares of common stock or other equity linked instruments will be a beneficial long-term decision for investors in our common stock. We may face a variety of risks associated with allocation of capital to repurchase of our securities including the incurrence of substantial indebtedness to fund such repurchases, the possibility that prices at which we purchase securities will not represent a good investment for our remaining securities holders or the possibility that we allocate capital to such repurchases would mean that adequate investments are not available for other aspects of our business. The amount, timing and execution of our share repurchase program from time to time may fluctuate based on our priorities for the use of cash for other purposes such as operational spending, capital spending, acquisitions or repayment of debt. Changes in our business operations and financial results, regulatory and other legal developments including potential changes in tax laws could also impact our share repurchase program and other capital activities.
Expectations of our company relating to environmental, social and governance factors may impose additional costs and expose us to new risks.
There is an increasing focus from certain investors, customers and other key stakeholders concerning corporate responsibility, specifically related to environmental, social and governance (“ESG”) factors. We expect that an increased focus on ESG considerations will affect some aspects of our operations, particularly as we expand into new geographic markets. There are a number of constituencies that are involved in a range of ESG issues including investors, special interest groups, public and consumer interest groups and third party service providers. As a result, there is an increased emphasis on corporate responsibility ratings and a number of third parties provide reports on companies in order to measure and assess corporate responsibility performance. In addition, the ESG factors by which companies’ corporate responsibility practices are assessed may change in the U.S. and differ in our new geographic markets, which could result in greater expectations of us and cause us to undertake costly initiatives to satisfy such new criteria. Alternatively, if we are unable to satisfy such new criteria, investors may conclude that our policies with respect to corporate responsibility are inadequate. We risk damage to our brand and reputation in the event that our corporate responsibility procedures or standards do not meet the standards set by various constituencies. We may be required to make substantial investments in matters related to ESG which could require significant investment and impact our results of operations. Any failure in our decision-making or related investments in this regard could affect consumer perceptions as to our brand. Furthermore, if our competitors’ corporate responsibility performance is perceived to be greater than ours, potential or current investors may elect to invest with our competitors instead. In addition, in the event that we communicate certain initiatives and goals regarding ESG matters, we could fail, or be perceived to fail, in our achievement of such initiatives or goals, or we could be criticized for the scope of such initiatives or goals. If we fail to satisfy the expectations of investors and other key stakeholders or our initiatives are not executed as planned, our reputation and financial results could be materially and adversely affected.
We expect that our common stock may experience increased trading volatility in connection with our Convertible Notes Financings.
In September 2019, we issued $350 million of 0.00% convertible senior notes due 2024 (the “2024 Notes”). In June 2018, we issued $300 million of 0.00% convertible senior notes due 2023 and, on June 26, 2018, we issued an additional $35 million pursuant to the exercise of an overallotment option granted to the initial purchasers as part of the June 2018 offering (the “2023 Notes” and, together with the 2024 Notes, the “Notes”). In connection with each offering of the Notes, we entered into convertible note hedge transactions with certain counterparties (the “Bond Hedge”) and warrant transactions (the “Warrants” and together with the Notes and the Bond Hedge, the “Convertible Notes Financings”) with the same counterparties (the “hedge counterparties”).
We have been advised that, in connection with establishing their initial hedge positions with respect to the Bond Hedge and Warrants, the hedge counterparties and/or their affiliates would likely purchase shares of our common stock or enter into various derivative transactions with respect to our common stock concurrently with, or shortly after, the pricing of the Notes, including with certain investors in the Notes.
PART I |
FORM 10-K | 33 |
In addition, we expect that many investors in, including future purchasers of, the Notes may employ, or seek to employ, a convertible arbitrage strategy with respect to the Notes. Investors could implement such a strategy by selling short the common stock underlying the Notes and dynamically adjusting their short position while continuing to hold the Notes. Investors may also implement this type of strategy by entering into swaps on our common stock in lieu of or in addition to short selling the common stock. Further, investors in the Notes may periodically modify their arbitrage strategies with respect to the Notes or modify their hedge positions with respect to the Notes from time to time. The hedge counterparties and/or their respective affiliates also may periodically modify their hedge positions from time to time (and are likely to do so during the conversion period relating to any conversion of the Notes or following any repurchase of Notes by us on any fundamental repurchase date or otherwise). Such modifications may be implemented by entering into or unwinding various derivatives with respect to our common stock, and/or by purchasing or selling shares of our common stock or other securities of the Company in secondary market transactions and/or open market transactions. The effect, if any, of these transactions and activities on the market price of our common stock or the trading prices of the Notes (which could affect a noteholder’s ability to convert the Notes or the amount and value of the consideration received upon conversion of the Notes) will depend in part on market conditions and cannot be ascertained at this time.
It is not possible to predict the exact effect that these hedging or arbitrage strategies adopted by holders of the Notes or counterparties to the Bond Hedge and Warrants as well as other market participants will have on the market price of our common stock. These activities could increase (or reduce the size of any decrease in) the market price of our common stock or the Notes. The SEC and other regulatory and self-regulatory authorities have implemented various rules and taken certain actions, and may in the future adopt additional rules and take other actions, that may impact those engaging in short selling activity involving equity securities (including our common stock). Such rules and actions include Rule 201 of SEC Regulation SHO, the adoption by the Financial Industry Regulatory Authority, Inc. and the national securities exchanges of a “Limit Up-Limit Down” program, the imposition of market-wide circuit breakers that halt trading of securities for certain periods following specific market declines, and the implementation of certain regulatory reforms required by the Dodd-Frank Wall Street Reform and Consumer Protection Act of 2010. Any changes in government regulations or other factors that affect the manner in which third parties can engage in hedging strategies, including entering into short sales or swaps on our common stock, could adversely affect the trading prices and the liquidity of the Notes and/or our common stock.
Taken together, the Bond Hedge and Warrants are intended, but not guaranteed, to offset any actual earnings dilution that could occur upon delivery of shares of common stock to satisfy to our conversion obligation under the Notes until our stock price exceeds the strike price of the Warrants. For the 2024 Notes, the corresponding Bond Hedge and Warrants are intended to limit the earnings dilution that our stockholders would experience until the Company’s common stock is above approximately $338.24 per share, the strike price of the 2024 Notes warrant transactions, which represented a 100% premium over the closing price of our common stock at the time we entered into the Bond Hedge and Warrants related to the 2024 Notes. For the 2023 Notes, the corresponding Bond Hedge and Warrants are intended to limit the earnings dilution that our stockholders would experience until the Company’s common stock is above approximately $309.84 per share, the strike price of the 2023 Notes warrant transactions, which represented a 100% premium over the closing price of our common stock at the time we entered into the Bond Hedge and Warrants related to the 2023 Notes. To the extent that the share price for our common stock continues to trade above the applicable exercise price of each series of Warrants related to each series of Notes, these instruments will have a dilutive effect with respect to our common stock. A large amount of holders of the 2023 Notes and 2024 Notes have elected early conversion into shares of our common stock due to market conditions in which our common stock has traded at prices well in excess of the applicable conversion prices for such notes. Upon conversion of such notes, the applicable Bond Hedge with respect to such notes will be terminated while the corresponding Warrants will remain outstanding in accordance with the terms of the Warrants.
We do not make any representation or prediction as to the future direction or magnitude of any potential effect that the transactions described above may have on the price of our common stock. In addition, we do not make any representation that the counterparties to those transactions will engage in these transactions or activities or that these transactions and activities, once commenced, will not be discontinued without notice; the counterparties or their affiliates may choose to engage in, or discontinue engaging in, any of these transactions or activities with or without notice at any time, and their decisions will be in their sole discretion and not within our control.
34 | FORM 10-K |
PART I |
We may issue additional shares of our common stock or instruments convertible into shares of our common stock, including in connection with the conversion of the Notes, and thereby materially and adversely affect the market price of our common stock and the trading prices of the Notes.
We are not restricted from issuing additional shares of our common stock or other instruments convertible into, or exchangeable or exercisable for, shares of our common stock during the life of each of the Notes. If we issue additional shares of our common stock or instruments convertible into shares of our common stock, it may materially and adversely affect the market price of our common stock and, in turn, the trading prices of the Notes. In addition, the conversion of some or all of the Notes may dilute the ownership interests of existing holders of our common stock, and any sales in the public market of any shares of our common stock issuable upon such conversion of the Notes could adversely affect prevailing market prices of our common stock. In addition, the anticipated conversion of the Notes could depress the market price of our common stock. For example, in fiscal 2020 we issued a substantial number of shares of common stock in settlement of the Warrants related to the $300 million of 0.00% convertible senior notes that were issued in June and July 2015.
The fundamental change provisions of the Notes and the terms of the Bond Hedge and Warrants may delay or hinder an otherwise beneficial takeover attempt of us.
The fundamental change purchase rights allow holders of the Notes to require us to purchase all or a portion of their Notes upon the occurrence of a fundamental change. The provisions of the indenture governing the Notes requiring an increase to the conversion rate for conversions in connection with a make-whole fundamental change, including certain corporate transactions such as a change in control, may result in a change in the value of the Notes. Additionally, upon certain change of control transactions, the offsetting Bond Hedge and Warrants that we entered into at the time we issued the Notes may be exercised and/or terminated early. As a result of these provisions, we may be required to make payments to, or renegotiate terms with, holders of the Notes and/or the hedge counterparties.
These features of the Notes and the Bond Hedge and Warrants, including the financial implications of any renegotiation of the above-mentioned provisions, could delay or prevent a change of control, whether or not it is desired by, or beneficial to, our stockholders, and may result in the acquisition of us being on terms less favorable to our stockholders than it would otherwise be, or could require us to pay a portion of the consideration available in such a transaction to holders of the Notes or Warrants or the counterparties to the Bond Hedge.
ITEM 1B. UNRESOLVED STAFF COMMENTS
None.
PART I |
FORM 10-K | 35 |
ITEM 2. PROPERTIES
Leased Properties
As of January 29, 2022, we have approximately 1,981,000 leased gross square feet for 27 Design Galleries, 36 legacy Galleries, 1 RH Modern Gallery, 3 RH Baby & Child Galleries and 14 Waterworks Showrooms. We have approximately 1,190,000 leased gross square feet for 38 outlet stores as of January 29, 2022.
The following table summarizes the location and size of our leased fulfillment centers, home delivery center locations and corporate facilities occupied as of January 29, 2022:
|
LEASED SQUARE FOOTAGE |
|
LOCATION |
(Approximate) |
|
RH Furniture Fulfillment Centers |
|
|
Patterson, California |
|
1,501,000 |
Baltimore (North East), Maryland |
|
1,195,000 |
Ontario, California |
1,001,000 |
|
RH Small-Parcel Fulfillment Center |
|
|
West Jefferson, Ohio (1) |
|
1,224,000 |
Home Delivery Center Locations (2) |
|
1,304,000 |
Waterworks Fulfillment Center |
|
|
Brookfield, Connecticut |
|
160,000 |
Corporate Facilities |
|
|
Corte Madera, California (1) (3) |
|
263,000 |
Pinole, California (4) |
|
200,000 |
Danbury, Connecticut (5) |
|
26,000 |
Other |
|
240,000 |
| (1) | Customer service center and home delivery operations are also performed at this location. |
| (2) | Includes total approximate leased square footage for 21 separate home delivery center locations. |
| (3) | Location of RH Headquarters. Includes approximately 10,000 square feet of warehouse space. |
| (4) | Represents warehouse space. |
| (5) | Location of Waterworks Headquarters. |
We believe that our current offices and facilities are in good condition, are being used productively and are adequate to meet our requirements for the foreseeable future.
For additional information regarding leases, refer to “Lease Accounting” within Note 3—Significant Accounting Policies and Note 11—Leases in our consolidated financial statements within Part II of this Annual Report on Form 10-K.
Owned Property
We own four properties for current and future retail locations, including an approximate 5,400 square foot building that is the location of our Gallery in San Francisco’s Design District, an approximate 54,100 square foot building in England for a future Design Gallery, an approximate 22,100 square foot building in Morris Township, New Jersey for a future Design Gallery, and an approximate 12,500 square foot building in Birmingham, Michigan for a future Design Gallery. The owned properties are part of our RH Segment.
36 | FORM 10-K |
PART I |
ITEM 3. LEGAL PROCEEDINGS
From time to time, we and/or members of our senior leadership team are involved in litigation, claims, investigations and other proceedings relating to the conduct of our business, including purported class action litigation, as well as securities class action litigation. Such legal proceedings may include claims related to our employment practices, wage and hour claims, claims of intellectual property infringement, including with respect to trademarks and trade dress, claims asserting unfair competition and unfair business practices, claims with respect to our collection and sale of reproduction products, and consumer class action claims relating to our consumer practices including the collection of zip code or other information from customers. In addition, from time to time, we are subject to product liability and personal injury claims for the products that we sell and the stores we operate. Subject to certain exceptions, our purchase orders generally require the vendor to indemnify us against any product liability claims; however, if the vendor does not have insurance or becomes insolvent, we may not be indemnified. In addition, we could face a wide variety of employee claims against us, including general discrimination, privacy, labor and employment, ERISA and disability claims. Any claims could result in litigation against us and could also result in regulatory proceedings being brought against us by various federal and state agencies that regulate our business, including the U.S. Equal Employment Opportunity Commission. Often these cases raise complex factual and legal issues, which are subject to risks and uncertainties and which could require significant senior leadership time. Litigation and other claims and regulatory proceedings against us could result in unexpected expenses and liability and could also materially adversely affect our operations and our reputation.
For additional information regarding legal proceedings including certain securities litigation, refer to Note 20—Commitments and Contingencies in our consolidated financial statements within Part II of this Annual Report on Form 10-K.
ITEM 4. MINE SAFETY DISCLOSURES
Not applicable.
PART I |
FORM 10-K | 37 |
PART II
ITEM 5. MARKET FOR REGISTRANT’S COMMON EQUITY, RELATED STOCKHOLDER MATTERS AND ISSUER PURCHASES OF EQUITY SECURITIES
Market Information and Dividend Policy
Our common stock trades under the symbol “RH” on the NYSE.
The number of stockholders of record of our common stock as of January 29, 2022 was 15. This number excludes stockholders whose stock is held in nominee or street name by brokers.
No dividends have been declared or paid on our common stock. We do not currently anticipate that we will pay any cash dividends on our common stock in the foreseeable future.
Stock Performance Graph
This performance graph shall not be deemed “soliciting material” or to be “filed” with the SEC for purposes of Section 18 of the Exchange Act, or otherwise subject to the liabilities under that Section, and shall not be deemed to be incorporated by reference into any filing of RH under the Securities Act of 1933, as amended, or the Exchange Act.
The following graph and table compare the cumulative total stockholder return for our common stock during the five-year period ended January 29, 2022 in comparison to the NYSE Composite Index and the S&P Retailing Select Index, our peer group index. The graph and the table below assume that $100 was invested at the market close on January 27, 2017 in the common stock of RH, the NYSE Composite Index and the S&P Retailing Select Index. Data for the NYSE Composite Index and the S&P Retailing Select Index assumes reinvestments of dividends. The comparisons in the graph and table are required by the SEC and are not intended to be indicative of possible future performance of our common stock.
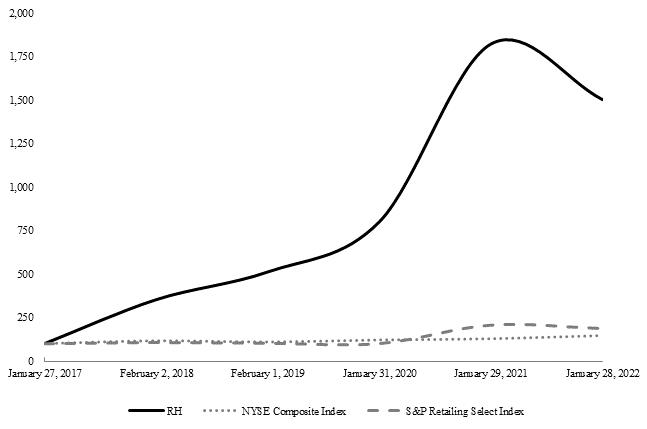
|
|
JANUARY 27, |
|
FEBRUARY 2, |
|
FEBRUARY 1, |
|
JANUARY 31, |
|
JANUARY 29, |
|
JANUARY 28, |
RH |
|
100.00 |
|
352.78 |
|
512.23 |
|
800.11 |
1,822.00 |
1,502.18 |
||
NYSE Composite Index |
|
100.00 |
|
115.97 |
|
109.27 |
|
120.66 |
127.60 |
145.33 |
||
S&P Retailing Select Index |
|
100.00 |
|
106.53 |
|
102.62 |
|
100.57 |
205.81 |
186.18 |
Repurchases of Common Stock
During the three months ended January 29, 2022, we repurchased the following shares of our common stock:
|
|
|
APPROXIMATE DOLLAR |
|||||
AVERAGE |
VALUE OF SHARES THAT |
|||||||
PURCHASE |
MAY YET BE |
|||||||
NUMBER OF |
PRICE PER |
PURCHASED UNDER THE |
||||||
SHARES (1) |
SHARE |
PLANS OR PROGRAMS (2) |
||||||
(in millions) |
||||||||
October 31, 2021 to November 27, 2021 |
|
— |
$ |
— |
$ |
450 |
||
November 28, 2021 to January 1, 2022 |
|
1,961 |
$ |
568.03 |
$ |
450 |
||
January 2, 2022 to January 29, 2022 |
|
378 |
$ |
535.94 |
$ |
450 |
||
Total |
|
2,339 |
|
|
||||
| (1) | Reflects shares withheld from delivery to satisfy exercise price and tax withholding obligations of employee recipients that occur upon the vesting of restricted stock units granted under our 2012 Stock Incentive Plan. |
| (2) | Reflects the dollar value of shares that may yet be repurchased under the $950 Million Repurchase Program authorized by the Board of Directors on October 10, 2018 and replenished on March 25, 2019. There were no shares repurchased under this plan during the three months ended January 29, 2022. |
ITEM 6. RESERVED
Not applicable.
40 | FORM 10-K |
PART II |
ITEM 7. MANAGEMENT’S DISCUSSION AND ANALYSIS OF FINANCIAL CONDITION AND RESULTS OF OPERATIONS
Management’s discussion and analysis of financial condition and results of operations (“MD&A”), contains forward-looking statements that are subject to risks and uncertainties. Refer to “Special Note Regarding Forward-Looking Statements and Market Data” and Item 1A—Risk Factors in this Annual Report on Form 10-K for a discussion of the risks, uncertainties and assumptions associated with these statements. MD&A should be read in conjunction with our historical consolidated financial statements and related notes thereto and the other disclosures contained elsewhere in this Annual Report on Form 10-K. The results of operations for the periods reflected herein are not necessarily indicative of results that may be expected for future periods, and our actual results may differ materially from those discussed in the forward-looking statements as a result of various factors, including but not limited to those listed in Item 1A—Risk Factors and included elsewhere in this Annual Report on Form 10-K.
The discussion of our financial condition and changes in our results of operations, liquidity and capital resources is presented in this section for fiscal 2021 and a comparison to fiscal 2020. The discussion for fiscal 2020 and fiscal 2019 has been omitted from this Annual Report on Form 10-K, but is included in Item 7—Management’s Discussion and Analysis of Financial Condition and Results of Operations on our Form 10-K for the fiscal year ended January 30, 2021, filed with the Securities and Exchange Commission (“SEC”) on March 30, 2021.
MD&A is a supplement to our consolidated financial statements within Part II of this Annual Report on Form 10-K and is provided to enhance an understanding of our results of operations and financial condition. Our MD&A is organized as follows:
Overview. This section provides a general description of our business, including the impacts of the COVID-19 pandemic, and describes our key value-driving strategies.
Factors Affecting Our Results of Operations. This section discusses certain factors that affect our results of operations, including our strategic initiatives, our ability to source and distribute products effectively, consumer preferences and demand, overall economic trends and fluctuations in quarterly results.
How We Assess the Performance of Our Business. This section discusses financial and operating measures that affect our results of operations, including net revenues and demand, gross profit and gross margin, selling general and administrative expenses, adjusted operating income, EBITDA, adjusted EBITDA, adjusted net income and adjusted capital expenditures.
Basis of Presentation and Results of Operations. These sections provide our consolidated statements of income and other financial and operating data, including a comparison of our results of operations in fiscal 2021 compared to fiscal 2020, as well as non-GAAP measures we use for financial and operational decision making and as a means to evaluate period-to-period comparisons.
Liquidity and Capital Resources. This section provides an overview of our sources and uses of cash and our financing arrangements, including our credit facilities and debt arrangements, in addition to the cash requirements for our business, such as our capital expenditures.
Critical Accounting Policies and Estimates. This section discusses the accounting policies and estimates that involve a higher degree of judgment or complexity and are most significant to reporting our consolidated results of operations and financial position, including the significant estimates and judgments used in the preparation of our consolidated financial statements.
Recently Issued Accounting Pronouncements. This section provides a summary of recent authoritative accounting pronouncements that were adopted during fiscal 2021 and that will be adopted in future periods.
PART II |
FORM 10-K | 41 |
Overview
We are a curator of design, taste and style in the luxury lifestyle market. Our curated and fully integrated assortments are presented consistently across our sales channels in sophisticated and unique lifestyle settings. We offer dominant merchandise assortments across a number of categories, including furniture, lighting, textiles, bathware, décor, outdoor and garden, and child and teen furnishings. Our retail business is fully integrated across our multiple channels of distribution, consisting of our retail locations, websites and Source Books. We position our Galleries as showrooms for our brand, while our websites and Source Books act as virtual and print extensions of our physical spaces. We operate our retail locations throughout the United States, Canada, and the U.K., and have an integrated RH Hospitality experience in 13 of our Design Gallery locations, which includes Restaurants and Wine Bars.
As of January 29, 2022, we operated the following number of Galleries, outlets and Showrooms:
COUNT |
||
RH |
||
Design Galleries |
27 |
|
Legacy Galleries |
36 |
|
Modern Galleries |
1 |
|
Baby & Child and TEEN Galleries |
3 |
|
Total Galleries |
67 |
|
Outlets |
38 |
|
Waterworks Showrooms |
14 |
For more information on our company and operations, refer to Item 1—Business.
COVID-19 Pandemic
We have experienced a significant improvement in our business during fiscal 2021 despite the ongoing challenges presented by the COVID-19 pandemic and the disruption it has caused in our business operations beginning in the first quarter of fiscal 2020 and throughout fiscal 2021. Our performance demonstrates both the desirability of our exclusive products and our ability to overcome supply chain challenges, including port delays, which impacted our ability to convert business demand into revenues at normal historical rates. We have continued to navigate changes in operational restrictions based upon changes in local conditions and regulations, and as pandemic-related restrictions continue to be lifted in fiscal 2022 we may see consumer spending patterns shift away from spending on the home and home-related categories, such as home furnishings, and consumers return to pre-COVID consumption trends, such as spending on travel and leisure, and other activities.
Key Value-Driving Strategies
In order to drive growth across our business, we are focused on the following long-term key strategies and business initiatives:
Product Elevation. We have built the most comprehensive and compelling collection of luxury home furnishings under one brand in the world. Our products are presented across multiple collections, categories and channels that we control, and their desirability and exclusivity has enabled us to achieve industry-leading revenues and margins. Our customers know our brand concepts as RH Interiors, RH Modern, RH Beach House, RH Ski House, RH Outdoor, RH Baby & Child, RH TEEN and Waterworks. Our strategy to elevate the design and quality of our product will continue as we introduce RH Contemporary in 2022. We also have plans to introduce RH Couture Upholstery, RH Bespoke Furniture and RH Color over the next several years.
42 | FORM 10-K |
PART II |
Gallery Transformation. Our product is elevated and rendered more valuable by our architecturally inspiring Galleries. We believe our strategy to open new Design Galleries in every major market will unlock the value of our vast assortment, generating a revenue opportunity for our business of $5 to $6 billion in North America. We believe we can significantly increase our sales by transforming our real estate platform from our existing legacy retail footprint to a portfolio of Design Galleries sized to the potential of each market and the size of our assortment. In addition, we plan to incorporate hospitality into most of the new Design Galleries that we open in the future, which further elevates and renders our product and brand more valuable. We believe hospitality has created a unique new retail experience that cannot be replicated online, and that the addition of hospitality drives incremental sales of home furnishings in these Galleries.
Brand Elevation. We are evolving the brand beyond curating and selling product to conceptualizing and selling spaces by building an ecosystem of Products, Places, Services and Spaces designed to elevate and render our product more valuable while establishing the RH brand as a thought leader, taste and place maker. We believe our seamlessly integrated ecosystem of immersive experiences inspires customers to dream, design, dine, travel and live in a world thoughtfully curated by RH, creating an impression and connection unlike any other brand in the world. Our hospitality efforts will continue to elevate the RH brand as we extend beyond the four walls of our Galleries into RH Guesthouses, where our goal is to create a new market for travelers seeking privacy and luxury in the $200 billion North American hotel industry. Additionally, we are creating bespoke experiences like RH Yountville, an integration of Food, Wine, Art & Design in the Napa Valley, RH1 & RH2, our private jets, and RH3, our luxury yacht that is available for charter in the Caribbean and Mediterranean, where the wealthy and affluent visit and vacation. These immersive experiences expose new and existing customers to our evolving authority in architecture, interior design and landscape architecture.
Digital Reimagination. Our strategy is to digitally reimagine the RH brand and business model both internally and externally. Internally our multi-year effort began with the reimagination of our Center of Innovation & Product Leadership to incorporate digitally integrated visuals and decision data designed to amplify the creative process from product ideation to product presentation. Externally our strategy is designed to come to life digitally as we launch The World of RH, an online portal where customers can explore and be inspired by the depth and dimension of our brand. The World of RH will include rich, immersive content with simplified navigation and search functionality, all designed to enhance the shopping experience and render our product and brand more valuable. We believe an opportunity exists to create similar strategic separation online as we have with our Galleries offline, reconceptualizing what a website can and should be.
Global Expansion. We believe that our luxury brand positioning and unique aesthetic have strong international appeal, and that the pursuit of global expansion will provide RH a substantial long-term market opportunity to build a $20 to $25 billion global brand over time. Our view is that the competitive environment globally is more fragmented and primed for disruption than the North American market, and there is no direct competitor of scale that possesses the product, operational platform and brand of RH. As such, we are actively pursuing the expansion of the RH brand globally with the objective of launching international locations in Europe, beginning in 2022 with the opening of RH England, The Gallery at the Historic Aynhoe Park. We have secured a number of locations in various markets in the United Kingdom and continental Europe for future Design Galleries and are in lease or purchase negotiations for additional locations.
Factors Affecting Our Results of Operations
We have experienced a significant improvement in our business during fiscal 2021 despite the ongoing challenges presented by the COVID-19 pandemic and the disruption it has caused in our business operations beginning in the first quarter of fiscal 2020 and throughout fiscal 2021. Substantially all of our retail locations were open for most of fiscal 2021 and demand for our products has been strong, resulting in our record financial performance achieved in fiscal 2021. The emergence of new variants such as the “Delta” and “Omicron” variants have continued to present new challenges, especially constraints in our supply chain, including port delays, which have resulted in some delays in our ability to convert business demand into revenues at normal historical rates. We anticipate that the backlog of orders for merchandise from our vendors, coupled with business conditions related to the evolving nature of the pandemic, will continue to adversely affect the capacity of our vendors and supply chain to meet our merchandise demand levels for at least the next several quarters. Our performance demonstrates both the desirability of our exclusive products and our ability to overcome supply chain challenges that we continue to experience. For more information, refer to Item 1A—Risk Factors—The COVID-19 pandemic poses significant and widespread risks to our business as well as to the business environment and the markets in which we operate and Item 7—Management’s Discussion and Analysis of Financial Condition and Results of Operations—Overview.
Apart from the impact of the COVID-19 pandemic on our business operations and on macroeconomic conditions, below are certain factors that affect our results of operations.
PART II |
FORM 10-K | 43 |
Our Strategic Initiatives. We are in the process of implementing a number of significant business initiatives that have had, and will continue to have, an impact on our results of operations.
As a result of the number of current business initiatives we are pursuing, we have experienced in the past and may experience in the future significant period-to-period variability in our financial performance and results of operations. While we anticipate that these initiatives will support the growth of our business, costs and timing issues associated with pursuing these initiatives can negatively affect our growth rates in the short term and may amplify fluctuations in our growth rates from quarter to quarter. Delays in the rate of opening new Galleries and in pursuit of our international expansion as a result of COVID-19 have resulted in delays in the corresponding increase in revenues that we experience as new Design Galleries are introduced. In addition, we anticipate that our net revenues, adjusted net income and other performance metrics will remain variable as our business model continues to emphasize high growth and numerous, concurrent and evolving business initiatives.
Our Ability to Source and Distribute Products Effectively. Our net revenues and gross profit are affected by our ability to purchase our merchandise in sufficient quantities at competitive prices. Our current and anticipated demand and our level of net revenues have been adversely affected in prior periods by constraints in our supply chain, including the inability of our vendors to produce sufficient quantities of some merchandise to match market demand from our customers, leading to higher levels of customer back orders and lost sales. For example, a number of our vendors have experienced delays in production and shipment of merchandise orders related to direct and indirect effects of the COVID-19 pandemic. In addition, as we introduce new products and expand our merchandise assortments into new categories, we expect to experience delays in the production of some new offerings, as we have had similar experiences during prior periods when we adopted substantial newness in our business such as with the introduction of RH Modern in 2015. During fiscal 2021 and 2020, the lag in manufacturing and inventory receipts related to the COVID-19 pandemic, together with dislocations in our supply chain, resulted in some delays in our ability to convert demand into revenues, and our global supply chain has not fully recovered from the impact of this dislocation. While we expect this dislocation to be resolved in the near term, there can be no assurance as to the exact course that the recovery in our supply chain will take and a number of factors could contribute to further complications in our supply chain, including COVID-19 developments in countries where our vendors produce merchandise. Based on total dollar volume of purchases for fiscal 2021, 69% of our products were sourced from Asia, with 34% sourced from China, 15% from the U.S. and the remainder from other countries and regions. For more information, refer to Item 1A—Risk Factors—The COVID-19 pandemic poses significant and widespread risks to our business as well as to the business environment and the markets in which we operate.
Consumer Preferences and Demand. Our ability to maintain our appeal to existing customers and attract new customers depends on our ability to originate, develop and offer a compelling product assortment responsive to customer preferences and design trends. We have successfully introduced a large number of new products in past periods, which we believe has been a contributing factor in our sales growth and results of operations. Periods in which our products have achieved strong customer acceptance generally have had more favorable results. If we misjudge the market for our products or the product lines that we acquire, we may be faced with excess inventories for some products and may be required to become more promotional in our selling activities, which would impact our net revenues and gross profit.
44 | FORM 10-K |
PART II |
Overall Economic Trends. The industry in which we operate is cyclical, and consequently our net revenues are affected by general economic conditions including conditions that affect the housing market. For example, reduced consumer confidence and lower availability and higher cost of consumer credit reduce demand for our products and limit our ability to increase prices or sustain price increases. We have determined that our customer purchasing patterns are influenced by economic factors including the health and volatility of the stock market. We have seen that previous declines in the stock market and periods of high volatility have correlated with a reduction in consumer demand for our products and may continue in future periods. We target consumers of high-end home furnishings. As a result, we believe that our sales are sensitive to a number of macroeconomic factors that influence consumer spending generally, but that our sales are particularly affected by the health of the higher-end customer and demand levels from that customer demographic. While the overall home furnishings market may be influenced by factors such as employment levels, interest rates, demographics of new household formation and the affordability of homes for the first-time home buyer, the higher-end of the housing market may be disproportionately influenced by other factors, including stock market prices, restrictions on travel due to the COVID-19 pandemic, the number of second and third homes being bought and sold, the number of foreign buyers in higher-end real estate markets in the U.S., tax policies and interest rates, and the perceived prospect for capital appreciation in higher-end real estate. Shifts in consumption patterns linked to the reopening of businesses in light of improvements relating to the COVID-19 pandemic may also have an impact on consumer spending in the high-end housing market. We have in the past experienced volatility in our sales trends related to many of these factors and believe our sales may be impacted by these economic factors in future periods. These headwinds tied to macroeconomic factors may continue in future quarters. For more information, refer to Item 1A—Risk Factors—Changes in consumer spending and factors that influence spending of the specific categories of consumers that purchase from us, including the health of the high-end housing market, may significantly impact our revenue and results of operations and —The COVID-19 pandemic poses significant and widespread risks to our business as well as to the business environment and the markets in which we operate.
Fluctuation in Quarterly Results. Our quarterly results vary depending upon a variety of factors, including changes in our product offerings and the introduction of new merchandise assortments and categories, changes in retail locations, the timing of Source Book releases, and the extent of our realization of the costs and benefits of our numerous strategic initiatives, among other things. As a result of these factors, our working capital requirements and demands may fluctuate during the year. Unique factors in any given quarter may affect period-to-period comparisons, and the results for any quarter are not necessarily indicative of the results that we may achieve for a full fiscal year.
How We Assess the Performance of Our Business
In assessing the performance of our business, we consider a variety of financial and operating measures that affect our results of operations, including:
Net Revenues and Demand. Net revenues reflect our sale of merchandise plus shipping and handling revenue collected from our customers, less returns and discounts. Revenues are recognized when a customer obtains control of the merchandise. We collect annual membership fees related to the RH Members Program, which are recorded as deferred revenue when collected from customers and recognized as revenue based on expected product revenues over the annual membership period.
We also track “demand” in our business, which is a non-GAAP metric linked to the level of customer orders. Demand is an operating metric that we use in reference to the dollar value of orders placed (orders convert to net revenue upon a customer obtaining control of the merchandise) and excludes exchanges and shipping fees.
Gross Profit and Gross Margin. Gross profit is equal to our net revenues less cost of goods sold. Gross profit as a percentage of our net revenues is referred to as gross margin. Cost of goods sold includes the direct cost of purchased merchandise; inventory shrinkage, inventory adjustments due to obsolescence, including excess and slow-moving inventory and lower of cost or net realizable value reserves; inbound freight; all freight costs to get merchandise to our Galleries; design, buying and allocation costs; occupancy costs related to Gallery operations and our supply chain, such as rent and common area maintenance for our leases; depreciation and amortization of leasehold improvements, equipment and other assets in our Galleries and distribution centers. In addition, cost of goods sold includes all logistics costs associated with shipping product to our customers, which are partially offset by shipping income collected from customers (recorded in net revenues on the consolidated statements of income).
PART II |
FORM 10-K | 45 |
Our gross profit and gross margin can be favorably impacted by sales volume increases, as occupancy and certain other costs that are largely fixed do not necessarily increase proportionally with sales volume increases. Changes in the mix of our products may also impact our gross profit and gross margin. We review our inventory levels on an ongoing basis in order to identify slow-moving merchandise and use product markdowns and our outlets to efficiently sell these products. The timing and extent of markdowns are driven primarily by customer acceptance of our merchandise. The primary drivers of the costs of individual goods are raw materials costs, which fluctuate based on a number of factors beyond our control, including commodity prices, changes in supply and demand, general economic conditions, competition, import duties, tariffs and government regulation, logistics costs (which may increase in the event of, for example, expansions of or interruptions in the operation of our distribution centers, furniture home delivery centers and customer service center or damage or interruption to our information systems) and labor costs in the countries where we source our merchandise. We place orders with merchandise vendors primarily in United States dollars and, as a result, are not currently exposed to significant foreign currency exchange risk.
Our gross profit and gross margin may not be comparable to other specialty retailers, as some companies may not include all or a portion of the costs related to their distribution network and store occupancy in calculating gross profit and gross margin as we and many other retailers do, but instead may include them in selling, general and administrative expenses. In addition, certain of our retail leases are accounted for as finance leases, which result in our recording a portion of the expense related to these agreements in interest expense—net on the consolidated statements of income.
In recent periods we have experienced higher cost of goods sold primarily related to our increased costs of merchandise and inbound freight. Our strategy is to offset these higher costs through price increases, as well as efficiencies in our operations. These cost increases are reasonably likely to continue to affect our business in the future given the current macroeconomic conditions. We plan to refine our strategies to continue to address these impacts as they occur.
Selling, General and Administrative Expenses. Selling, general and administrative expenses include all operating costs not included in cost of goods sold. These expenses include payroll and payroll-related expenses, retail expenses other than occupancy and expenses related to many of our operations at our corporate headquarters, including utilities, depreciation and amortization, credit card fees and marketing expense, which primarily includes Source Book production, mailing and print advertising costs. All pre-opening costs are included in selling, general and administrative expenses and are expensed as incurred. We expect certain of these expenses to continue to increase as we open new retail locations and outlets, develop new product categories and otherwise pursue our current business initiatives. Selling, general and administrative expenses as a percentage of net revenues are usually higher in lower-volume quarters and lower in higher-volume quarters because a significant portion of the costs are relatively fixed.
In addition, in recent periods we have experienced increased selling, general and administrative expenses, including certain non-cash compensation expenses and costs associated with asset impairments and lease losses, sale leaseback transactions, reorganizations and product recalls, as discussed in “Basis of Presentation and Results of Operations” below.
Adjusted Operating Income, Adjusted Net Income and Adjusted EBITDA. We believe that adjusted operating income, adjusted net income and adjusted EBITDA are useful measures of operating performance, as the adjustments eliminate non-recurring and other items that are not reflective of underlying business performance, facilitate a comparison of our operating performance on a consistent basis from period-to-period and provide for a more complete understanding of factors and trends affecting our business. We also use adjusted operating income, adjusted net income and adjusted EBITDA as methods for planning and forecasting overall expected performance and for evaluating on a quarterly and annual basis actual results against such expectations.
We define adjusted operating income as consolidated operating income, adjusted for the impact of certain non-recurring and other items that we do not consider representative of our underlying operating performance.
We define EBITDA as consolidated net income before depreciation and amortization, interest expense—net and income tax expense. Adjusted EBITDA reflects further adjustments to EBITDA to eliminate the impact of non-cash compensation, as well as certain non-recurring and other items that we do not consider representative of our underlying operating performance. Because adjusted EBITDA omits non-cash items, we feel that it is less susceptible to variances in actual performance resulting from depreciation, amortization and other non-cash charges and can be more reflective of our operating performance.
We define adjusted net income as consolidated net income, adjusted for the impact of certain non-recurring and other items that we do not consider representative of our underlying operating performance.
Refer to “Non-GAAP Financial Measures” below for further information.
46 | FORM 10-K |
PART II |
Basis of Presentation and Results of Operations
The following table sets forth our consolidated statements of income:
YEAR ENDED |
|||||||||||||
JANUARY 29, |
% OF NET |
JANUARY 30, |
% OF NET |
FEBRUARY 1, |
% OF NET |
||||||||
(dollars in thousands) |
|||||||||||||
Net revenues |
$ |
3,758,820 |
100.0 |
% |
$ |
2,848,626 |
100.0 |
% |
$ |
2,647,437 |
100.0 |
% |
|
Cost of goods sold |
|
1,903,409 |
50.6 |
|
1,523,095 |
53.5 |
|
1,552,426 |
58.6 |
||||
Gross profit |
|
1,855,411 |
49.4 |
|
1,325,531 |
46.5 |
|
1,095,011 |
41.4 |
||||
Selling, general and administrative expenses |
|
928,230 |
24.7 |
|
858,673 |
30.1 |
|
732,180 |
27.7 |
||||
Income from operations |
|
927,181 |
24.7 |
|
466,858 |
16.4 |
|
362,831 |
13.7 |
||||
Other expenses |
|
|
|
|
|
|
|||||||
Interest expense—net |
|
64,947 |
1.7 |
|
69,250 |
2.5 |
|
87,177 |
3.3 |
||||
Tradename impairment |
— |
— |
20,459 |
0.7 |
— |
— |
|||||||
(Gain) loss on extinguishment of debt |
|
29,138 |
0.8 |
|
(152) |
— |
|
6,472 |
0.2 |
||||
Other expense—net |
2,778 |
0.1 |
— |
— |
— |
— |
|||||||
Total other expenses |
|
96,863 |
2.6 |
|
89,557 |
3.2 |
|
93,649 |
3.5 |
||||
Income before income taxes |
|
830,318 |
22.1 |
|
377,301 |
13.2 |
|
269,182 |
10.2 |
||||
Income tax expense |
|
133,558 |
3.6 |
|
104,598 |
3.6 |
|
48,807 |
1.9 |
||||
Income before equity method investments |
696,760 |
18.5 |
272,703 |
9.6 |
220,375 |
8.3 |
|||||||
Share of equity method investments losses |
(8,214) |
(0.2) |
(888) |
(0.1) |
— |
— |
|||||||
Net income |
$ |
688,546 |
18.3 |
% |
$ |
271,815 |
9.5 |
% |
$ |
220,375 |
8.3 |
% |
|
Non-GAAP Financial Measures
To supplement our consolidated financial statements, which are prepared and presented in accordance with generally accepted accounting principles (“GAAP”), we use non-GAAP financial measures, including adjusted operating income, adjusted net income, EBITDA, adjusted EBITDA, and adjusted capital expenditures (collectively, our “non-GAAP financial measures”). We compute these measures by adjusting the applicable GAAP measures to remove the impact of certain recurring and non-recurring charges and gains and the tax effect of these adjustments. The presentation of this financial information is not intended to be considered in isolation or as a substitute for, or superior to, the financial information prepared and presented in accordance with GAAP. We use these non-GAAP financial measures for financial and operational decision making and as a means to evaluate period-to-period comparisons. We believe that they provide useful information about operating results, enhance the overall understanding of past financial performance and future prospects, and allow for greater transparency with respect to key metrics used by senior leadership in its financial and operational decision making. The non-GAAP financial measures used by us in this Annual Report on Form 10-K may be different from the non-GAAP financial measures, including similarly titled measures, used by other companies.
For more information on the non-GAAP financial measures, please see the reconciliation of GAAP to non-GAAP financial measures tables outlined below. These accompanying tables include details on the GAAP financial measures that are most directly comparable to non-GAAP financial measures and the related reconciliations between these financial measures.
Adjusted Operating Income. Adjusted operating income is a supplemental measure of financial performance that is not required by, or presented in accordance with, GAAP. We define adjusted operating income as consolidated operating income, adjusted for the impact of certain non-recurring and other items that we do not consider representative of our underlying operating performance.
PART II |
FORM 10-K | 47 |
Reconciliation of GAAP Net Income to Operating Income and Adjusted Operating Income
YEAR ENDED |
|||||||||
|
JANUARY 29, |
|
JANUARY 30, |
|
FEBRUARY 1, |
||||
2022 |
2021 |
2020 |
|||||||
(in thousands) |
|||||||||
Net income |
$ |
688,546 |
$ |
271,815 |
$ |
220,375 |
|||
Income tax expense (1) |
|
133,558 |
|
104,598 |
|
48,807 |
|||
(Gain) loss on extinguishment of debt (1) |
|
29,138 |
|
(152) |
|
6,472 |
|||
Interest expense—net (1) |
|
64,947 |
|
69,250 |
|
87,177 |
|||
Share of equity method investments losses (1) |
8,214 |
888 |
— |
||||||
Other expense—net (1) |
2,778 |
|
— |
|
— |
||||
Tradename impairment (1) |
|
— |
|
20,459 |
|
— |
|||
Operating income |
|
927,181 |
|
466,858 |
|
362,831 |
|||
Non-cash compensation (2) |
23,428 |
117,084 |
— |
||||||
Asset impairments and change in useful lives (3) |
|
9,630 |
|
12,851 |
|
21,899 |
|||
Recall accrual (4) |
|
1,940 |
|
7,370 |
|
(3,988) |
|||
Reorganization related costs (5) |
|
449 |
|
7,027 |
|
1,075 |
|||
(Gain) loss on sale leaseback transaction (6) |
|
— |
|
9,352 |
|
(1,196) |
|||
Legal settlements (7) |
|
— |
|
— |
|
(1,193) |
|||
Gain on sale of building and land (8) |
|
— |
|
— |
|
(333) |
|||
Adjusted operating income |
$ |
962,628 |
$ |
620,542 |
$ |
379,095 |
|||
| (1) | Refer to discussion “Fiscal 2021 Compared to Fiscal 2020” below for a discussion of our results of operations for the year ended January 29, 2022 and January 30, 2021. Information on the year ended February 1, 2020 (fiscal 2019) is included in Item 7—Management’s Discussion and Analysis of Financial Condition and Results of Operations on our Form 10-K for the fiscal year ended January 30, 2021, filed with the SEC on March 30, 2021. |
| (2) | The adjustment in fiscal 2021 represents the amortization of the non-cash compensation charge related to an option grant made to Mr. Friedman in October 2020. The adjustment in fiscal 2020 represents the non-cash compensation charge upon grant date related to an option grant made to Mr. Friedman in October 2020 and amortization in the fourth quarter of fiscal 2020. |
| (3) | The adjustment in fiscal 2021 represents asset impairments of $9.6 million. The adjustments in fiscal 2020 include asset impairments of $6.6 million, acceleration of depreciation expense of $3.9 million due to a change in the estimated useful lives of certain assets and asset impairment of $2.4 million related to Outlet inventory resulting from retail closures in response to the COVID-19 pandemic. The adjustment in fiscal 2019 includes (i) asset impairments of $9.1 million, (ii) acceleration of depreciation expense of $6.2 million due to a change in the estimated useful lives of certain assets and a $0.5 million charge related to the termination of a service agreement associated with such assets, (iii) an RH Contemporary Art lease impairment of $4.6 million, resulting from an update to both the timing and the amount of future estimated lease related cash inflows, and (iv) other lease impairments of $1.5 million due to early exit of leased facilities. |
| (4) | Represents adjustments to net revenues, cost of goods sold and inventory charges associated with product recalls, as well as accrual adjustments, and vendor and insurance claims. In fiscal 2021, the recall adjustments increased net revenues by $1.2 million and increased selling, general and administrative expenses by $3.1 million. In fiscal 2020, the recall adjustments decreased net revenues by $1.4 million, increased cost of goods sold by $4.6 million and increased selling, general and administrative expenses by $1.4 million. In fiscal 2019, the recall adjustments increased net revenues by $0.4 million, decreased cost of goods sold by $3.4 million and decreased selling, general and administrative expenses by $0.2 million. |
| (5) | Represents severance costs and related payroll taxes associated with reorganizations. |
| (6) | The adjustment in fiscal 2020 represents the loss on a sale-leaseback transaction related to one of our previously owned Design Galleries. The adjustment in fiscal 2019 represents the gain on a real estate sale related to an asset previously classified as held for sale. |
| (7) | Represents legal settlements, net of related legal expenses. |
| (8) | Represents the gain on the sale of building and land of one of our previously owned retail Galleries, and other land sales. |
48 | FORM 10-K |
PART II |
Adjusted Net Income. Adjusted net income is a supplemental measure of financial performance that are not required by, or presented in accordance with, GAAP. We define adjusted net income as consolidated net income, adjusted for the impact of certain non-recurring and other items that we do not consider representative of our underlying operating performance.
Reconciliation of GAAP Net Income to Adjusted Net Income
|
YEAR ENDED |
|||||||||
JANUARY 29, |
JANUARY 30, |
FEBRUARY 1, |
||||||||
|
|
2022 |
|
2021 |
|
2020 |
||||
|
|
(in thousands) |
||||||||
Net income |
$ |
688,546 |
$ |
271,815 |
$ |
220,375 |
||||
Adjustments pre-tax: |
|
|
|
|
||||||
(Gain) loss on extinguishment of debt (1) |
|
29,138 |
|
(152) |
|
6,472 |
||||
Non-cash compensation (1) |
|
23,428 |
|
117,084 |
|
— |
||||
Amortization of debt discount (2) |
|
18,477 |
|
37,055 |
|
42,545 |
||||
Asset impairments and change in useful lives (1) |
9,630 |
12,851 |
21,899 |
|||||||
Recall accrual (1) |
|
1,940 |
|
7,370 |
|
(3,988) |
||||
Reorganization related costs (1) |
|
449 |
|
7,027 |
|
1,075 |
||||
Tradename impairment (1) |
— |
20,459 |
— |
|||||||
(Gain) loss on sale leaseback transaction (1) |
|
— |
|
9,352 |
|
(1,196) |
||||
Legal settlements (1) |
— |
— |
(1,193) |
|||||||
Gain on sale of building and land (1) |
— |
— |
(333) |
|||||||
Subtotal adjusted items |
|
83,062 |
|
211,046 |
|
65,281 |
||||
Impact of income tax items (3) |
|
(13,317) |
|
(20,845) |
|
(9,359) |
||||
Share of equity method investments losses (1) |
|
8,214 |
|
888 |
|
— |
||||
Adjusted net income |
$ |
766,505 |
$ |
462,904 |
$ |
276,297 |
||||
| (1) | Refer to table titled “Reconciliation of GAAP Net Income to Operating Income and Adjusted Operating Income” and the related footnotes for additional information. |
| (2) | Under GAAP, certain convertible debt instruments that may be settled in cash on conversion are required to be separately accounted for as liability and equity components of the instrument in a manner that reflects the issuer’s non-convertible debt borrowing rate. Accordingly, in accounting for GAAP purposes for the $350 million aggregate principal amount of convertible senior notes that were issued in June 2014 (the “2019 Notes”), the $300 million aggregate principal amount of convertible senior notes that were issued in June and July 2015 (the “2020 Notes”), the $335 million aggregate principal amount of convertible senior notes that were issued in June 2018 (the “2023 Notes”) and the $350 million aggregate principal amount of convertible senior notes that were issued in September 2019 (the “2024 Notes”), we separated the 2019 Notes, 2020 Notes, 2023 Notes and 2024 Notes into liability (debt) and equity (conversion option) components and we are amortizing as debt discount an amount equal to the fair value of the equity components as interest expense on the 2019 Notes, 2020 Notes, 2023 Notes and 2024 Notes over their expected lives. The equity components represent the difference between the proceeds from the issuance of the 2019 Notes, 2020 Notes, 2023 Notes and 2024 Notes and the fair value of the liability components of the 2019 Notes, 2020 Notes, 2023 Notes and 2024 Notes, respectively. Amounts are presented net of interest capitalized for capital projects of $10 million, $5.3 million and $3.7 million during fiscal 2021, fiscal 2020 and fiscal 2019, respectively. The 2019 Notes matured on June 15, 2019 and the 2020 Notes matured on July 15, 2020 and neither impacted amortization of debt discount post-maturity. |
| (3) | The adjustment for fiscal 2021 is based on an adjusted tax rate of 16.1%, which excludes the tax impact associated with our share of equity method investments losses. The adjustment in fiscal 2020 is based on an adjusted tax rate of 21.3%, which excludes the tax impact associated with the non-cash compensation charge related to an option grant made to Mr. Friedman in the third quarter of fiscal 2020, the Waterworks reporting unit tradename impairment recorded in the first quarter of fiscal 2020 and our share of equity method investments losses. The adjustment in fiscal 2019 is based on an adjusted tax rate of 17.4%, which is calculated using a 21% normalized tax rate for the first and second quarters and the effective tax rates of 13.7% and 14.9% for the third and fourth quarters, respectively. |
PART II |
FORM 10-K | 49 |
EBITDA and Adjusted EBITDA. EBITDA and Adjusted EBITDA are supplemental measures of financial performance that are not required by, or presented in accordance with, GAAP. We define EBITDA as consolidated net income before depreciation and amortization, interest expense—net and income tax expense. Adjusted EBITDA reflects further adjustments to EBITDA to eliminate the impact of non-cash compensation, as well as certain non-recurring and other items that we do not consider representative of our underlying operating performance.
Reconciliation of GAAP Net Income to EBITDA and Adjusted EBITDA
|
YEAR ENDED |
||||||||
|
JANUARY 29, |
JANUARY 30, |
FEBRUARY 1, |
||||||
|
|
2022 |
|
2021 |
|
2020 |
|||
|
|
(in thousands) |
|||||||
Net income |
$ |
688,546 |
$ |
271,815 |
$ |
220,375 |
|||
Depreciation and amortization |
|
96,022 |
|
100,040 |
|
100,739 |
|||
Interest expense—net |
|
64,947 |
|
69,250 |
|
87,177 |
|||
Income tax expense |
|
133,558 |
|
104,598 |
|
48,807 |
|||
EBITDA |
|
983,073 |
|
545,703 |
|
457,098 |
|||
Non-cash compensation (1) |
|
48,478 |
|
145,704 |
21,832 |
||||
(Gain) loss on extinguishment of debt (2) |
29,138 |
(152) |
6,472 |
||||||
Asset impairments (2) |
|
9,630 |
|
8,835 |
15,651 |
||||
Share of equity method investments losses (2) |
8,214 |
888 |
— |
||||||
Capitalized cloud computing amortization (3) |
3,565 |
462 |
— |
||||||
Other expense—net (2) |
2,778 |
— |
— |
||||||
Recall accrual (2) |
|
1,940 |
|
7,370 |
(3,988) |
||||
Reorganization related costs (2) |
449 |
7,027 |
1,075 |
||||||
(Gain) loss on sale leaseback transaction (2) |
— |
9,352 |
(1,196) |
||||||
Tradename impairment (2) |
— |
20,459 |
— |
||||||
Legal settlements (2) |
— |
— |
(1,193) |
||||||
Gain on sale of building and land (2) |
— |
— |
(333) |
||||||
Adjusted EBITDA |
$ |
1,087,265 |
$ |
745,648 |
$ |
495,418 |
|||
| (1) | Represents non-cash compensation related to equity awards granted to employees, including non-cash compensation charges related to an option grant made to Mr. Friedman in October 2020. |
| (2) | Refer to table titled “Reconciliation of GAAP Net Income to Operating Income and Adjusted Operating Income” and the related footnotes for additional information. |
| (3) | Represents amortization associated with capitalized cloud computing costs. |
50 | FORM 10-K |
PART II |
Adjusted Capital Expenditures. We define adjusted capital expenditures as capital expenditures from investing activities and cash outflows of capital related to construction activities to design and build landlord-owned leased assets, net of tenant allowances received.
Reconciliation of Adjusted Capital Expenditures
YEAR ENDED |
|||||||||
JANUARY 29, |
|
JANUARY 30, |
|
FEBRUARY 1, |
|||||
2022 |
|
2021 |
|
2020 |
|||||
|
|
(in thousands) |
|||||||
Capital expenditures |
$ |
185,383 |
$ |
111,126 |
$ |
93,623 |
|||
Landlord assets under construction—net of tenant allowances |
68,454 |
69,508 |
64,300 |
||||||
Adjusted capital expenditures |
$ |
253,837 |
$ |
180,634 |
$ |
157,923 |
|||
Fiscal 2021 Compared to Fiscal 2020
|
YEAR ENDED |
|||||||||||||||||
|
JANUARY 29, |
JANUARY 30, |
||||||||||||||||
|
2022 |
2021 |
||||||||||||||||
|
RH SEGMENT |
|
WATERWORKS |
|
TOTAL |
|
RH SEGMENT |
|
WATERWORKS |
|
TOTAL |
|||||||
|
(in thousands) |
|||||||||||||||||
Net revenues |
$ |
3,593,842 |
$ |
164,978 |
$ |
3,758,820 |
$ |
2,729,422 |
$ |
119,204 |
$ |
2,848,626 |
||||||
Cost of goods sold |
|
1,821,174 |
|
82,235 |
|
1,903,409 |
|
1,455,274 |
|
67,821 |
|
1,523,095 |
||||||
Gross profit |
1,772,668 |
82,743 |
1,855,411 |
1,274,148 |
|
51,383 |
|
1,325,531 |
||||||||||
Selling, general and administrative expenses |
|
861,794 |
|
66,436 |
|
928,230 |
|
808,383 |
|
50,290 |
|
858,673 |
||||||
Income from operations |
$ |
910,874 |
$ |
16,307 |
$ |
927,181 |
$ |
465,765 |
$ |
1,093 |
$ |
466,858 |
||||||
Net revenues
Consolidated net revenues increased $910 million, or 32.0%, to $3.8 billion in fiscal 2021 compared to $2.8 billion in fiscal 2020.
RH Segment net revenues for fiscal 2021 were favorably impacted by $1.2 million and for fiscal 2020 were negatively impacted by $1.4 million, in each case related to product recalls. Excluding the product recall adjustments, consolidated net revenues increased $908 million, or 31.8%, to $3.8 billion in fiscal 2021 compared to $2.8 billion in fiscal 2020. Product recalls and the establishment or adjustment of any related recall accruals can affect our results and cause quarterly fluctuations affecting the period-to-period comparisons of our results. No assurance can be provided that any accruals will be for the appropriate amount, and actual losses could be higher or lower than what we accrue from time to time, which could further affect results.
RH Segment net revenues
RH Segment net revenues increased $864 million, or 31.7%, to $3.6 billion in fiscal 2021 compared to $2.7 billion in the fiscal 2020. The below discussion highlights several significant factors that resulted in an increase in RH Segment net revenues, which are listed in order of magnitude.
RH Segment net revenues in fiscal 2021 increased due to strong customer demand for our products, aided by elements of our supply chain continuing to catch up with customer demand. RH Segment net revenues in fiscal 2020 were negatively impacted by Gallery closures and macroeconomic conditions resulting from the COVID-19 pandemic, whereby our revenue growth lagged customer demand primarily due to the effects of higher than anticipated demand and disruptions across our global supply chain as a result of COVID-19. RH Segment net revenues in both fiscal 2021 and fiscal 2020 were impacted by product recalls as noted above.
PART II |
FORM 10-K | 51 |
Outlet sales increased $92 million to $279 million in fiscal 2021 compared to $187 million in fiscal 2020. The first half of fiscal 2020 was impacted by pandemic-related retail closures. Additionally, RH Segment net revenues increased in our RH Hospitality business compared to fiscal 2020 due to reduced COVID-19 operational restrictions in fiscal 2021 and new Restaurant openings in fiscal 2021.
Waterworks net revenues
Waterworks net revenues increased $46 million, or 38.4%, to $165 million in fiscal 2021 compared to $119 million in fiscal 2020 due to an increase in demand related to resumed construction activity and significant residential investments by high-end homeowners.
Gross profit
Consolidated gross profit increased $530 million, or 40.0%, to $1.9 billion in fiscal 2021 compared to $1.3 billion in fiscal 2020. As a percentage of net revenues, gross margin increased 290 basis points to 49.4% of net revenues in fiscal 2021 compared to 46.5% of net revenues in fiscal 2020.
RH Segment gross profit for fiscal 2021 was favorably impacted by $1.2 million related to product recalls. RH Segment gross profit for fiscal 2020 was negatively impacted by $5.9 million related to product recalls and includes asset impairments of $2.4 million related to Outlet inventory resulting from retail closures in response to the COVID-19 pandemic.
Excluding the adjustments mentioned above, consolidated gross margin would have increased 250 basis points to 49.3% of net revenues in fiscal 2021 compared to 46.8% of net revenues in fiscal 2020.
RH Segment gross profit
RH Segment gross profit increased $499 million, or 39.1%, to $1.8 billion in fiscal 2021 compared to $1.3 billion in fiscal 2020. As a percentage of net revenues, RH Segment gross margin increased 260 basis points to 49.3% of net revenues in fiscal 2021 compared to 46.7% of net revenues in fiscal 2020.
Excluding the adjustments mentioned above, RH Segment gross margin would have increased 230 basis points to 49.3% of net revenues in fiscal 2021 from 47.0% of net revenues in fiscal 2020. The increase in gross margin was primarily driven by higher product margins in the Core and Outlet businesses and leverage in our RH Segment shipping and occupancy costs in fiscal 2021.
Waterworks gross profit
Waterworks gross profit increased $31 million, or 61.0%, to $83 million in fiscal 2021 compared to $51 million in fiscal 2020. As a percentage of net revenues, Waterworks gross margin increased 710 basis points to 50.2% of net revenues in fiscal 2021 compared to 43.1% of net revenues in fiscal 2020 primarily driven by higher revenues, favorable changes in product mix, and leverage in Waterworks occupancy costs, offset by an increase in shipping costs related to customer deliveries.
Selling, general and administrative expenses
Consolidated selling, general and administrative expenses increased $70 million, or 8.1%, to $928 million in fiscal 2021 compared to $859 million in fiscal 2020.
RH Segment selling, general and administrative expenses
RH Segment selling, general and administrative expenses increased $53 million, or 6.6%, to $862 million in fiscal 2021 compared to $808 million in fiscal 2020.
RH Segment selling, general and administrative expenses for fiscal 2021 included amortization of non-cash compensation of $24 million related to a fully vested option grant made to Mr. Friedman in October 2020, $9.6 million related to asset impairments, $1.7 million related to product recalls and $0.4 million related to severance costs and related payroll taxes associated with reorganizations.
RH Segment selling, general and administrative expenses for fiscal 2020 includes non-cash compensation of $117 million related to an option grant made to Mr. Friedman in October 2020, loss of $9.4 million related to a sale leaseback transaction, $7.0 million related to severance costs and related payroll taxes associated with the termination of associates and a reorganization undertaken in response to the impact of retail closures on our business, $5.0 million related to asset impairments and $3.9 million due to accelerated asset depreciation.
52 | FORM 10-K |
PART II |
Excluding the adjustments mentioned above, RH Segment selling, general and administrative expenses would have been 23.0% and 24.4% of net revenues for fiscal 2021 and fiscal 2020, respectively. The decrease in selling, general and administrative expenses as a percentage of net revenues was primarily driven by reduction in costs and leverage in advertising costs due to our decision to not mail the Spring 2021 Source Books, leverage in employment and employment-related costs, as well as leverage in our corporate occupancy expenses, partially offset by increased travel-related costs.
Waterworks selling, general and administrative expenses
Waterworks selling, general and administrative expenses increased $16 million, or 32.1%, to $66 million in fiscal 2021 compared to $50 million in fiscal 2020.
Waterworks selling, general and administrative expenses for fiscal 2021 included $1.4 million related to product recalls and for fiscal 2020 included $1.6 million related to asset impairments and $1.3 million related to product recalls.
Excluding the adjustments mentioned above, Waterworks selling, general and administrative expenses would have decreased 30 basis points to 39.4% of net revenues in fiscal 2021 compared to 39.7% of net revenues in fiscal 2020.
Interest expense—net
Interest expense—net decreased $4.3 million in fiscal 2021 compared in fiscal 2020, which consisted of the following in each fiscal year:
|
YEAR ENDED |
|||||
|
JANUARY 29, |
JANUARY 30, |
||||
|
|
2022 |
|
2021 |
||
|
(in thousands) |
|||||
Amortization of convertible senior notes debt discount |
$ |
28,816 |
$ |
42,372 |
||
Finance lease interest expense |
|
26,412 |
|
24,011 |
||
Term loan interest expense |
|
17,938 |
|
— |
||
Amortization of debt issuance costs and deferred financing fees |
|
2,753 |
|
3,436 |
||
Other interest expense |
|
1,905 |
|
1,776 |
||
Promissory notes |
1,267 |
4,283 |
||||
Asset based credit facility |
|
— |
|
344 |
||
Capitalized interest for capital projects |
|
(12,208) |
|
(5,574) |
||
Interest income |
|
(1,936) |
|
(1,398) |
||
Total interest expense—net |
$ |
64,947 |
$ |
69,250 |
||
Tradename impairment
We incurred a $20 million tradename impairment charge in fiscal 2020 for our Waterworks reporting unit. We did not recognize any tradename impairment in fiscal 2021. Refer to “Impairment” within Note 3— Significant Accounting Policies in our consolidated financial statements within Part II of this Annual Report on Form 10-K.
(Gain) loss on extinguishment of debt—net
During fiscal 2021 we recognized a loss on extinguishment of debt for a portion of the 2023 Notes and 2024 Notes that were early converted at the option of the noteholders of $29 million. We recognized a $0.2 million gain on extinguishment of debt in fiscal 2020 related to the maturity and settlement of the 2020 Notes in July 2020.
Other expense—net
Other expense—net was $2.8 million in fiscal 2021 due to unfavorable exchange rate changes affecting foreign currency denominated transactions, primarily between the U.S. dollar as compared to Pound Sterling and Euro, in addition to a foreign exchange loss from the remeasurement of an intercompany loan with a U.K. subsidiary.
PART II |
FORM 10-K | 53 |
Income tax expense
Income tax expense was $134 million in fiscal 2021 compared to $105 million in fiscal 2020. Our effective tax rate was 16.2% in fiscal 2021 compared to 27.8% in fiscal 2020. The decrease in our effective tax rate is due primarily to higher net excess tax benefits from stock-based compensation of $79 million in fiscal 2021 as compared to $22 million in fiscal 2020 resulting from increased option exercise activity and appreciation of our stock price. Fiscal 2020 was also impacted by non-deductible stock-based compensation related to an option grant made to Mr. Friedman in October 2020, which resulted in income tax expense of $29 million.
Equity method investments losses
Equity method investments losses consists of our proportionate share of the losses of our equity method investments by applying the hypothetical liquidation at book value methodology, which resulted in a $8.2 million loss in fiscal 2021 compared to a $0.9 million loss in fiscal 2020.
Liquidity and Capital Resources
Overview
Our principal sources of liquidity are cash flows generated from operations, our current balances of cash and cash equivalents, and amounts available under our ABL Credit Agreement. In fiscal 2021, we entered into the ABL Credit Agreement, which amended and extended our asset based credit facility, and issued the Term Loan in the amount of $2.0 billion pursuant to the Term Loan Credit Agreement. The issuance of the Term Loan was assigned a Ba2 rating from Moody’s Investors Service and BB rating from S&P Global. Refer to Note 13—Credit Facilities in our consolidated financial statements.
A summary of our net debt, and availability under the ABL Credit Agreement, is set forth in the following table:
YEAR ENDED |
||||||
JANUARY 29, |
JANUARY 30, |
|||||
2022 |
2021 |
|||||
(in millions) |
||||||
Asset based credit facility |
$ |
— |
$ |
— |
||
Term loan (1) |
1,995 |
— |
||||
Equipment promissory notes (1) |
15 |
38 |
||||
Convertible senior notes due 2023 (1) |
69 |
288 |
||||
Convertible senior notes due 2024 (1) |
189 |
284 |
||||
Notes payable for share repurchases |
1 |
1 |
||||
Total debt |
$ |
2,269 |
$ |
611 |
||
Cash and cash equivalents |
(2,178) |
(100) |
||||
Total net debt |
$ |
91 |
$ |
511 |
||
Availability under the asset based credit facility—net (2) |
$ |
347 |
$ |
272 |
||
| (1) | Amounts exclude discounts upon original issuance and third party offering and debt issuance costs. |
| (2) | As of January 29, 2022 and January 30, 2021, the amount available for borrowing under the revolving line of credit under the ABL Credit Agreement is presented net of $20 million and $15 million in outstanding letters of credit, respectively. |
54 | FORM 10-K |
PART II |
General
The primary cash needs of our business have historically been for merchandise inventories, payroll, Source Books, rent for our retail and outlet locations, capital expenditures associated with opening new locations and updating existing locations, as well as the development of our infrastructure and information technology. We seek out and evaluate opportunities for effectively managing and deploying capital in ways that improve working capital and support and enhance our business initiatives and strategies. We continuously evaluate our capital allocation strategy and may engage in future investments in connection with existing or new share repurchase programs (refer to “Share Repurchase Programs” below), which may include investments in derivatives or other equity linked instruments. We have in the past been, and continue to be, opportunistic in responding to favorable market conditions regarding both sources and uses of capital. Capital raised from debt financings has enabled us to pursue various investments. Financing that we arrange through the sale of equity linked instruments, such as our convertible notes financings, may lead to substantial dilution to our investors if the price of our common stock continues to exceed the upper strike exercise price of the warrants in connection with our bond hedge transactions. We expect to continue to take an opportunistic approach regarding both sources and uses of capital in connection with our business.
Credit Facilities and Debt Arrangements
We amended and restated our asset based credit facility in July 2021, which has an initial availability of up to $600 million, of which $10 million is available to Restoration Hardware Canada, Inc., and includes a $300 million accordion feature under which the revolving line of credit may be expanded by agreement of the parties from $600 million to up to $900 million if and to the extent the lenders revise their credit commitments to encompass a larger facility. The ABL Credit Agreement provides that the $300 million accordion, or a portion thereof, may be added as a first-in, last-out term loan facility if and to the extent the lenders revise their credit commitments for such facility. The ABL Credit Agreement further provides the borrowers may request a European sub-credit facility under the revolving line of credit or under the accordion feature for borrowing by certain European subsidiaries of RH if certain conditions set out in the asset based credit facility are met. The maturity date of the asset based credit facility is July 29, 2026.
We entered into a term loan credit agreement in October 2021. The Term Loan Credit Agreement provides for a Term Loan in an aggregate principal amount of $2.0 billion and the maturity date of the Term Loan Credit Agreement is October 20, 2028. As of January 29, 2022, we have $1,995 million outstanding under the Term Loan Credit Agreement, and we are required to make quarterly principal payments of $5.0 million.
We had $294 million remaining in aggregate principal amount of convertible notes outstanding as of January 29, 2022, comprised of $74 million of 2023 Notes and $220 million of 2024 Notes. Due to early conversions at the option of the noteholders, $9.4 million of the 2023 Notes and $3.6 million of the 2024 Notes were recorded within current liabilities on our consolidated financial statements as of January 29, 2022. Absent further early conversion elections, the remaining 2023 Notes have a scheduled maturity in June 2023 and the remaining 2024 Notes have a scheduled maturity in September 2024. We anticipate having ample cash available in order to repay the principal amount of our convertible notes in cash with respect to any convertible notes for which the holders elect early conversion, as well as upon maturity in June 2023 and September 2024, in each case in order to minimize dilution. Based upon the strength in our common stock price, we expect that holders of the convertible notes may continue to elect early conversion of such notes in advance of the scheduled maturity dates. While we purchased convertible note hedges and sold warrants with respect to each convertible note transaction, which are intended to offset any actual earnings dilution from the conversion of the 2024 Notes until our common stock is above approximately $338.24 per share and from the conversion of the 2023 Notes until our common stock is above approximately $309.84 per share, our shareholders may still experience dilution to the extent our common stock trades above such levels at the time of the maturity of the warrants with respect to the bond hedge and warrant transactions.
We believe our capital structure provides us with substantial optionality regarding our capital allocation. We continue to closely manage our business and our investments while considering both the overall economic environment as well as the needs of our operations. In addition, our near-term decisions regarding the sources and uses of capital will continue to reflect and adapt to changes in market conditions and our business, including further developments with respect to the pandemic. We believe our existing cash balances and operating cash flows, in conjunction with available financing arrangements, will be sufficient to repay our debt obligations as they become due, meet working capital requirements and fulfill other capital needs for more than the next 12 months.
PART II |
FORM 10-K | 55 |
While we do not require additional debt to fund our operations, our goal continues to be in a position to take advantage of the many opportunities that we identify in connection with our business and operations. We have pursued in the past, and may pursue in the future, additional strategies to generate capital to pursue opportunities and investments, including through the strategic sale of existing assets, utilization of our credit facilities, entry into various credit agreements and other new debt financing arrangements that present attractive terms. We expect to continue to use additional sources of debt financing in future periods as a source of additional capital to fund our various investments. In addition to funding the normal operations of our business, we have used our liquidity to fund significant investments and strategies such as our share repurchase programs, various acquisitions, and growth initiatives, including through joint ventures and real estate investments.
To the extent we choose to secure additional sources of liquidity through incremental debt financing, there can be no assurances that we will be able to raise such financing on favorable terms, if at all, or that future financing requirements will not require us to raise money through an equity financing or by other means that could be dilutive to holders of our capital stock. Any adverse developments in the U.S. or global credit markets as a result of the pandemic or any other reason could affect our ability to manage our debt obligations and our ability to access future debt. In addition, agreements governing existing or new debt facilities may restrict our ability to operate our business in the manner we currently expect or to make required payments with respect to existing commitments including the repayment of the principal amount of our convertible senior notes in cash, whether upon stated maturity, early conversion or otherwise of such senior notes. To the extent we need to seek waivers from any provider of debt financing, or we fail to observe the covenants or other requirements of existing or new debt facilities, any such event could have an impact on our other commitments and obligations including triggering cross defaults or other consequences with respect to other indebtedness. Our current level of indebtedness, and any additional indebtedness that we may incur, exposes us to certain risks with regards to interest rate increases and fluctuations. Our ability to make interest payments or to refinance any of our indebtedness to manage such interest rates may be limited or negatively affected by credit market conditions, macroeconomic trends and other risks.
Capital
We have invested significant capital expenditures in developing and opening new Design Galleries, and these capital expenditures have increased in the past, and may continue to increase in future periods, as we open additional Design Galleries, which may require us to undertake upgrades to historical buildings or construction of new buildings. Our adjusted capital expenditures include capital expenditures from investing activities and cash outflows of capital related to construction activities to design and build landlord-owned leased assets, net of tenant allowances received. During fiscal 2021, adjusted capital expenditures were $254 million, net of cash received related to landlord tenant allowances of $22 million. We anticipate our adjusted capital expenditures to be $200 million to $250 million in fiscal 2022, primarily related to our growth and expansion, including construction of new Design Galleries and infrastructure investments. Nevertheless, we may elect to pursue additional capital expenditures beyond those that are anticipated during any given fiscal period inasmuch as our strategy is to be opportunistic with respect to our investments and we may choose to pursue certain capital transactions based on the availability and timing of unique opportunities. Given the pace at which business conditions are evolving in response to the COVID-19 health crisis, we may adjust our investments in various business initiatives, including our capital expenditures, during fiscal 2022 and beyond.
Certain lease arrangements require the landlord to fund a portion of the construction related costs through payments directly to us. As we develop new Galleries, as well as other potential strategic initiatives in the future like our integrated hospitality experience, we may explore other models for our real estate, which could include longer lease terms or further purchases of, or joint ventures or other forms of equity ownership in, real estate interests associated with new sites and buildings. These approaches might require different levels of capital investment on our part than a traditional store lease with a landlord. We also believe there is an opportunity to transition some portion of our real estate strategy from a leasing model to a development model, where we potentially buy and develop our Design Galleries with the objective of (i) recouping a majority of the investment through a sale-leaseback arrangement and (ii) resulting in lower capital investment and lower rent. For example, in fiscal 2019 we executed a sale-leaseback transaction for the Yountville Design Gallery for sales proceeds of $24 million and in fiscal 2020 we executed a sale-leaseback transaction for the Minneapolis Design Gallery for sales proceeds of $26 million, both of which qualified for sale-leaseback accounting. In the event that such capital and other expenditures require us to pursue additional funding sources, we can provide no assurance that we will be successful in securing additional funding on attractive terms or at all. In addition, our capital needs and uses of capital may change in the future due to changes in our business or new opportunities that we may pursue.
56 | FORM 10-K |
PART II |
In addition, we continue to address the effects of the COVID-19 pandemic on our business with respect to real estate development and the introduction of new Galleries in both the U.S. and internationally. A range of factors involved in the development of new Galleries and RH Hospitality may continue to be affected by the pandemic, including delays in construction as well as permitting and other necessary governmental actions. In addition, the scope and cadence of investments by third parties, including landlords and other real estate counterparties, may be adversely affected by the health crisis. Actions taken by international as well as federal, state and local government authorities, and in some instances mall and shopping center owners, in response to the pandemic, may require changes to our real estate strategy and related capital expenditure and financing plans. In addition, we may continue to be required to make lease payments in whole or in part for our Galleries, Outlets and Restaurants that were temporarily closed or are required to close in the future in the event of resurgences in COVID-19 outbreaks or for other reasons. Any efforts to mitigate the costs of construction delays and deferrals, retail closures and other operational difficulties, including any such difficulties resulting from the pandemic, such as by negotiating with landlords and other third parties regarding the timing and amount of payments under existing contractual arrangements, may not be successful, and as a result, our real estate strategy may have ongoing significant liquidity needs even as we make changes to our planned operations and expansion cadence.
Cash Flow Analysis
A summary of operating, investing, and financing activities is set forth in the following table:
|
YEAR ENDED |
||||||||
|
JANUARY 29, |
JANUARY 30, |
FEBRUARY 1, |
||||||
|
|
2022 |
|
2021 |
|
2020 |
|||
|
(in thousands) |
||||||||
Net cash provided by operating activities |
$ |
662,114 |
$ |
500,770 |
$ |
339,188 |
|||
Net cash used in investing activities |
|
(194,353) |
|
(197,600) |
|
(122,545) |
|||
Net cash provided by (used in) financing activities |
|
1,607,127 |
|
(243,914) |
|
(174,804) |
|||
Net increase in cash and cash equivalents and restricted cash equivalents |
|
2,074,793 |
|
59,413 |
|
41,855 |
|||
Cash and cash equivalents and restricted cash equivalents at end of period |
|
2,181,864 |
|
107,071 |
|
47,658 |
|||
Net Cash Provided By Operating Activities
Operating activities consist primarily of net income adjusted for non-cash items including depreciation and amortization, impairments, stock-based compensation, cash paid attributable to accretion of debt discount upon settlement of debt and the effect of changes in working capital and other activities.
For fiscal 2021, net cash provided by operating activities was $662 million and consisted of net income of $689 million and an increase in non-cash items of $252 million, partially offset by a change in working capital and other activities of $279 million. The source of cash from working capital was primarily driven by an increase in deferred revenue and customer deposits of $107 million primarily due to strong consumer demand for our products. This source of cash from working capital was offset by uses of cash driven by an increase in merchandise inventory of $190 million, a decrease in operating lease liabilities of $77 million due to payments made under the related lease agreements, an increase in landlord assets under construction of $68 million and an increase in prepaid expenses and other assets of $50 million.
Net Cash Used In Investing Activities
Investing activities consist primarily of investments in capital expenditures related to investments in retail stores, information technology and systems infrastructure, as well as supply chain investments. Investing activities also include our strategic investments.
For fiscal 2021, net cash used in investing activities was $194 million and was comprised of investments in retail stores, information technology and systems infrastructure of $185 million and additional funding of our equity method investments of $9.0 million.
PART II |
FORM 10-K | 57 |
Net Cash Provided By (Used In) Financing Activities
Financing activities consist primarily of borrowings and repayments related to convertible senior notes, credit facilities and other financing arrangements, and cash used in connection with such financing activities include investments in share repurchase programs, repayment of indebtedness including principal payments under finance lease agreements and other equity related transactions such as the convertible note bond hedge and warrant transactions in connection with our convertible notes financings.
For fiscal 2021, net cash provided by financing activities was $1.6 billion, primarily due to the issuance of the Term Loan in October 2021 in the amount of $2.0 billion pursuant to the Term Loan Credit Agreement. This source of cash was offset by uses of cash, partially due to the repayment of $391 million of the 2023 Notes and 2024 Notes in fiscal 2021 as a result of early conversion at the option of the noteholders, of which $336 million is presented as repayments of convertible senior notes within cash from financing activities and $55 million is reflected as cash paid attributable to accretion of debt discount upon settlement of debt within cash from operating activities. In addition, we incurred $26 million of debt issuance costs related to the Term Loan Credit Agreement and the ABL Credit Agreement, as well as made repayments of $23 million on our equipment notes, $14 million of principal payments under finance lease agreements and $5.0 million of principal payments under the Term Loan Credit Agreement. Equity related transactions provided $11 million due to $32 million of proceeds from exercise of employee stock options, partially offset by $21 million of cash paid for employee taxes related to net settlement of equity awards.
Non-Cash Transactions
Non-cash transactions consist of non-cash additions of property and equipment and landlord assets and reclassification of assets from landlord assets under construction to finance lease right-of-use assets, as well as promissory notes forgiven in exchange for assets and the conversion of loan receivables into equity method investments. In addition, non-cash transactions consist of shares issued and received related to convertible senior note transactions.
Cash Requirements from Contractual Obligations
Leases
We lease nearly all of our retail and outlet locations, corporate headquarters, distribution centers and home delivery center locations, as well as other storage and office space. Refer to “Leases” within Note 3— Significant Accounting Policies and Note 11—Leases in our consolidated financial statements for further information on our lease arrangements, including the maturities of our operating and finance lease liabilities.
Most lease arrangements provide us with the option to renew the leases at defined terms. The table presenting the maturities of our lease liabilities included in Note 11—Leases includes future obligations for renewal options that are reasonably certain to be exercised and are included in the measurement of the lease liability. Amounts presented therein do not include future lease payments under leases that have not commenced or estimated contingent rent due under operating and finance leases.
Convertible Senior Notes
Refer to Note 12—Convertible Senior Notes in our consolidated financial statements for further information on our 0.00% Convertible Senior Notes due 2024 and 0.00% Convertible Senior Notes due 2023.
Asset Based Credit Facility
Refer to Note 13—Credit Facilities in our consolidated financial statements for further information on our asset based credit facility, including the amount available for borrowing under the revolving line of credit, net of outstanding letters of credit.
Term Loan
Refer to Note 13—Credit Facilities in our consolidated financial statements for further information on our Term Loan.
Equipment Loan Facility
Refer to Note 13—Credit Facilities in our consolidated financial statements for further information on our equipment loan facility.
58 | FORM 10-K |
PART II |
Share Repurchase Programs
We regularly review share repurchase activity and consider various factors in determining whether and when to execute investments in connection with our share repurchase programs, including, among others, current cash needs, capacity for leverage, cost of borrowings, results of operations and the market price of our common stock. We believe that share repurchase programs will continue to be an excellent allocation of capital for the long-term benefit of our shareholders. We may undertake other repurchase programs in the future with respect to our securities.
$950 Million Share Repurchase Program
In 2018, our Board of Directors authorized the 950 Million Repurchase Program through open market purchases, privately negotiated transactions or other means, including through Rule 10b-18 open market repurchases, Rule 10b5-1 trading plans or through the use of other techniques such as the acquisition of other equity linked instruments, accelerated share repurchases including through privately-negotiated arrangements in which a portion of the 950 Million Repurchase Program is committed in advance through a financial intermediary and/or in transactions involving hedging or derivatives. We completed $250 million in share repurchases in fiscal 2018 under the 950 Million Repurchase Program. In the first quarter of fiscal 2019, we repurchased approximately 2.2 million shares of our common stock at an average price of $115.36 per share, for an aggregate repurchase amount of approximately $250 million under the 950 Million Repurchase Program. We did not make any repurchases under the 950 Million Repurchase Program during either fiscal 2021 or fiscal 2020. The total current authorized size of this share repurchase program is up to $950 million, of which $450 million remained available as of January 29, 2022 for future share investments.
Other Commitments
We enter into various commitments related to the procurement of merchandise inventory. As of January 29, 2022, these merchandise inventory purchase commitments were $756 million.
We are not able to reasonably estimate when cash payments for the unrecognized tax benefits associated with uncertain tax positions of $3.5 million as of January 29, 2022 will occur or the amount by which the liability for uncertain tax positions will increase or decrease over time. Refer to Note 15—Income Taxes in our consolidated financial statements for further information on our uncertain tax positions.
Critical Accounting Policies and Estimates
The preparation of financial statements in accordance with accounting principles generally accepted in the United States requires our senior leadership to make estimates and assumptions that affect amounts reported in our consolidated financial statements and related notes, as well as the related disclosure of contingent assets and liabilities at the date of the financial statements and the reported amounts of revenues and expenses during the reporting period. We evaluate our accounting policies, estimates, and judgments on an on-going basis. We base our estimates and judgments on historical experience and various other factors that are believed to be reasonable under the circumstances. Actual results may differ from these estimates under different assumptions and conditions and such differences could be material to the consolidated financial statements.
Information on all of our significant accounting policies can be found in Note 3—Significant Accounting Policies in our audited consolidated financial statements. Our senior leadership team evaluates the development and selection of our critical accounting policies and estimates and believes that certain of our significant accounting policies involve a higher degree of judgment or complexity and are most significant to reporting our consolidated results of operations and financial position, and are therefore discussed as critical. The following critical accounting policies reflect the significant estimates and judgments used in the preparation of our consolidated financial statements.
Merchandise Inventories—Reserves
Our merchandise inventories are comprised of finished goods and are carried at the lower of cost or net realizable value, with cost determined on a weighted-average cost method. To determine if the value of inventory should be marked down below original cost, we use estimates to determine the lower of cost or net realizable value, which considers current and anticipated demand, customer preference and the merchandise age. The inventory value is adjusted periodically to reflect current market conditions, which requires judgments that may significantly affect the ending inventory valuation, as well as gross margin. The estimates used in inventory valuation are lower of cost or net realizable value reserves and obsolescence (including excess and slow-moving inventory).
PART II |
FORM 10-K | 59 |
Our inventory reserves contain uncertainties that require us to make assumptions and to apply judgment regarding a number of factors, including market conditions, the selling environment, historical results and current inventory trends. We adjust our inventory reserves for net realizable value and obsolescence based on trends, aging reports, specific identification and estimates of future retail sales prices. If actual results change from our prior estimates, we adjust our inventory reserves accordingly throughout the period. We have not made any material changes to our assumptions included in the calculations of the lower of cost or net realizable value reserves during the periods presented.
Impairment
Tradenames, Trademarks and Other Intangible Assets
We annually evaluate whether tradenames, trademarks and other intangible assets continue to have an indefinite life. Tradenames, trademarks and other intangible assets are reviewed for impairment annually in the fourth quarter and may be reviewed more frequently if indicators of impairment are present. Conditions that may indicate impairment include, but are not limited to, a significant adverse change in customer demand or business climate that could affect the value of an asset, a product recall or an adverse action or assessment by a regulator.
We qualitatively assess indefinite-lived intangible asset impairment to determine whether it is more likely than not that the fair value of the asset is less than its carrying amount. If tradenames, trademarks and other intangible assets are not qualitatively assessed or if such intangible assets are qualitatively assessed and it is determined it is not more likely than not that the asset’s fair value is greater than its carrying amount, an impairment review is performed by comparing the carrying value to the estimated fair value, determined using a discounted cash flow methodology, which requires us to make judgments that may significantly affect the ending asset valuation. Factors used in the valuation of intangible assets with indefinite lives include, but are not limited to, our plans for future operations, brand initiatives, recent results of operations and projected future cash flows.
In the event we quantitatively assess a reporting unit’s indefinite-lived intangible asset for impairment, we perform an impairment test which utilizes the discounted cash flow methodology under the relief-from-royalty method. Under the relief-from-royalty method, our significant assumptions include the forecasted future revenues and the estimated royalty rate, expressed as a percentage of revenues.
Long-Lived Assets
Long-lived assets, such as property and equipment and lease right-of-use assets, are reviewed for impairment whenever events or changes in circumstances indicate that the carrying amount of an asset may not be recoverable. Conditions that may indicate impairment include, but are not limited to, a significant adverse change in customer demand or business climate that could affect the value of an asset, change in the intended use of an asset, a product recall or an adverse action or assessment by a regulator. If the sum of the estimated undiscounted future cash flows over the remaining life of the primary asset is less than the carrying value, we recognize a loss equal to the difference between the carrying value and the fair value, usually determined by the estimated discounted cash flow analysis of the asset or asset group. The asset group is defined as the lowest level for which identifiable cash flows are available and largely independent of the cash flows of other groups of assets, which for our stores is the individual Gallery level.
Since there is typically no active market for our long-lived assets, we estimate fair values based on the expected future cash flows of the asset or asset group, using a discount rate commensurate with the related risk. The estimate of fair value requires judgments that may significantly affect the ending asset valuation. Future cash flows are estimated based on Gallery-level historical results, current trends, and operating and cash flow projections. Our estimates are subject to uncertainty and may be affected by a number of factors outside our control, including general economic conditions and the competitive environment. While we believe our estimates and judgments about future cash flows are reasonable, future impairment charges may be required if the expected cash flow estimates, as projected, do not occur or if events change requiring us to revise our estimates.
60 | FORM 10-K |
PART II |
Lease Accounting
Reasonably Certain Lease Term
In recognizing the lease right-of-use assets and lease liabilities, we utilize the lease term for which we are reasonably certain to use the underlying asset, including consideration of options to extend or terminate the lease. At lease commencement, we evaluate whether we are reasonably certain to exercise available options based on consideration of a variety of economic factors and the circumstances related to the leased asset. Factors considered include, but are not limited to, (i) the contractual terms compared to estimated market rates, (ii) the uniqueness or importance of the asset or its location, (iii) the potential costs of obtaining an alternative asset, (iv) the potential costs of relocating or ceasing use of the asset, including the consideration of leasehold improvements and other invested capital, and (v) any potential tax consequences.
The determination of the reasonably certain lease term affects the inclusion of rental payments utilized in the incremental borrowing rate calculations, the results of the lease classification test, and our consideration of certain assets held for sale or planned for sale-leaseback. The reasonably certain lease term may materially impact our financial position related to certain Design Galleries or distribution center facilities which typically have greater lease payments. Although the above factors are considered in our analysis, the assessment involves subjectivity considering our strategy, expected future events and market conditions. While we believe our estimates and judgments in determining the lease term are reasonable, future events may occur which may require us to reassess this determination.
Incremental Borrowing Rate
As most of our leases do not include an implicit interest rate, we determine the discount rate for each lease based upon the incremental borrowing rate (“IBR”) in order to calculate the present value of the lease liability at the commencement date. The IBR is computed as the rate of interest that we would have to pay to borrow on a collateralized basis over a similar term an amount equal to the total lease payments in a similar economic environment. We utilize our outstanding debt facilities, including our asset based credit facility or our Term Loan Credit Agreement issued in October 2021, as the basis for determining the applicable IBR for each lease. We estimate the incremental borrowing rate for each lease primarily by reference to yield rates on debt issuances by companies of a similar credit rating, the weighted-average lease term and adjustments for differences between the yield rates and the actual term of the credit facility. In determining the yield rates, for Design Galleries we utilize market information on the lease commencement date and for leases other than new Design Galleries, we utilize market information as of the beginning of the quarter in which the lease commenced.
Fair Value
We determine the fair value of the underlying asset, and the lease components such as land and building, for purposes of determining the lease classification and allocating our contractual rental payments to the lease components. The fair value of the underlying asset and lease components also impact our assets held for sale and sale-leaseback transactions. The fair value assessments may materially impact our financial position related to certain Design Galleries or distribution center facilities which typically have greater fair values.
The determination of fair value requires subjectivity and estimates, including the use of multiple valuation techniques and uncertain inputs, such as market price per square foot and assumed capitalization rates or the replacement cost of the assets, where applicable. Where real estate valuation expertise is required we obtain independent third-party appraisals to determine the fair value of the underlying asset and lease components. While determining fair value requires a variety of input assumptions and judgment, we believe our estimates of fair value are reasonable.
Stock-Based Compensation—Performance-Based Awards
For awards with performance-based criteria, compensation expense is recognized on an accelerated basis over the requisite service period. The fair value of each performance-based option award granted is estimated on the date of grant using a Monte Carlo simulation option pricing model that requires the input of subjective assumptions regarding the future exercise behavior, expected volatility and a discount for illiquidity. We determined these assumptions based on consideration of (i) future exercise behavior based on the historical observed exercise pattern of the award recipient, (ii) expected volatility based on our historical observed common stock prices measured over the full trading history of our common stock and implied volatility based on 180-day average trading prices of our common stock, and (iii) a discount for illiquidity estimated using the Finnerty method.
PART II |
FORM 10-K | 61 |
Equity Method Investments
In fiscal 2020, we entered into equity method investments in connection with real estate development initiatives in Aspen, Colorado. These investments in privately-held limited liability companies (the “Aspen LLCs” or “equity method investments”) meet the criteria of variable interest entities (“VIEs”) and are not consolidated.
When we have a variable interest in another legal entity, we evaluate whether that legal entity is within the scope of the VIE model and, if so, whether we are the primary beneficiary of the VIE. We evaluate a legal entity for consolidation under the VIE model if no scope exceptions apply and, by design, the total equity investment at risk is not sufficient to permit the legal entity to finance its activities without additional subordinated financial support or, as a group, the holders of the equity investment at risk lack any of the characteristics of a controlling financial interest. The Aspen LLCs are qualitatively determined to be VIEs due to insufficient equity investment at risk.
We consolidate a VIE if our involvement indicates that we are the primary beneficiary. We would be the primary beneficiary of a VIE if we have both (i) the power to direct the activities of the VIE that most significantly impact the VIE’s economic performance and (ii) the obligation to absorb losses or the right to receive benefits of the VIE that could potentially be significant to the VIE. The determination of the power to direct the activities that most significantly impact economic performance requires judgement and is impacted by numerous factors including the purpose of the VIE, contractual rights and obligations of the variable interest holders, and mechanisms for the resolution of disputes among the variable interest holders. We account for investments under the equity method of accounting when we are not the primary beneficiary with a controlling financial interest but we have significant influence over the operations of the investee. In evaluating if we exert control or significant influence we consider factors such as the terms and structure of the investment agreement and the legal structure of the investee, including investor voting or other rights, and other agreements with the investee. We account for our investments in the Aspen LLCs using the equity method of accounting because we do not have a controlling financial interest but have the ability to exercise significant influence over the Aspen LLCs.
Equity method investments are initially measured at cost. As of our investment date, we determine the fair value of the underlying assets and liabilities held by the Aspen LLCs for purposes of determining whether or not we have basis differences arising in connection with our investment. The determination of fair value of the underlying real estate assets requires subjectivity and estimates, including the use of various valuation techniques and Level 3 inputs, such as market price per square foot and assumed capitalization rates or the replacement cost of the assets, where applicable. If specialized expertise is required we obtain independent third-party appraisals to determine the fair value of the underlying assets and liabilities. While determining fair value requires a variety of input assumptions and judgment, we believe our estimates of fair value are reasonable.
Recently Issued Accounting Pronouncements
Refer to “Recently Issued Accounting Standards” within Note 3—Significant Accounting Policies in our consolidated financial statements within Part II of this Annual Report on Form 10-K.
ITEM 7A. QUANTITATIVE AND QUALITATIVE DISCLOSURE OF MARKET RISKS
Interest Rate Risk
We currently do not engage in any interest rate hedging activity and we have no intention to do so in the foreseeable future.
We are subject to interest rate risk in connection with borrowings under the ABL Credit Agreement and the Term Loan Credit Agreement, in each case bearing interest at variable rates and we may incur additional indebtedness that bears interest at variable rates. As of January 29, 2022, we had no outstanding borrowings under the revolving line of credit and $1,995 million outstanding under the Term Loan Credit Agreement. The ABL Credit Agreement provides for a borrowing amount based on the value of eligible collateral and a formula linked to certain borrowing percentages based on certain categories of collateral. Under the terms of such provisions, the amount under the revolving line of credit borrowing base that could be available pursuant to the ABL Credit Agreement as of January 29, 2022 was $347 million, net of $20 million in outstanding letters of credit. Based on the average interest rate on the revolving line of credit and the Term Loan during the year ended January 29, 2022, and to the extent that borrowings were outstanding under any facility, we do not believe that a 10% change in the interest rate would have a material effect on our consolidated results of operations or financial condition. To the extent that we incur additional indebtedness, we may increase our exposure to risk from interest rate fluctuations.
62 | FORM 10-K |
PART II |
A number of our current debt agreements, including the ABL Credit Agreement and the Term Loan Credit Agreement, have an interest rate tied to LIBOR, which is expected to be discontinued in accordance with reference rate reform and the phase out of LIBOR. A number of alternatives to LIBOR have been proposed or are being developed, but it is not clear which, if any, will be adopted. Any of these alternative methods may result in interest payments that are higher than expected or that do not otherwise correlate over time with the payments that would have been made on such indebtedness for the interest periods if the applicable LIBOR rate was available in its current form.
As of January 29, 2022, we had $74 million principal amount of 0.00% convertible senior notes due 2023 outstanding (the “2023 Notes”). As this instrument does not bear interest, we do not have interest rate risk exposure related to this debt.
As of January 29, 2022, we had $220 million principal amount of 0.00% convertible senior notes due 2024 outstanding (the “2024 Notes”). As this instrument does not bear interest, we do not have interest rate risk exposure related to this debt.
Foreign Currency Risk
Our revenues are predominately denominated in U.S. dollars, and accordingly, our net revenues are not currently subject to significant foreign currency risk. However, as we are currently expanding our operations into select European markets, fluctuations in foreign currency exchange rates are beginning to impact our results of operations. Certain of our operating expenses are denominated in the currencies of the countries in which our operations exist or are expanding, and accordingly, we have exposure to adverse movements in foreign currency exchange rates, particularly changes in the Pound sterling, Euro and Canadian Dollar, as our international operations are translated from local currency, or functional currency, into U.S. dollars upon consolidation. Fluctuations in foreign currency exchange rates may cause us to recognize transaction gains and losses in our consolidated statements of income, which are presented in other expenses—net on the consolidated statements of income. We minimize this exposure by managing cash balances at levels appropriate to meet forthcoming expenses in U.S. dollars and applicable foreign currencies.
To date, we have not engaged in foreign currency hedging transactions because our foreign currency transaction gains and losses have not been material to our consolidated financial statements, but we may begin foreign currency risk management strategies in the future.
Market Price Sensitive Instruments
0.00% Convertible Senior Notes due 2023
In connection with the issuance of the 2023 Notes, we entered into privately-negotiated convertible note hedge transactions with certain counterparties. The convertible note hedge transactions relate to, collectively, 1.7 million shares of our common stock, which represents the number of shares of our common stock underlying the 2023 Notes, subject to anti-dilution adjustments substantially similar to those applicable to the 2023 Notes. These convertible note hedge transactions are expected to reduce the potential earnings dilution with respect to our common stock upon conversion of the 2023 Notes and/or reduce our exposure to potential cash or stock payments that may be required upon conversion of the 2023 Notes.
We also entered into separate warrant transactions with the same group of counterparties initially relating to the number of shares of our common stock underlying the convertible note hedge transactions, subject to customary anti-dilution adjustments. The warrant transactions will have a dilutive effect with respect to our common stock to the extent that the price per share of our common stock exceeds the strike price of the warrants unless we elect, subject to certain conditions, to settle the warrants in cash. The strike price of the warrant transactions is initially $309.84 per share. Refer to Note 12—Convertible Senior Notes in our consolidated financial statements within Part II of this Annual Report on Form 10-K.
0.00% Convertible Senior Notes due 2024
In connection with the issuance of the 2024 Notes, we entered into privately-negotiated convertible note hedge transactions with certain counterparties. The convertible note hedge transactions relate to, collectively, 1.7 million shares of our common stock, which represents the number of shares of our common stock underlying the 2024 Notes, subject to anti-dilution adjustments substantially similar to those applicable to the 2024 Notes. These convertible note hedge transactions are expected to reduce the potential earnings dilution with respect to our common stock upon conversion of the 2024 Notes and/or reduce our exposure to potential cash or stock payments that may be required upon conversion of the 2024 Notes.
PART II |
FORM 10-K | 63 |
We also entered into separate warrant transactions with the same group of counterparties initially relating to the number of shares of our common stock underlying the convertible note hedge transactions, subject to customary anti-dilution adjustments. The warrant transactions will have a dilutive effect with respect to our common stock to the extent that the price per share of our common stock exceeds the strike price of the warrants unless we elect, subject to certain conditions, to settle the warrants in cash. The strike price of the warrant transactions is initially $338.24 per share. Refer to Note 12—Convertible Senior Notes in our consolidated financial statements within Part II of this Annual Report on Form 10-K.
Impact of Inflation
Our results of operations and financial condition are presented based on historical cost. While it is difficult to accurately measure the historical impact of inflation due to the imprecise nature of the estimates required, we believe the effects of inflation, if any, on our consolidated results of operations and financial condition have been immaterial. In future periods, we might be adversely affected by various aspects of inflation to the extent we are not able to overcome these issues through measures such as price increases for our products. Risks related to inflation could include increased costs for many products and services that are necessary for the operation of our business, as well as the impact of interest rate increases, which could have a negative effect on the housing market.
64 | FORM 10-K |
PART II |
ITEM 8. FINANCIAL STATEMENTS AND SUPPLEMENTARY DATA
RH
INDEX TO CONSOLIDATED FINANCIAL STATEMENTS
Report of Independent Registered Public Accounting Firm (PCAOB ID: |
66 |
|
69 |
||
70 |
||
71 |
||
72 |
||
74 |
||
77 |
REPORT OF INDEPENDENT REGISTERED PUBLIC ACCOUNTING FIRM
To the Board of Directors and Stockholders of RH
Opinions on the Financial Statements and Internal Control over Financial Reporting
We have audited the accompanying consolidated balance sheets of RH and its subsidiaries (the “Company”) as of January 29, 2022 and January 30, 2021, and the related consolidated statements of income, of comprehensive income, of stockholders’ equity and of cash flows for each of the three years in the period ended January 29, 2022, including the related notes (collectively referred to as the “consolidated financial statements”). We also have audited the Company's internal control over financial reporting as of January 29, 2022, based on criteria established in Internal Control – Integrated Framework (2013) issued by the Committee of Sponsoring Organizations of the Treadway Commission (COSO).
In our opinion, the consolidated financial statements referred to above present fairly, in all material respects, the financial position of the Company as of January 29, 2022 and January 30, 2021, and the results of its operations and its cash flows for each of the three years in the period ended January 29, 2022 in conformity with accounting principles generally accepted in the United States of America. Also in our opinion, the Company maintained, in all material respects, effective internal control over financial reporting as of January 29, 2022, based on criteria established in Internal Control - Integrated Framework (2013) issued by the COSO.
Basis for Opinions
The Company's management is responsible for these consolidated financial statements, for maintaining effective internal control over financial reporting, and for its assessment of the effectiveness of internal control over financial reporting, included in Management’s Report on Internal Control over Financial Reporting appearing under Item 9A. Our responsibility is to express opinions on the Company’s consolidated financial statements and on the Company's internal control over financial reporting based on our audits. We are a public accounting firm registered with the Public Company Accounting Oversight Board (United States) (PCAOB) and are required to be independent with respect to the Company in accordance with the U.S. federal securities laws and the applicable rules and regulations of the Securities and Exchange Commission and the PCAOB.
We conducted our audits in accordance with the standards of the PCAOB. Those standards require that we plan and perform the audits to obtain reasonable assurance about whether the consolidated financial statements are free of material misstatement, whether due to error or fraud, and whether effective internal control over financial reporting was maintained in all material respects.
Our audits of the consolidated financial statements included performing procedures to assess the risks of material misstatement of the consolidated financial statements, whether due to error or fraud, and performing procedures that respond to those risks. Such procedures included examining, on a test basis, evidence regarding the amounts and disclosures in the consolidated financial statements. Our audits also included evaluating the accounting principles used and significant estimates made by management, as well as evaluating the overall presentation of the consolidated financial statements. Our audit of internal control over financial reporting included obtaining an understanding of internal control over financial reporting, assessing the risk that a material weakness exists, and testing and evaluating the design and operating effectiveness of internal control based on the assessed risk. Our audits also included performing such other procedures as we considered necessary in the circumstances. We believe that our audits provide a reasonable basis for our opinions.
Definition and Limitations of Internal Control over Financial Reporting
A company’s internal control over financial reporting is a process designed to provide reasonable assurance regarding the reliability of financial reporting and the preparation of financial statements for external purposes in accordance with generally accepted accounting principles. A company’s internal control over financial reporting includes those policies and procedures that (i) pertain to the maintenance of records that, in reasonable detail, accurately and fairly reflect the transactions and dispositions of the assets of the company; (ii) provide reasonable assurance that transactions are recorded as necessary to permit preparation of financial statements in accordance with generally accepted accounting principles, and that receipts and expenditures of the company are being made only in accordance with authorizations of management and directors of the company; and (iii) provide reasonable assurance regarding prevention or timely detection of unauthorized acquisition, use, or disposition of the company’s assets that could have a material effect on the financial statements.
Because of its inherent limitations, internal control over financial reporting may not prevent or detect misstatements. Also, projections of any evaluation of effectiveness to future periods are subject to the risk that controls may become inadequate because of changes in conditions, or that the degree of compliance with the policies or procedures may deteriorate.
Critical Audit Matters
The critical audit matter communicated below is a matter arising from the current period audit of the consolidated financial statements that was communicated or required to be communicated to the audit committee and that (i) relates to accounts or disclosures that are material to the consolidated financial statements and (ii) involved our especially challenging, subjective, or complex judgments. The communication of critical audit matters does not alter in any way our opinion on the consolidated financial statements, taken as a whole, and we are not, by communicating the critical audit matter below, providing a separate opinion on the critical audit matter or on the accounts or disclosures to which it relates.
Determination of the Classification of New Real Estate Lease Contracts
As described in Notes 3 and 11 to the consolidated financial statements, certain of the Company’s real estate leases are classified as finance leases. Leases that do not meet the definition of a finance lease are considered operating leases. For the year ended January 29, 2022, lease right-of-use assets obtained in exchange for lease obligations (net of lease terminations) totaled $172 million related to operating leases and $90 million related to finance leases, of which a significant portion of the operating and finance leases relates to new real estate leases. Lease characteristics that management evaluates to determine lease classification include, but are not limited to, the reasonably certain lease term, incremental borrowing rate, and fair value of the leased asset.
The principal considerations for our determination that performing procedures relating to the determination of the classification of new real estate lease contracts is a critical audit matter are (i) the significant judgment by management when determining the classification of new real estate lease contracts based on its evaluation of the lease characteristics; (ii) a high degree of auditor judgment, subjectivity, and effort in performing procedures and evaluating management’s significant assumptions related to the reasonably certain lease term, incremental borrowing rate, and fair value of the leased asset; and (iii) the audit effort involved the use of professionals with specialized skill and knowledge.
PART II — FINANCIAL STATEMENTS |
FORM 10-K | 67 |
Addressing the matter involved performing procedures and evaluating audit evidence in connection with forming our overall opinion on the consolidated financial statements. These procedures included testing the effectiveness of controls relating to lease accounting, including controls over management’s determination of the classification of new real estate lease contracts based on the lease characteristics. These procedures also included, among others (i) reading the lease agreements; (ii) testing management’s process for determining the classification of new real estate lease contracts based the lease characteristics; (iii) testing the completeness and accuracy of the underlying data used; and (iv) evaluating the reasonableness of the significant assumptions used by management related to the reasonably certain lease term, incremental borrowing rate, and fair value of the leased asset. Evaluating management’s significant assumptions related to the reasonably certain lease term and incremental borrowing rate involved evaluating whether the significant assumptions used by management were reasonable considering (i) the current and past performance of the Company; (ii) consistency with external market and industry data; and (iii) whether the significant assumptions were consistent with evidence obtained in other areas of the audit. Professionals with specialized skill and knowledge were used to assist in evaluating the reasonableness of the significant assumptions related to the incremental borrowing rate and fair value of the leased asset.
/s/
March 30, 2022
We have served as the Company’s auditor since 2008.
68 | FORM 10-K |
PART II — FINANCIAL STATEMENTS |
RH
CONSOLIDATED BALANCE SHEETS
(In thousands, except share amounts)
|
|
JANUARY 29, |
|
JANUARY 30, |
||
|
2022 |
2021 |
||||
ASSETS |
|
|
|
|
||
Current assets: |
|
|
|
|
||
Cash and cash equivalents |
$ |
|
$ |
|
||
Accounts receivable—net |
|
|
|
|
||
Merchandise inventories |
|
|
|
|
||
Prepaid expense and other current assets |
|
|
|
|
||
Total current assets |
|
|
|
|
||
Property and equipment—net |
|
|
|
|
||
Operating lease right-of-use assets |
|
|
||||
Goodwill |
|
|
|
|
||
Tradenames, trademarks and other intangible assets |
|
|
|
|
||
Deferred tax assets |
|
|
|
|
||
Equity method investments |
|
|
||||
Other non-current assets |
|
|
|
|
||
Total assets |
$ |
|
$ |
|
||
LIABILITIES AND STOCKHOLDERS’ EQUITY |
|
|
|
|
||
Current liabilities: |
|
|
|
|
||
Accounts payable and accrued expenses |
$ |
|
$ |
|
||
Deferred revenue and customer deposits |
|
|
|
|||
Convertible senior notes due 2023—net |
|
|
||||
Convertible senior notes due 2024—net |
|
— |
||||
Operating lease liabilities |
|
|
||||
Other current liabilities |
|
|
|
|
||
Total current liabilities |
|
|
|
|
||
Asset based credit facility |
|
|
|
|
||
Term loan—net |
|
|
|
— |
||
Convertible senior notes due 2023—net |
|
|
|
|
||
Convertible senior notes due 2024—net |
|
|
||||
Non-current operating lease liabilities |
|
|
|
|
||
Non-current finance lease liabilities |
|
|
||||
Other non-current obligations |
|
|
|
|
||
Total liabilities |
|
|
|
|
||
Commitments and contingencies (Note 20) |
|
|
||||
Stockholders’ equity: |
|
|
|
|
||
Preferred stock—$ |
|
|||||
Common stock—$ |
|
|
|
|
||
Additional paid-in capital |
|
|
|
|
||
Accumulated other comprehensive income (loss) |
|
( |
|
|
||
Retained earnings (accumulated deficit) |
|
|
|
( |
||
Total stockholders’ equity |
|
|
|
|
||
Total liabilities and stockholders’ equity |
$ |
|
$ |
|
||
The accompanying notes are an integral part of these Consolidated Financial Statements.
RH
CONSOLIDATED STATEMENTS OF INCOME
(In thousands, except share and per share amounts)
|
YEAR ENDED |
||||||||
|
JANUARY 29, |
JANUARY 30, |
FEBRUARY 1, |
||||||
|
|
2022 |
|
2021 |
|
2020 |
|||
Net revenues |
$ |
|
$ |
|
$ |
|
|||
Cost of goods sold |
|
|
|
|
|
|
|||
Gross profit |
|
|
|
|
|
|
|||
Selling, general and administrative expenses |
|
|
|
|
|
|
|||
Income from operations |
|
|
|
|
|
|
|||
Other expenses |
|
|
|
|
|
|
|||
Interest expense—net |
|
|
|
|
|
|
|||
Tradename impairment |
— |
|
— |
||||||
(Gain) loss on extinguishment of debt |
|
|
|
( |
|
|
|||
Other expense—net |
|
— |
— |
||||||
Total other expenses |
|
|
|
|
|
|
|||
Income before income taxes |
|
|
|
|
|
|
|||
Income tax expense |
|
|
|
|
|
|
|||
Income before equity method investments |
|
|
|
||||||
Share of equity method investments losses |
( |
( |
— |
||||||
Net income |
$ |
|
$ |
|
$ |
|
|||
Weighted-average shares used in computing basic net income per share |
|
|
|
|
|
||||
Basic net income per share |
$ |
|
$ |
|
$ |
|
|||
Weighted-average shares used in computing diluted net income per share |
|
|
|
|
|
||||
Diluted net income per share |
$ |
|
$ |
|
$ |
|
|||
The accompanying notes are an integral part of these Consolidated Financial Statements.
70 | FORM 10-K |
PART II — FINANCIAL STATEMENTS |
RH
CONSOLIDATED STATEMENTS OF COMPREHENSIVE INCOME
(In thousands)
|
YEAR ENDED |
||||||||
|
JANUARY 29, |
JANUARY 30, |
FEBRUARY 1, |
||||||
|
2022 |
|
2021 |
|
2020 |
||||
Net income |
$ |
|
$ |
|
$ |
|
|||
Net gains (losses) from foreign currency translation |
|
( |
|
|
|
( |
|||
Total comprehensive income |
$ |
|
$ |
|
$ |
|
|||
The accompanying notes are an integral part of these Consolidated Financial Statements.
PART II — FINANCIAL STATEMENTS |
FORM 10-K | 71 |
RH
CONSOLIDATED STATEMENTS OF STOCKHOLDERS’ EQUITY (DEFICIT)
(In thousands, except share amounts)
YEAR ENDED |
||||||||||||||||||||||
|---|---|---|---|---|---|---|---|---|---|---|---|---|---|---|---|---|---|---|---|---|---|---|
COMMON STOCK |
TREASURY STOCK |
|||||||||||||||||||||
|
ACCUMULATED |
|
RETAINED |
|
||||||||||||||||||
|
ADDITIONAL |
|
OTHER |
|
EARNINGS |
|
TOTAL |
|||||||||||||||
|
PAID-IN |
|
COMPREHENSIVE |
|
(ACCUMULATED |
|
|
STOCKHOLDERS' |
||||||||||||||
|
SHARES |
|
AMOUNT |
|
CAPITAL |
|
INCOME (LOSS) |
|
DEFICIT) |
|
SHARES |
|
AMOUNT |
|
EQUITY |
|||||||
Balances—February 2, 2019 |
|
$ |
|
$ |
|
$ |
( |
|
$ |
( |
|
|
$ |
( |
|
$ |
( |
|||||
Stock-based compensation |
— |
|
— |
|
|
— |
|
— |
|
— |
|
— |
|
|||||||||
Issuance of restricted stock |
|
— |
|
— |
|
— |
|
— |
|
— |
|
— |
|
— |
||||||||
Vested and delivered restricted stock units |
|
— |
|
( |
|
— |
|
— |
|
— |
|
— |
|
( |
||||||||
Exercise of stock options |
|
— |
|
|
— |
|
— |
|
— |
|
— |
|
||||||||||
Repurchases of common stock |
( |
|
— |
|
— |
|
— |
|
— |
|
|
( |
|
( |
||||||||
Retirement of treasury stock |
— |
|
— |
|
( |
|
— |
|
( |
|
( |
|
|
— |
||||||||
Shares issued in connection with warrant agreements |
|
— |
|
— |
|
— |
|
— |
|
— |
|
— |
|
— |
||||||||
Equity component value of convertible note issuance—net |
— |
|
— |
|
|
— |
|
— |
|
— |
|
— |
|
|||||||||
Sale of common stock warrant |
— |
|
— |
|
|
— |
|
— |
|
— |
|
— |
|
|||||||||
Purchase of convertible note hedge |
— |
— |
( |
— |
— |
— |
( |
|||||||||||||||
Conversion of convertible senior notes |
— |
— |
— |
( |
||||||||||||||||||
Net income |
— |
|
— |
|
— |
|
— |
|
|
— |
|
— |
|
|||||||||
Net losses from foreign currency translation |
— |
|
— |
|
— |
|
( |
|
— |
|
— |
|
— |
|
( |
|||||||
PART II — FINANCIAL STATEMENTS |
FORM 10-K | 72 |
RH
CONSOLIDATED STATEMENTS OF STOCKHOLDERS’ EQUITY (DEFICIT) (continued)
(In thousands, except share amounts)
YEAR ENDED |
||||||||||||||||||||||
|---|---|---|---|---|---|---|---|---|---|---|---|---|---|---|---|---|---|---|---|---|---|---|
COMMON STOCK |
TREASURY STOCK |
|||||||||||||||||||||
|
ACCUMULATED |
|
RETAINED |
|
||||||||||||||||||
|
ADDITIONAL |
|
OTHER |
|
EARNINGS |
|
TOTAL |
|||||||||||||||
|
PAID-IN |
|
COMPREHENSIVE |
|
(ACCUMULATED |
|
|
STOCKHOLDERS' |
||||||||||||||
|
SHARES |
|
AMOUNT |
|
CAPITAL |
|
INCOME (LOSS) |
|
DEFICIT) |
|
SHARES |
|
AMOUNT |
|
EQUITY |
|||||||
Balances—February 1, 2020 |
|
$ |
|
$ |
|
$ |
( |
|
$ |
( |
|
— |
|
$ |
— |
|
$ |
|||||
Stock-based compensation |
— |
— |
— |
— |
— |
— |
|
|||||||||||||||
Issuance of restricted stock |
— |
— |
— |
— |
— |
— |
|
— |
||||||||||||||
Vested and delivered restricted stock units |
— |
( |
— |
— |
— |
— |
|
( |
||||||||||||||
Exercise of stock options |
— |
— |
— |
— |
— |
|
||||||||||||||||
Repurchases of common stock |
( |
— |
— |
— |
— |
( |
|
( |
||||||||||||||
Retirement of treasury stock |
— |
— |
( |
— |
— |
( |
|
— |
||||||||||||||
Shares issued in connection with warrant agreements |
— |
— |
— |
— |
— |
— |
|
— |
||||||||||||||
Settlement of convertible senior notes |
— |
( |
— |
— |
( |
|
— |
|||||||||||||||
Exercise of call option under bond hedge upon settlement of convertible senior notes |
( |
— |
— |
— |
( |
|
— |
|||||||||||||||
Net income |
— |
— |
— |
— |
— |
— |
|
|||||||||||||||
Net gains from foreign currency translation |
— |
— |
— |
— |
— |
— |
|
|||||||||||||||
Balances—January 30, 2021 |
|
$ |
|
$ |
|
$ |
|
$ |
( |
|
— |
|
$ |
— |
|
$ |
||||||
Stock-based compensation |
— |
— |
— |
— |
— |
— |
|
|||||||||||||||
Issuance of restricted stock |
— |
— |
— |
— |
— |
— |
|
— |
||||||||||||||
Vested and delivered restricted stock units |
— |
( |
— |
— |
— |
— |
|
( |
||||||||||||||
Exercise of stock options |
— |
— |
— |
— |
— |
|
||||||||||||||||
Settlement of convertible senior notes |
— |
( |
— |
— |
( |
( |
||||||||||||||||
Exercise of call option under bond hedge upon settlement of convertible senior notes |
( |
— |
— |
— |
( |
— |
||||||||||||||||
Net income |
— |
— |
— |
— |
— |
— |
|
|||||||||||||||
Net losses from foreign currency translation |
— |
— |
— |
( |
— |
— |
— |
|
( |
|||||||||||||
Balances—January 29, 2022 |
|
$ |
|
$ |
|
$ |
( |
|
$ |
|
— |
|
$ |
— |
|
$ |
||||||
The accompanying notes are an integral part of these Consolidated Financial Statements.
PART II — FINANCIAL STATEMENTS |
FORM 10-K | 73 |
RH
CONSOLIDATED STATEMENTS OF CASH FLOWS
(In thousands)
|
YEAR ENDED |
||||||||
|---|---|---|---|---|---|---|---|---|---|
|
JANUARY 29, |
JANUARY 30, |
FEBRUARY 1, |
||||||
|
2022 |
|
2021 |
|
2020 |
||||
CASH FLOWS FROM OPERATING ACTIVITIES |
|||||||||
Net income |
$ |
|
$ |
|
$ |
|
|||
Adjustments to reconcile net income to net cash provided by operating activities: |
|
|
|
|
|||||
Depreciation and amortization |
|
|
|
|
|||||
Non-cash operating lease cost |
|
|
|
||||||
Tradename impairment |
— |
|
— |
||||||
Asset impairments |
|
|
|
||||||
(Gain) loss on sale leaseback transaction |
— |
|
( |
||||||
Amortization of debt discount |
|
|
|
|
|||||
Stock-based compensation expense |
|
|
|
|
|||||
Non-cash finance lease interest expense |
|
|
|
||||||
Product recalls |
|
|
( |
||||||
Deferred income taxes |
|
( |
( |
( |
|||||
(Gain) loss on extinguishment of debt |
|
( |
|
||||||
Share of equity method investments losses |
|
|
— |
||||||
Other non-cash items |
|
( |
|
|
|||||
Cash paid attributable to accretion of debt discount upon settlement of debt |
( |
( |
( |
||||||
Change in assets and liabilities: |
|
||||||||
Accounts receivable |
|
|
( |
( |
|||||
Merchandise inventories |
|
( |
( |
|
|||||
Prepaid expense and other assets |
|
( |
( |
|
|||||
Landlord assets under construction—net of tenant allowances |
|
( |
( |
( |
|||||
Accounts payable and accrued expenses |
|
|
|
|
|||||
Deferred revenue and customer deposits |
|
|
|
|
|||||
Other current liabilities |
|
( |
|
( |
|||||
Current and non-current operating lease liabilities |
|
( |
( |
( |
|||||
Other non-current obligations |
|
( |
( |
( |
|||||
Net cash provided by operating activities |
|
|
|
|
|
|
|||
CASH FLOWS FROM INVESTING ACTIVITIES |
|
|
|
||||||
Capital expenditures |
|
( |
( |
( |
|||||
Equity method investments |
|
( |
( |
— |
|||||
Acquisition of business and assets |
|
— |
( |
— |
|||||
Deposits on asset under construction |
— |
( |
( |
||||||
Proceeds from sale of assets |
|
— |
|
|
|||||
Net cash used in investing activities |
|
( |
|
( |
|
( |
|||
PART II — FINANCIAL STATEMENTS |
FORM 10-K | 74 |
|
YEAR ENDED |
||||||||
|---|---|---|---|---|---|---|---|---|---|
|
JANUARY 29, |
JANUARY 30, |
FEBRUARY 1, |
||||||
|
2022 |
|
2021 |
|
2020 |
||||
CASH FLOWS FROM FINANCING ACTIVITIES |
|
|
|
|
|
|
|||
Borrowings under asset based credit facility |
|
— |
|
|
|||||
Repayments under asset based credit facility |
|
— |
( |
( |
|||||
Borrowings under term loan |
|
|
— |
|
|||||
Repayments under term loans |
( |
— |
( |
||||||
Borrowings under promissory and equipment security notes |
|
— |
|
|
|||||
Repayments under promissory and equipment security notes |
|
( |
( |
( |
|||||
Debt issuance costs |
|
( |
— |
( |
|||||
Proceeds from issuance of convertible senior notes |
|
— |
— |
|
|||||
Proceeds from issuance of warrants |
|
— |
— |
|
|||||
Purchase of convertible note hedges |
|
— |
— |
( |
|||||
Debt issuance costs related to convertible senior notes |
|
— |
— |
( |
|||||
Repayments of convertible senior notes |
( |
( |
( |
||||||
Principal payments under finance leases |
( |
( |
( |
||||||
Repurchases of common stock—including commissions |
|
— |
— |
( |
|||||
Proceeds from exercise of stock options |
|
|
|
|
|||||
Tax withholdings related to issuance of stock-based awards |
( |
( |
( |
||||||
Net cash provided by (used in) financing activities |
|
|
|
( |
|
( |
|||
Effects of foreign currency exchange rate translation |
|
( |
|
|
|||||
Net increase in cash and cash equivalents and restricted cash equivalents |
|
|
|
|
|
|
|||
Cash and cash equivalents and restricted cash equivalents |
|
|
|
|
|
||||
Beginning of period—cash and cash equivalents |
|
|
|
|
|
||||
Beginning of period—restricted cash equivalents (acquisition related escrow deposits) |
|
|
— |
— |
|||||
Beginning of period—cash and cash equivalents |
$ |
|
$ |
|
$ |
|
|||
End of period—cash and cash equivalents |
|
|
|
|
|
||||
End of period—restricted cash equivalents (acquisition related escrow deposits) |
|
|
|
|
— |
||||
End of period—cash and cash equivalents and restricted cash equivalents |
$ |
|
$ |
|
$ |
|
|||
Cash paid for interest |
$ |
|
$ |
|
$ |
|
|||
Cash paid for taxes |
|
|
|
||||||
PART II — FINANCIAL STATEMENTS |
FORM 10-K | 75 |
|
YEAR ENDED |
||||||||
|---|---|---|---|---|---|---|---|---|---|
|
JANUARY 29, |
JANUARY 30, |
FEBRUARY 1, |
||||||
|
2022 |
|
2021 |
|
2020 |
||||
Non-cash transactions: |
|
|
|
|
|
||||
Property and equipment additions in accounts payable and accrued expenses at period-end |
$ |
|
$ |
|
$ |
|
|||
Landlord asset additions in accounts payable and accrued expenses at period-end |
|
|
|
||||||
Reclassification of assets from landlord assets under construction to finance lease right-of-use assets |
|
|
|
||||||
Promissory notes forgiven in exchange for assets |
— |
|
— |
||||||
Conversion of loan receivables into equity method investments |
— |
|
— |
||||||
Shares issued on settlement of convertible senior notes |
( |
( |
— |
||||||
Shares received on exercise of call option under bond hedge upon settlement of convertible senior notes |
|
|
— |
||||||
The accompanying notes are an integral part of these Consolidated Financial Statements.
76 | FORM 10-K |
PART II — FINANCIAL STATEMENTS |
RH
NOTES TO CONSOLIDATED FINANCIAL STATEMENTS
NOTE 1—NATURE OF BUSINESS
RH, a Delaware corporation, together with its subsidiaries (collectively, “we,” “us,” or the “Company”), is a leading retailer and luxury lifestyle brand operating primarily in the home furnishings market. Our curated and fully integrated assortments are presented consistently across our sales channels, including our retail locations, websites and Source Books. We offer merchandise assortments across a number of categories, including furniture, lighting, textiles, bathware, décor, outdoor and garden, and child and teen furnishings.
As of January 29, 2022, we operated a total of
NOTE 2—ORGANIZATION
The Company was formed on August 18, 2011 and capitalized on September 2, 2011 as a holding company for the purposes of facilitating an initial public offering of common equity and was at such time a direct subsidiary of Home Holdings, LLC, a Delaware limited liability company (“Home Holdings”).
On November 1, 2012, we acquired all of the outstanding shares of capital stock of Restoration Hardware, Inc., a Delaware corporation, and Restoration Hardware, Inc. became our direct, wholly owned subsidiary. Restoration Hardware, Inc. was a direct, wholly owned subsidiary of Home Holdings prior to our initial public offering. Outstanding units issued by Home Holdings under its equity compensation plan, referred to as the Team Resto Ownership Plan, were replaced with our common stock at the time of our initial public offering. These transactions are referred to as the “Reorganization.” On November 7, 2012, we completed our initial public offering.
On December 15, 2016, we filed a Certificate of Amendment to our Amended and Restated Certificate of Incorporation with the Secretary of State of the State of Delaware to change our name to “RH,” effective January 1, 2017.
Impact of the COVID-19 Pandemic upon our Financial Condition and Results of Operations
We have experienced a significant improvement in our business during fiscal 2021 despite the ongoing challenges presented by the COVID-19 pandemic and the disruption it has caused in our business operations beginning in the first quarter of fiscal 2020 and throughout fiscal 2021. Our performance demonstrates both the desirability of our exclusive products and our ability to overcome supply chain challenges, including port delays, which have impacted our ability to convert business demand into revenues at normal historical rates. We have continued to navigate changes in operational restrictions based upon changes in local conditions and regulations, and as pandemic-related restrictions continue to be lifted in fiscal 2022 we may see consumer spending patterns shift away from spending on the home and home-related categories, such as home furnishings, and consumers return to pre-COVID consumption trends, such as spending on travel and leisure, and other activities.
Our decisions regarding the sources and uses of capital in our business will continue to reflect and adapt to changes in market conditions and our business including further developments with respect to the pandemic. For more information, refer to Item 1A—Risk Factors in Part I of this Annual Report on Form 10-K.
NOTE 3—SIGNIFICANT ACCOUNTING POLICIES
Basis of Presentation
These consolidated financial statements are prepared in conformity with accounting principles generally accepted in the United States (“GAAP”). The consolidated financial statements include our accounts and those of our wholly owned subsidiaries. Accordingly, all intercompany balances and transactions have been eliminated through the consolidation process.
PART II — FINANCIAL STATEMENTS |
FORM 10-K | 77 |
Fiscal Years
Our fiscal year ends on the Saturday closest to January 31. As a result, our fiscal year may include 53 weeks. The fiscal years ended January 29, 2022 (“fiscal 2021”), January 30, 2021 (“fiscal 2020) and February 1, 2020 (“fiscal 2019”) each consisted of 52 weeks.
Use of Accounting Estimates
The preparation of our consolidated financial statements in conformity with GAAP requires us to make estimates and assumptions that affect the reported amounts of assets and liabilities and disclosures of contingent assets and liabilities at the date of the consolidated financial statements and the reported amounts of revenues and expenses during the reporting period. Actual results could differ from those estimates and such differences could be material to the consolidated financial statements.
Cash and Cash Equivalents
We consider all highly liquid investments with original maturities of 90 days or less to be cash equivalents.
Concentration of Credit Risk
We maintain our cash and cash equivalent accounts in high-quality financial institutions. The amount of cash and cash equivalents held with certain financial institutions exceeds government-insured limits. We perform ongoing evaluations of these institutions to limit our concentration of credit risk.
Accounts Receivable
Accounts receivable consist primarily of receivables from our credit card processors for sales transactions, receivables related to our Contract business and other miscellaneous receivables. Accounts receivable is presented net of allowance for expected credit losses, which is recorded on a specific identification basis, and was $
Merchandise Inventories
Our merchandise inventories consist primarily of finished goods and are carried at the lower of cost or net realizable value, with cost determined on a weighted-average cost method. To determine if the value of inventory should be marked down below original cost, we use estimates to determine the lower of cost or net realizable value, which considers current and anticipated demand, customer preference and the merchandise age. The inventory value is adjusted periodically to reflect current market conditions, which requires judgments that may significantly affect the ending inventory valuation, as well as gross margin. The estimates used in inventory valuation are lower of cost or net realizable value reserves and obsolescence (including excess and slow-moving inventory). In addition, we estimate and accrue for inventory shrinkage.
Our inventory reserves contain uncertainties that require us to make assumptions and to apply judgment regarding a number of factors, including market conditions, the selling environment, historical results and current inventory trends. We adjust inventory reserves for net realizable value and obsolescence based on trends, aging reports, specific identification and estimates of future retail sales prices.
Reserves for shrinkage are estimated and recorded throughout the year as a percentage of shipped sales for the direct channels, and as a percentage of cost of goods sold for the outlet business, based on historical shrinkage results and current inventory levels. Actual shrinkage is recorded throughout the year based upon periodic physical inventory counts. Actual inventory shrinkage and obsolescence can vary from estimates due to factors including the volume of inventory movement and execution against loss prevention initiatives in our distribution centers, home delivery center locations, off-site storage locations and with our third-party transportation providers.
Our inventory reserve balances were $
Product Recalls
When necessary, we initiate product recalls for certain of our products, as well as adjusted accruals related to certain product recalls previously initiated due to changes in estimates based on customer response and vendor and insurance recoveries. The product recall accrual was $
78 | FORM 10-K |
PART II — FINANCIAL STATEMENTS |
Advertising Expenses
Advertising expenses primarily represent the costs associated with our catalog mailings, which we refer to as Source Books, as well as print and website marketing. Total advertising expense, which is recorded in selling, general and administrative expenses on the consolidated statements of income, was $
Capitalized Catalog Costs
Capitalized catalog costs consist primarily of third-party incremental direct costs to prepare, print and distribute our Source Books. Such costs are capitalized and recognized as expense upon the delivery of the Source Books to the carrier. In the case of multiple printings of a Source Book, the creative costs will be expensed in full upon the initial delivery of Source Books to the carrier.
We had $
Website and Print Advertising
Website and print advertising expenses, which include e-commerce advertising, web creative content and direct marketing activities such as print media, radio and other media advertising, are expensed as incurred or upon the release of the content or the initial advertisement.
Property and Equipment
Property and equipment is recorded at cost, net of accumulated depreciation and amortization. Depreciation is calculated using the straight-line method, generally using the following useful lives:
CATEGORY OF PROPERTY AND EQUIPMENT |
USEFUL LIFE |
|
Building and building improvements |
|
|
Machinery, equipment and aircraft |
|
|
Furniture, fixtures and equipment |
|
|
Computer software |
|
The cost of leasehold improvements is amortized over the lesser of the useful life of the asset or the reasonably certain lease term.
We expense all internal-use software and website development costs incurred in the preliminary project stage and capitalize certain direct costs associated with the development and purchase of internal-use software or website development costs, including external costs of materials and services and internal payroll costs related to the software project, within property and equipment. Capitalized costs are amortized on a straight-line basis over the estimated useful lives of the software, generally between and
Interest is capitalized on construction in progress and software projects during the period in which expenditures have been made and activities are in progress to prepare the asset for its intended use. We capitalized interest of $
Land purchases are recorded at cost and are non-depreciable assets.
Property and equipment is reviewed for impairment whenever events or changes in circumstances indicate that the carrying amount of assets may not be recoverable. For further discussion regarding the impairment accounting policy refer to “Impairment—Long-Lived Assets” below.
Asset Held for Sale
Upon designation as an asset held for sale, the carrying value of the asset is recorded at the lower of its carrying value or its estimated fair value less estimated costs to sell, and we cease depreciating the asset.
PART II — FINANCIAL STATEMENTS |
FORM 10-K | 79 |
Lease Accounting
We lease nearly all of our retail and outlet locations, corporate headquarters, distribution centers and home delivery center locations, as well as other storage and office space. The initial lease terms of our real estate leases generally range from to
We account for lease and non-lease components as a single lease component for real estate leases, and for all other asset classes we account for the components separately. We determine the lease classification and begin to recognize lease and any related financing expenses upon the lease’s commencement, which for real estate leases is generally upon store opening or, to a lesser extent, when we take possession or control of the asset.
We sublease certain real estate locations to third parties under operating leases and recognize rental income received on a straight-line basis over the lease term, which is recorded as an offset to selling, general and administrative expenses on the consolidated statements of income.
Lease arrangements may require the landlord to provide tenant allowances directly to us. Standard tenant allowances received from landlords, typically those received under operating lease agreements, are recorded as cash and cash equivalents with an offset recorded in lease right-of-use assets on the consolidated balance sheets. Tenant allowances that are reasonably certain to be received subsequent to lease commencement are reflected as a reduction of both the lease liabilities and right-of-use assets on the consolidated balance sheets at the commencement date.
In the case of leases with associated construction, tenant allowances are provided for us to design and build the leased asset. Tenant allowances received from landlords during the construction phase of a leased asset and prior to lease commencement are recorded as cash and cash equivalents with an offset recorded in other non-current assets (to the extent we have incurred related capital expenditure for construction costs) or in other current liabilities (to the extent that payments are received prior to capital construction expenditures by us) on the consolidated balance sheets. After the leased asset is constructed and the lease commences, we reclassify the tenant allowance from other non-current assets or other current liabilities to lease right-of-use assets on the consolidated balance sheets, and such allowances are amortized over the reasonably certain lease term.
Lease Classification
Certain of our real estate and equipment leases are classified as finance leases. Lease characteristics that we evaluate to determine lease classification include, but are not limited to, the reasonably certain lease term, incremental borrowing rate and fair value of the leased asset. Additionally, the economic life of the leased asset impacts the lease classification, particularly related to historical buildings that tend to have longer lives. Lease related assets under such classification are included in “finance lease right-of-use assets” within property and equipment—net on the consolidated balance sheets.
Leases that do not meet the definition of a finance lease are considered operating leases. Lease related assets classified as operating leases are included in operating lease right-of-use assets on the consolidated balance sheets.
Reasonably Certain Lease Term
In recognizing the lease right-of-use assets and lease liabilities, we utilize the lease term for which we are reasonably certain to use the underlying asset, including consideration of options to extend or terminate the lease. At lease commencement, we evaluate whether it is reasonably certain to exercise available options based on consideration of a variety of economic factors and the circumstances related to the leased asset. Factors considered include, but are not limited to, (i) the contractual terms compared to estimated market rates, (ii) the uniqueness or importance of the asset or its location, (iii) the potential costs of obtaining an alternative asset, (iv) the potential costs of relocating or ceasing use of the asset, including the consideration of leasehold improvements and other invested capital, and (v) any potential tax consequences.
The determination of the reasonably certain lease term affects the inclusion of rental payments utilized in the incremental borrowing rate calculations, the results of the lease classification test, and consideration of certain assets held for sale or planned for sale-leaseback. The reasonably certain lease term may materially impact our financial position related to certain Design Galleries or distribution center facilities which typically have greater lease payments. Although the above factors are considered in our analysis, the assessment involves subjectivity considering our strategy, expected future events and market conditions. While we believe our estimates and judgments in determining the lease term are reasonable, future events may occur which may require us to reassess this determination.
80 | FORM 10-K |
PART II — FINANCIAL STATEMENTS |
Leases, or lease extensions, with a term of twelve months or less are not recorded on the consolidated balance sheets, and we recognize lease expense for these leases on a straight-line basis over the lease term.
Lease Payments
The majority of our real estate lease agreements include minimum rent payments which are subject to stated lease escalations over the lease term and eligible renewal periods. These stated fixed payments, through the reasonably certain lease term, are included in our measurement of the lease right-of-use assets and lease liabilities upon lease commencement.
Certain of our lease agreements include rental payments based on a percentage of retail sales over contractual levels. Additionally, certain lease agreements include rental payments based solely on a percentage of retail sales. Due to the variable and unpredictable nature of such payments, we do not recognize a lease right-of-use asset and lease liability related to such payments. Estimated variable rental payments are included in accounts payable and accrued expenses on the consolidated balance sheets in the period they are incurred and until such payments are made, and the related lease cost is included in cost of goods sold on the consolidated statements of income.
We have a small group of real estate leases that include rental payments periodically adjusted for inflation (e.g., based on the consumer price index). We include these variable payments in the initial measurement of the lease right-of-use asset and lease liability according to the index or rate at the commencement date and incorporates adjustments to rental payments in future periods if such increases have a minimum rent escalation (e.g., floor). Changes due to differences between the variable lease payments estimated at least commencement and actual amounts incurred are recognized in the consolidated statements of income in the period such costs are incurred.
Lease concessions related to the effects of the COVID-19 pandemic that do not result in a substantial increase in the rights of the lessor or our obligations as the lessee are accounted for as if no change to the lease contract were made. Under this approach, we recognize a separate non-interest bearing payable for any deferred payments in the concession period, which is recorded in accounts payable and accrued expenses on the consolidated balance sheets, and there is no change to the recognized lease expense on the consolidated statements of income. We account for COVID-19 related rent abatements as variable lease payments on the consolidated statements of income. Lease concessions for operating and finance lease agreements included in accounts payable and accrued expenses on the consolidated balance sheets as of January 29, 2022 and January 30, 2021 were not material.
Incremental Borrowing Rate
As our real estate leases and most of our equipment leases do not include an implicit interest rate, we determine the discount rate for each lease based upon the incremental borrowing rate (“IBR”) in order to calculate the present value of lease payments at the commencement date. The IBR is computed as the rate of interest that we would have to pay to borrow on a collateralized basis over a similar term an amount equal to the total lease payments in a similar economic environment. We utilize our outstanding debt facilities, including our asset based credit facility or our Term Loan Credit Agreement issued in October 2021, as the basis for determining the applicable IBR for each lease. We estimate the incremental borrowing rate for each lease primarily by reference to yield rates on debt issuances by companies of a similar credit rating, the weighted-average lease term and adjustments for differences between the yield rates and the actual term of the credit facility. In determining the yield rates, for Design Galleries we utilize market information on the lease commencement date and for leases other than new Design Galleries, we utilize market information as of the beginning of the quarter in which the lease commenced.
Fair Value
We determine the fair value of the underlying asset, considering lease components such as land and building, for purposes of determining the lease classification and allocating our contractual rental payments to the lease components. The fair value of the underlying asset and lease components also impact the evaluation and accounting for assets held for sale and sale-leaseback transactions. The fair value assessments may materially impact our financial position related to certain Design Galleries or distribution center facilities.
The determination of fair value requires subjectivity and estimates, including the use of multiple valuation techniques and uncertain inputs, such as market price per square foot and assumed capitalization rates or the replacement cost of the assets, where applicable. Where real estate valuation expertise is required, we obtain independent third-party appraisals to determine the fair value of the underlying asset and lease components. While determining fair value requires a variety of input assumptions and judgment, we believe our estimates of fair value are reasonable.
PART II — FINANCIAL STATEMENTS |
FORM 10-K | 81 |
Construction Related Activities
We are often involved in the construction of leased stores for our new Design Galleries. Upon construction commencement, we evaluate whether or not we, as lessee, control the asset being constructed and, depending on the extent to which we are involved, we may be the “deemed owner” of the leased asset for accounting purposes during the construction period under a build-to-suit arrangement.
If we are the “deemed owner” for accounting purposes, upon commencement of the construction project we are required to capitalize (i) costs incurred by us and (ii) the cash and non-cash assets contributed by the landlord for construction as property and equipment on our consolidated balance sheets as build-to-suit assets, with an offsetting financing obligation under build-to-suit lease transactions. The contributions by the landlord toward construction, including the building, existing site improvements at construction commencement and any amounts paid by the landlord to those responsible for construction, are included as property and equipment additions due to build-to-suit lease transactions within the non-cash section of the consolidated statements of cash flows. Over the lease term, these non-cash additions to property and equipment do not impact our cash outflows, nor do they impact net income on the consolidated statements of income.
Upon completion of the construction project where we are the deemed owner, we perform a sale-leaseback analysis to determine if we can derecognize the build-to-suit asset and corresponding financing obligation. If the asset and liability cannot be derecognized, we account for the agreement as a debt-like arrangement.
If we are involved in a debt-like arrangement for a non-real estate asset under construction for which we plan to lease such asset upon construction completion and make deposits during the construction period, we recognize the related deposits as “Deposits on asset under construction” within other non-current assets on the consolidated balance sheets (refer to Note 4—Prepaid Expense and Other Assets). In the event we execute promissory notes related to the deposits, such promissory notes are recorded as “Promissory notes on asset under construction” within other current liabilities on the consolidated balance sheets (refer to Note 9—Accounts Payable, Accrued Expenses and Other Current Liabilities). We recognize the constructive disbursements and receipts of such debt-like arrangements on a gross basis on the consolidated statements of cash flows within cash flows from investing activities and cash flows from financing activities, respectively.
If we are not the “deemed owner” for accounting purposes during the construction period, such lease is classified as either an operating or finance lease upon lease commencement. During the construction period and prior to lease commencement, any capital amounts contributed by us toward the construction of the leased asset (excluding normal leasehold improvements, which are recorded within property and equipment—net) are recorded as “Landlord assets under construction” within other non-current assets on the consolidated balance sheets (refer to Note 4—Prepaid Expense and Other Assets). Upon completion of the construction project, and upon lease commencement, we reclassify amounts of the construction project determined to be the landlord asset to lease right-of-use assets on the consolidated balance sheets based on the lease classification determined at lease commencement. The construction costs determined not to be part of the leased asset are classified as property and equipment—net on the consolidated balance sheets.
Sale-Leaseback Activities
We occasionally enter into sale-leaseback transactions to finance certain property acquisitions and capital expenditures, pursuant to which we sell the property to a third party and agree to lease the property back for a certain period of time. To determine whether the transfer of the property should be accounted for as a sale, we evaluate whether we have transferred control to the third party in accordance with the guidance set forth in Topic 606.
If the transfer of the asset is a sale at market terms, we recognize the transaction price for the sale based on the cash proceeds received, derecognize the carrying amount of the underlying asset and recognize a gain or loss in the consolidated statements of income for any difference between the carrying value of the asset and the transaction price. We then account for the leaseback in accordance with our lease accounting policy.
If the transfer of the asset is determined not to be a sale, we account for the transaction as a financing arrangement. We continue to present the asset within property and equipment—net on the consolidated balance sheets and recognize a non-current obligation on the consolidated balance sheets for the transaction price, with the financial liability measured in accordance with other applicable GAAP.
Intangible Assets
Intangible assets reflect the value assigned to tradenames, trademarks, domain names and other intangible assets. The cost of purchasing transferable liquor licenses in jurisdictions with a limited number of authorized liquor licenses are capitalized as an intangible asset. We do not amortize our intangible assets as we define the life of these assets as indefinite.
82 | FORM 10-K |
PART II — FINANCIAL STATEMENTS |
Impairment
Goodwill
We evaluate goodwill annually to determine whether it is impaired or whenever events occur or circumstances change that would indicate that the fair value of a reporting unit is less than its carrying amount. Conditions that may indicate impairment include, but are not limited to, a significant adverse change in customer demand or business climate that could affect the value of an asset; general economic conditions, such as increasing Treasury rates or unexpected changes in gross domestic product growth; a change in our market share; budget-to-actual performance and consistency of operating margins and capital expenditures; a product recall or an adverse action or assessment by a regulator; or changes in management or key personnel.
We perform our annual goodwill impairment testing in the fourth fiscal quarter by comparing the fair value of a reporting unit with its carrying amount, limited to the total amount of goodwill of the reporting unit. We will recognize an impairment charge for the amount by which the carrying amount exceeds the reporting unit’s fair value.
We determine fair values using the discounted cash flow approach (“income approach”) or the market multiple valuation approach (“market approach”), when available and appropriate, or a combination of both. We assess the valuation methodology based upon the relevance and availability of the data at the time we perform the valuation. If multiple valuation methodologies are used, the results are weighted appropriately.
Under the income approach, fair value is determined based on the present value of estimated future cash flows, discounted at an appropriate risk-adjusted rate. We use our internal forecasts to estimate future cash flows and include an estimate of long-term future growth rates based on our most recent views of the long-term outlook for each respective reporting unit. Actual results may differ from those assumed in our forecasts. We derive our discount rates using a capital asset pricing model and analyzing published rates for industries relevant to our reporting units to estimate the cost of equity financing. We use discount rates that are commensurate with the risks and uncertainty inherent in the respective businesses and in our internally developed forecasts.
Valuations using the market approach are derived from metrics of publicly traded companies or historically completed transactions of comparable businesses. The selection of comparable businesses is based on the markets in which the reporting units operate giving consideration to risk profiles, size, geography, and diversity of products and services. A market approach is limited to reporting units for which there are publicly traded companies that have the characteristics similar to our businesses.
Estimating the fair value of reporting units requires the use of estimates and significant judgments that are based on a number of factors including actual operating results. It is reasonably possible that the judgments and estimates described above could change in future periods.
A reporting unit is an operating segment, or a business unit one level below that operating segment for which discrete financial information is prepared and regularly reviewed by the Chief Operating Decision Maker (“CODM”), which is our Chief Executive Officer. We have deemed RH Segment and Waterworks to be the reporting units for which goodwill is independently tested, as these operating segments are the lowest level for which discrete financial information is prepared and regularly reviewed by the CODM.
RH Segment Reporting Unit
During fiscal 2021, fiscal 2020 and fiscal 2019, we reviewed the RH Segment reporting unit goodwill for impairment by assessing qualitative factors to determine whether it was more likely than not that the fair value of the reporting unit was less than its carrying amount. Based on the qualitative tests performed in each fiscal year, we determined that it was not more likely than not that the fair value of the reporting unit was less than its carrying amount for fiscal 2021, fiscal 2020 and fiscal 2019, and therefore we did not recognize goodwill impairment with respect to the RH Segment in any such fiscal year.
Waterworks Reporting Unit
The Waterworks reporting unit goodwill of $
PART II — FINANCIAL STATEMENTS |
FORM 10-K | 83 |
Tradenames, Trademarks and Other Intangible Assets
We annually evaluate whether tradenames, trademarks and other intangible assets continue to have an indefinite life. Intangible assets are reviewed for impairment annually in the fourth quarter and may be reviewed more frequently if indicators of impairment are present. Conditions that may indicate impairment include, but are not limited to, a significant adverse change in customer demand or business climate that could affect the value of an asset, a product recall or an adverse action or assessment by a regulator.
We qualitatively assess indefinite-lived intangible assets to determine whether it is more likely than not that the fair value of the asset is less than its carrying amount. If tradenames, trademarks and other intangible assets are not qualitatively assessed or if such intangible assets are qualitatively assessed and it is determined it is more likely than not that the asset’s fair value is less than its carrying amount, an impairment review is performed by comparing the carrying value to the estimated fair value, determined using a discounted cash flow methodology, which requires judgments that may significantly affect the ending asset valuation. Factors used in the valuation of intangible assets with indefinite lives include, but are not limited to, our plans for future operations, brand initiatives, recent results of operations and projected future cash flows.
In the event we quantitatively assess a reporting unit’s indefinite-lived intangible asset for impairment, we perform an impairment test which utilizes the discounted cash flow methodology under the relief-from-royalty method. Under the relief-from-royalty method, significant assumptions include the forecasted future revenues and the estimated royalty rate, expressed as a percentage of revenues.
RH Segment Reporting Unit
During the fourth quarters of fiscal 2021, fiscal 2020 and fiscal 2019, we qualitatively assessed the indefinite-lived intangible assets of the RH Segment reporting unit for impairment and determined it was not more likely than not that the fair value of the assets were less than their carrying amounts. Based on the qualitative tests performed in each fiscal year, we did not perform quantitative impairment tests in any year. We did not recognize any impairment with respect to intangible assets for the RH Segment reporting unit in fiscal 2021, fiscal 2020 and fiscal 2019.
Waterworks Reporting Unit
During the fourth quarter of fiscal 2019, we performed our annual impairment procedures on the Waterworks tradename utilizing the discounted cash flow methodology under the relief-from-royalty method. Under the relief-from-royalty method, our significant assumptions include the forecasted future revenues and the estimated royalty rate, expressed as a percentage of revenues. Based on the quantitative impairment test performed, we did not recognize any impairment with respect to the Waterworks reporting unit tradename.
During the first quarter of fiscal 2020, as a result of the COVID-19 health crisis and related temporary showroom closures, we updated the long-term financial projections for the Waterworks reporting unit which resulted in a significant decrease in forecasted revenues and profitability. We performed an interim impairment test on the Waterworks tradename and the estimated future cash flows of the Waterworks reporting unit indicated the fair value of the tradename asset was below its carrying amount. We determined fair value utilizing a discounted cash flow methodology under the relief-from-royalty method. Significant assumptions under this method include forecasted net revenues and the estimated royalty rate, expressed as a percentage of revenues, in addition to the discount rate based on the weighted-average cost of capital. Based on the impairment test performed, we concluded that the Waterworks tradename was impaired as of May 2, 2020. As a result, we recognized a $
During the fourth quarters of fiscal 2021 and fiscal 2020, we performed a qualitative impairment test on the Waterworks tradename and determined it was not more likely than not that the fair value of the asset was less than its carrying amount. Accordingly, we did not recognize any further impairment with respect to the Waterworks reporting unit tradename in either period. The carrying value of the Waterworks indefinite-lived tradename asset as of both January 29, 2022 and January 30, 2021 was $
84 | FORM 10-K |
PART II — FINANCIAL STATEMENTS |
Long-Lived Assets
Long-lived assets, such as property and equipment and lease right-of-use assets, are reviewed for impairment whenever events or changes in circumstances indicate that the carrying amount of an asset may not be recoverable. Conditions that may indicate impairment include, but are not limited to, a significant adverse change in customer demand or business climate that could affect the value of an asset, change in intended use of an asset, a product recall or an adverse action or assessment by a regulator. If the sum of the estimated undiscounted future cash flows over the remaining life of the primary asset is less than the carrying value, we recognize a loss equal to the difference between the carrying value and the fair value, usually determined by the estimated discounted cash flow analysis of the asset or asset group. The asset group is defined as the lowest level for which identifiable cash flows are available and largely independent of the cash flows of other groups of assets, which for the stores is the individual Gallery level.
Since there is typically no active market for our long-lived assets, we estimate fair values based on the expected future cash flows of the asset or asset group, using a discount rate commensurate with the related risk. The estimate of fair value requires judgments that may significantly affect the ending asset valuation. Future cash flows are estimated based on Gallery-level historical results, current trends, and operating and cash flow projections. Our estimates are subject to uncertainty and may be affected by a number of factors outside of our control, including general economic conditions and the competitive environment. While we believe our estimates and judgments about future cash flows are reasonable, future impairment charges may be required if the expected cash flow estimates, as projected, do not occur or if events change requiring us to revise our estimates.
We also review our capital expenditures for Galleries under construction and recognize impairment charges when there is a change in the intended use of an asset, including asset disposals. We recognized long-lived asset impairment charges related to such construction expenditures of $
During the first quarter of fiscal 2020, as a result of the COVID-19 health crisis and related temporary retail location closures, we performed an impairment review of long-lived assets at the individual retail location level. As a result of such analysis, we recognized long-lived asset impairment charges of $
Due to certain distribution center closures and business line integrations in fiscal 2019, we recorded impairment for certain corporate assets and other long-lived assets as discussed below under “Distribution Center and Home Delivery Location Center Closures” and “RH Contemporary Art Impairment.”
Distribution Center and Home Delivery Location Center Closures
In fiscal 2019, we initiated and executed a plan to consolidate certain of our home delivery location centers. We recorded operating lease right-of-use asset impairment associated with this effort of $
RH Contemporary Art Impairment
In fiscal 2016, we initiated and executed a plan to integrate the RH Contemporary Art (“RHCA”) product line into the broader RH platform and no longer operates RHCA as a separate division. We recorded additional operating lease right-of-use asset impairment associated with RHCA of $
PART II — FINANCIAL STATEMENTS |
FORM 10-K | 85 |
Equity Method Investments
Our consolidated financial statements present the results of operations and the financial position of RH and subsidiaries in which we have a controlling financial interest as if the consolidated group were a single economic entity. When we have a variable interest in another legal entity, we evaluate whether that legal entity is within the scope of the variable interest entity (“VIE”) model and, if so, whether we are the primary beneficiary of the VIE. We evaluate a legal entity for consolidation under the VIE model if no scope exceptions apply and, by design, the total equity investment at risk is not sufficient to permit the legal entity to finance its activities without additional subordinated financial support or, as a group, the holders of the equity investment at risk lack any of the characteristics of a controlling financial interest.
We consolidate a VIE if our involvement indicates that we are the primary beneficiary. We would be the primary beneficiary of a VIE if we have both (i) the power to direct the activities of the VIE that most significantly impact the VIE’s economic performance and (ii) the obligation to absorb losses or the right to receive benefits of the VIE that could potentially be significant to the VIE. The determination of the power to direct the activities that most significantly impact economic performance requires judgement and is impacted by numerous factors including the purpose of the VIE, contractual rights and obligations of the variable interest holders, and mechanisms for the resolution of disputes among the variable interest holders. We account for investments under the equity method of accounting when we are not the primary beneficiary with a controlling financial interest but we have significant influence over the operations of the investee. In evaluating if we exert control or significant influence we consider factors such as the terms and structure of the investment agreement and the legal structure of the investee, including investor voting or other rights, and other agreements with the investee.
During fiscal 2020, we were admitted as a non-managing member in three privately-held limited liability companies (each, an “Aspen LLC” and collectively, the “Aspen LLCs” or the “equity method investments”) that have the purpose of acquiring, developing, operating, and selling certain real estate projects in Aspen, Colorado. The Aspen LLCs are financed by capital contributions from the members on an as-needed basis, as well as via third-party debt secured by the underlying real estate projects. Each Aspen LLC is designed to require future additional subordinated financial support to finance its activities and thus is qualitatively determined to be a VIE due to insufficient equity investment at risk. The decisions of each Aspen LLC are made by a managing member not under common control with us, and we hold consent rights with respect to certain major decisions that represent some, but not all, of the most significant activities of each Aspen LLC. As we are not the managing member and do not have the ability to liquidate the Aspen LLCs or otherwise remove the managing member, we do not have the power to direct the most significant activities of each Aspen LLC and therefore are not the primary beneficiary.
Each Aspen LLC maintains a specific ownership account for each member, similar to a partnership capital account structure. We account for our investments in the Aspen LLCs using the equity method of accounting because we do not have a controlling financial interest but have the ability to exercise significant influence over the Aspen LLCs. Our investments are presented as equity method investments on the consolidated balance sheets and our proportionate share of earnings or losses of the Aspen LLCs are included in share of equity method investments losses on the consolidated statements of income. We did not elect the fair value option and the equity method investments are initially measured at cost.
As of our initial investment date, we determine the fair value of the underlying assets and liabilities held by the Aspen LLCs for purposes of determining whether or not we have basis differences arising in connection with our investment. The determination of fair value of the underlying real estate assets requires subjectivity and estimates, including the use of various valuation techniques and Level 3 inputs, such as market price per square foot and assumed capitalization rates or the replacement cost of the assets, where applicable. If specialized expertise is required we obtain independent third-party appraisals to determine the fair value of the underlying assets and liabilities. While determining fair value requires a variety of input assumptions and judgment, we believe our estimates of fair value are reasonable.
The carrying amount of our investments in the Aspen LLCs differs from our underlying equity in the net assets of the Aspen LLCs, resulting in equity method basis differences upon our investment, related to the real estate assets. We account for these basis differences as if the Aspen LLCs were consolidated subsidiaries, thereby affecting the determination of the amount of our share of earnings or losses of the equity method investments.
86 | FORM 10-K |
PART II — FINANCIAL STATEMENTS |
The operating agreements for each Aspen LLC specifies distributions from operations and upon liquidation that may be disproportionate to the members’ relative ownership percentages. Distributions are made to the members in proportion to, and in repayment of, various categories of capital contributions plus certain preferred returns, after which distributions are made to the members in proportion to their membership interests. To reflect the substance of these arrangements, we measure our proportionate share of the earnings or losses of each Aspen LLC using the hypothetical liquidation at book value (“HLBV”) method, which is a balance sheet oriented approach to determining our share of earnings or losses of the equity method investments that reflects changes in our claims to the net assets of each Aspen LLC. Due to the presence of basis differences and liquidation preferences, we use the recast financial statements approach in applying the HLBV method whereby we recast the financial statements of each Aspen LLC to reflect our perspective or basis (thus eliminating the basis differences) when determining our share of the Aspen LLCs earnings or losses. Our proportionate share of earnings or losses of the equity method investments follow the Aspen LLCs’ distribution priorities, which may change upon the achievement of certain investment return thresholds. Our equity method investment balance is subsequently adjusted for our share of the Aspen LLCs’ earnings and losses, cash contributions and distributions.
We evaluate our equity method investments for impairment whenever events or changes in circumstances indicate that the carrying amounts of such investments may not be recoverable. The difference between the carrying value of the equity method investment and its estimated fair value is recognized as an impairment charge when the loss in value is deemed other than temporary.
Deferred Financing Fees and Debt Issuance Costs
Deferred financing fees related to the asset based credit facility are included in other non-current assets on the consolidated balance sheets and are amortized utilizing the straight-line method. Debt issuance costs are recorded as a contra-liability and are presented net against the respective debt balance on the consolidated balance sheets and are amortized utilizing the effective interest method over the expected life of the respective debt. Amortization of deferred financing fees and debt issuance costs are included in interest expense—net on the consolidated statements of income.
Revenue Recognition
We recognize revenues and the related cost of goods sold when a customer obtains control of the merchandise, which is when the customer has the ability to direct the use of and obtain the benefits from the merchandise. Revenue recognized for merchandise delivered via the home-delivery channel is recognized upon delivery. Revenues recognized for merchandise delivered via all other delivery channels are recognized upon shipment. Revenues from “cash-and-carry” store sales are recognized at the point of sale in the store. Discounts or other accommodations provided to customers are accounted for as a reduction of net revenues on the consolidated statements of income.
We recognize shipping and handling fees as activities to fulfill the promise to transfer the merchandise to customers. We apply this policy consistently across all of our distribution channels. In instances where revenue is recognized for the related merchandise upon delivery to customers, the related costs of shipping and handling activities are accrued for in the same period. In instances where revenue is recognized for the related merchandise prior to delivery to customers (i.e., revenue recognized upon shipment), the related costs of shipping and handling activities are accrued for in the same period. Costs of shipping and handling are included in cost of goods sold on the consolidated statements of income.
Sales tax collected is not recognized as revenue but is included in accounts payable and accrued expenses on the consolidated balance sheets as it is ultimately remitted to governmental authorities.
Our customers may return purchased items for a refund. Projected merchandise returns, which are often resalable merchandise, are reserved on a gross basis based on historical return rates. The allowance for sales returns is presented within other current liabilities and the estimated value of the right of return asset for merchandise is presented within prepaid expense and other assets on the consolidated balance sheets.
Merchandise exchanges of the same product and price are not considered merchandise returns and, therefore, are excluded when calculating the sales returns reserve.
PART II — FINANCIAL STATEMENTS |
FORM 10-K | 87 |
A summary of the allowance for sales returns is as follows (in thousands):
|
YEAR ENDED |
||||||||
|
JANUARY 29, |
|
JANUARY 30, |
|
FEBRUARY 1, |
||||
|
2022 |
|
2021 |
|
2020 |
||||
Balance at beginning of fiscal year |
$ |
|
$ |
|
$ |
|
|||
Provision for sales returns |
|
|
|
|
|
|
|||
Actual sales returns |
|
( |
|
( |
|
( |
|||
Balance at end of fiscal year |
$ |
|
$ |
|
$ |
|
|||
Deferred Revenue and Customer Deposits
We defer revenue associated with merchandise delivered via the home-delivery channel, which is included as deferred revenue and customer deposits on the consolidated balance sheets while in-transit, in instances where we recognize revenue when the merchandise is delivered to customers. Deferred revenue also includes the unrecognized portion of the annual RH Members Program fee. New membership fees are recorded as deferred revenue when collected from customers and recognized as revenue based on expected product revenues over the annual membership period, based on historical trends of sales to members. Membership renewal fees are recorded as deferred revenue when collected from customers and are recognized as revenue on a straight-line basis over the membership period, or
Customer deposits represent payments made by customers on custom orders. At the time of purchase we collect deposits for all custom orders equivalent to
We expect that substantially all of the deferred revenue and customer deposits as of January 29, 2022 will be recognized within the next six months as the performance obligations are satisfied, and membership fees will be recognized over the membership period.
Gift Cards
We sell gift cards to our customers in our stores and through our websites and product catalogs. Such gift cards and merchandise credits do not have expiration dates. We defer revenue when cash payments are received in advance of performance for unsatisfied obligations related to our gift cards. During fiscal 2021, fiscal 2020 and fiscal 2019, we recognized $
We recognize breakage associated with gift cards proportional to actual gift card redemptions. Breakage of $
We expect that approximately
Self-Insurance
We maintain insurance coverage for significant exposures as well as those risks that, by law, must be insured. In the case of our health care coverage for employees, we have a managed self-insurance program related to claims filed. Expenses related to this self-insured program are computed on an actuarial basis, based on claims experience, regulatory requirements, an estimate of claims incurred but not yet reported (“IBNR”) and other relevant factors. The projections involved in this process are subject to uncertainty related to the timing and amount of claims filed, levels of IBNR, fluctuations in health care costs and changes to regulatory requirements. We had liabilities of $
We carry workers’ compensation insurance subject to a deductible amount for which we are responsible on each claim. We had liabilities of $
88 | FORM 10-K |
PART II — FINANCIAL STATEMENTS |
Stock-Based Compensation
We recognize the fair value of stock-based awards as compensation expense over the requisite service period and include the expense within selling, general and administrative expenses on the consolidated statements of income.
For service-only awards, compensation expense is recognized on a straight-line basis, net of forfeitures, over the requisite service period for the fair value of awards that actually vest. Fair value for restricted stock units is valued using the closing price of our stock on the date of grant. The fair value of each option award granted under our award plan is estimated on the date of grant using a Black-Scholes Merton option pricing model (“OPM”) which requires the input of assumptions regarding the expected term, expected volatility, dividend yield and risk-free interest rate. We elected to calculate the expected term of the option awards using the “simplified method.” This election was made based on the lack of sufficient historical exercise data to provide a reasonable basis upon which to estimate expected term. Under the “simplified” calculation method, the expected term is calculated as an average of the vesting period and the contractual life of the options.
For awards with performance-based criteria, compensation expense is recognized on an accelerated basis over the requisite service period. The fair value of each performance-based option award granted is estimated on the date of grant using a Monte Carlo simulation option pricing model that requires the input of subjective assumptions regarding the future exercise behavior, expected volatility and a discount for illiquidity. We determined these assumptions based on consideration of (i) future exercise behavior based on the historical observed exercise pattern of the award recipient, (ii) expected volatility based on our historical observed common stock prices measured over the full trading history of our common stock and implied volatility based on 180-day average trading prices of our common stock, and (iii) a discount for illiquidity estimated using the Finnerty method.
Cost of Goods Sold
Cost of goods sold includes, but is not limited to, the direct cost of purchased merchandise, inventory reserves and write-downs, inventory shrinkage, inbound freight, all freight costs to get merchandise to our retail and outlet locations, design and buying costs, occupancy costs related to retail operations and supply chain, such as rent, utilities, depreciation and amortization and all logistics costs associated with shipping product to customers, property tax and common area maintenance.
Selling, General and Administrative Expenses
Selling, general and administrative expenses include all operating costs not included in cost of goods sold. These expenses include payroll and payroll-related expenses, retail related expenses other than occupancy, and the expense related to the operations at our corporate headquarters, including rent, utilities, depreciation and amortization, credit card fees and marketing expense, which primarily includes catalog production, mailing and print advertising costs. All retail pre-opening costs are included in selling, general and administrative expenses and are expensed as incurred.
Net Income Per Share
Basic net income per share is computed as net income divided by the weighted-average number of common shares outstanding for the period. Diluted net income per share is computed as net income divided by the weighted-average number of common shares outstanding for the period, common share equivalents under equity plans using the treasury-stock method and the calculated common share equivalents in excess of the respective conversion rates related to each of the convertible senior notes. Potential dilutive securities are excluded from the computation of diluted net income per share if their effect is anti-dilutive.
Treasury Stock
We record our purchases of treasury stock at cost as a separate component of stockholders’ equity (deficit) in the consolidated financial statements. Upon retirement of treasury stock, we allocate the excess of the purchase price over par value to additional paid-in capital subject to certain limitations with any remaining purchase price allocated to retained earnings (accumulated deficit).
PART II — FINANCIAL STATEMENTS |
FORM 10-K | 89 |
Income Taxes
We account for income taxes under an asset and liability approach that requires the recognition of deferred tax assets and liabilities for the expected future tax consequences of events that have been recognized in our consolidated financial statements or tax returns. In estimating future tax consequences, we generally take into account all expected future events then known to it, other than changes in the tax law or rates which have not yet been enacted and which are not permitted to be considered. Accordingly, we may record a valuation allowance to reduce our net deferred tax assets to the amount that is more-likely-than-not to be realized. The determination as to whether a deferred tax asset will be realized is made on a jurisdictional basis and is based upon our best estimate of the recoverability of our net deferred tax assets. Future taxable income and ongoing prudent and feasible tax planning are considered in determining the amount of the valuation allowance, and the amount of the allowance is subject to adjustment in the future. Specifically, in the event we were to determine that it is not more-likely-than-not able to realize our net deferred tax assets in the future, an adjustment to the valuation allowance would decrease income in the period such determination is made. This allowance does not alter our ability to utilize the underlying tax net operating loss and credit carryforwards in the future, the utilization of which is limited to achieving future taxable income.
The accounting standard for uncertainty in income taxes prescribes a recognition threshold that a tax position is required to meet before being recognized in the financial statements and provides guidance on derecognition, measurement, classification, interest and penalties, accounting in interim periods, disclosure and transition issues. Differences between tax positions taken in a tax return and amounts recognized in the financial statements generally result in an increase in liability for income taxes payable or a reduction of an income tax refund receivable, or a reduction in a deferred tax asset or an increase in a deferred tax liability, or both. We recognize interest and penalties related to unrecognized tax benefits in income tax expense on the consolidated statements of income.
Foreign Currency Matters
The functional currency of our foreign subsidiaries is generally the local currency of the country in which the subsidiary operates. Assets and liabilities of the foreign subsidiaries denominated in non-U.S. dollar currencies are translated at the rate of exchange prevailing on the date of the consolidated balance sheets, and revenues and expenses are translated at average rates of exchange for the period. The related translation gains (losses) are reflected in the accumulated other comprehensive income section on the consolidated statements of stockholders’ equity (deficit), and net gains (losses) on foreign currency translation, which includes intercompany gains and losses, is presented net of tax on the consolidated statements of comprehensive income. Transaction gains and losses resulting from intercompany balances of a long-term investment nature are also classified as accumulated other comprehensive income on the consolidated balance sheets.
Foreign currency gains (losses) resulting from foreign currency transactions denominated in a currency other than the subsidiary's functional currency are included in other expense—net on the consolidated statements of income. Such foreign exchange gains and losses are due to the net impact of changes in foreign exchange rates as compared to the U.S. dollar from our third-party transactions denominated in foreign currencies, and intercompany loans held in U.S. dollars by our international subsidiaries other than those of a long-term investment nature, where repayment is not planned or anticipated in the foreseeable future. The foreign exchange gains or losses arising on the revaluation of intercompany loans of a long-term investment nature are reported within accumulated other comprehensive income on the consolidated balance sheets.
Recently Issued Accounting Standards
New Accounting Standards or Updates Adopted
Income Taxes
In December 2019, the Financial Accounting Standards Board (“FASB”) issued Accounting Standards Update (“ASU”) 2019-12—Income Taxes (Topic 740): Simplifying the Accounting for Income Taxes. The ASU impacts various topic areas within ASC 740, including accounting for taxes under hybrid tax regimes, accounting for increases in goodwill, allocation of tax amounts to separate company financial statements within a group that files a consolidated tax return, intra period tax allocation, interim period accounting, and accounting for ownership changes in investments, among other minor codification improvements. The guidance in this ASU became effective for fiscal years, and interim periods within those fiscal years, beginning after December 15, 2020. We adopted this standard in the first quarter of fiscal 2021 and the adoption did not have an impact on our consolidated financial statements.
90 | FORM 10-K |
PART II — FINANCIAL STATEMENTS |
New Accounting Standards or Updates Not Yet Adopted
Convertible Instruments and Contracts in an Entity’s Own Equity
In August 2020, the FASB issued ASU 2020-06—Accounting for Convertible Instruments and Contracts in an Entity’s Own Equity. The ASU simplifies the accounting for certain financial instruments with characteristics of liabilities and equity, including convertible instruments and contracts in an entity’s own equity. Specifically, the ASU removes the separation models for convertible debt with a cash conversion feature or convertible instruments with a beneficial conversion feature. As a result, after adopting the ASU’s guidance, we will not separately present in equity an embedded conversion feature of such debt. Instead, we will account for a convertible debt instrument wholly as debt unless (i) a convertible instrument contains features that require bifurcation as a derivative or (ii) a convertible debt instrument was issued at a substantial premium. Additionally, the ASU removes certain conditions for equity classification related to contracts in an entity’s own equity (e.g., warrants) and amends certain guidance related to the computation of earnings per share for convertible instruments and contracts on an entity’s own equity.
We will adopt the ASU in the first quarter of fiscal 2022 using a modified retrospective approach. We anticipate that the adoption of the ASU will impact our consolidated financial statements through the cumulative effect of initially applying the ASU as an adjustment to the opening balance of retained earnings on the consolidated balance sheets of approximately $
Reference Rate Reform
In March 2020, the FASB issued ASU 2020-04—Reference Rate Reform (Topic 848): Facilitation of the Effects of Reference Rate Reform on Financial Reporting. In January 2021, the FASB issued ASU 2021-01—Reference Rate Reform (Topic 848): Scope, together with ASU 2020-04 the “ASUs”. The ASUs provide optional expedients and exceptions, if certain criteria are met, for applying U.S. GAAP to contracts, hedging relationships, and other transactions affected by the expected market transition from the London Interbank Offered Rate (“LIBOR”) and other interbank offered rates to alternative reference rates, such as the Secured Overnight Financing Rate (“SOFR”). These transactions include contract modifications, hedge accounting, and the sale or transfer of debt securities classified as held-to-maturity. The primary contracts for which we currently use LIBOR include our asset based credit facility and term loan debt arrangements. The guidance was effective upon issuance and allows entities to adopt the amendments on a prospective basis through December 31, 2022, when the reference rate replacement activity is expected to be completed. We are evaluating the impact that the ASUs will have on our consolidated financial statements and related disclosures, including the timing of adoption, and do not believe the adoption will materially impact our financial condition, results of operations or cash flows.
PART II — FINANCIAL STATEMENTS |
FORM 10-K | 91 |
NOTE 4—PREPAID EXPENSE AND OTHER ASSETS
Prepaid expense and other current assets consist of the following (in thousands):
|
|
JANUARY 29, |
|
JANUARY 30, |
||
|
2022 |
2021 |
||||
Prepaid expense and other current assets |
$ |
|
$ |
|
||
Capitalized catalog costs |
|
|
|
|
||
Vendor deposits |
|
|
||||
Tenant allowance receivable |
|
|
||||
Promissory notes receivable, including interest (1) |
|
|
|
|
||
Right of return asset for merchandise |
|
|
|
|
||
Acquisition related escrow deposits |
|
|
||||
Total prepaid expense and other current assets |
$ |
|
$ |
|
||
| (1) | Represents promissory notes, including principal and accrued interest, due from a related party. Refer to Note 8—Equity Method Investments. |
Other non-current assets consist of the following (in thousands):
|
|
JANUARY 29, |
|
JANUARY 30, |
||
|
2022 |
2021 |
||||
Landlord assets under construction—net of tenant allowances |
$ |
|
$ |
|
||
Initial direct costs prior to lease commencement |
|
|
|
|||
Capitalized cloud computing costs—net (1) |
|
|
||||
Other deposits |
|
|
|
|
||
Deferred financing fees |
|
|
|
|
||
Other non-current assets |
|
|
|
|
||
Acquisition related escrow deposits |
— |
|
||||
Total other non-current assets |
$ |
|
$ |
|
||
| (1) |
Presented net of accumulated amortization of $ |
92 | FORM 10-K |
PART II — FINANCIAL STATEMENTS |
NOTE 5—PROPERTY AND EQUIPMENT
Property and equipment consists of the following (in thousands):
|
JANUARY 29, |
|
JANUARY 30, |
|||
2022 |
2021 |
|||||
Finance lease right-of-use assets (1) |
$ |
|
$ |
|
||
Leasehold improvements (2) |
|
|
||||
Computer software |
|
|
|
|
||
Furniture, fixtures and equipment |
|
|
|
|
||
Machinery, equipment and aircraft |
|
|
|
|
||
Building and building improvements (3) |
|
|
|
|
||
Built-to-suit property |
|
|
||||
Land |
|
|
|
|
||
Total property and equipment |
|
|
|
|
||
Less—accumulated depreciation and amortization (4) |
|
( |
|
( |
||
Total property and equipment—net |
$ |
|
$ |
|
||
| (1) | Refer to “Lease Accounting” within Note 3—Significant Accounting Policies and Note 11—Leases. |
| (2) |
Leasehold improvements include construction in progress of $ |
| (3) |
Building and building improvements as of January 29, 2022 and January 30, 2021 includes $ |
| (4) |
Includes accumulated amortization related to finance lease right-of-use assets of $ |
We recorded depreciation and amortization of property and equipment, excluding amortization for finance lease right-of-use assets, of $
NOTE 6—BUSINESS COMBINATIONS
On August 28, 2020, we acquired a business for total consideration of $
On December 7, 2020, we acquired the net assets of a business for $
We believe that these additions to the RH platform further position us as a leader in the luxury design market as we continue to enhance the RH product assortment.
During fiscal 2020, we incurred acquisition-related costs associated with these transactions such as financial, legal and accounting advisors, as well as employment related costs, which are included in selling, general and administrative expenses on the consolidated statements of income.
Acquisition related escrow deposits, included within prepaid expense and other current assets and other non-current assets on the consolidated balance sheets, were $
PART II — FINANCIAL STATEMENTS |
FORM 10-K | 93 |
The following table summarizes the purchase price allocation based on the fair value of the assets acquired and liabilities assumed (in thousands):
Goodwill |
$ |
|
|
Tradename |
|
||
Tangible assets acquired and liabilities assumed—net |
( |
||
Total |
$ |
|
The tradename has been assigned an indefinite life and therefore is not subject to amortization. The goodwill, included in the RH Segment, is representative of the benefits and expected synergies from the integration of the acquired companies’ products, leadership team and employees, which do not qualify for separate recognition as an intangible asset. The tradename and goodwill are deductible for tax purposes.
Results of operations of the acquired companies have been included in our consolidated statements of income since their respective acquisition dates. Pro forma results of the acquired businesses have not been presented as the results were not considered material to our consolidated financial statements for all periods presented and would not have been material had the acquisitions occurred at the beginning of fiscal 2020.
NOTE 7—GOODWILL, TRADENAMES, TRADEMARKS AND OTHER INTANGIBLE ASSETS
The following sets forth the fiscal 2021 goodwill, tradenames, trademarks and other intangible assets activity for the RH Segment and Waterworks (in thousands):
|
|
|
|
FOREIGN |
|
|||||||
|
JANUARY 30, |
CURRENCY |
JANUARY 29, |
|||||||||
|
2021 |
ADDITIONS |
TRANSLATION |
2022 |
||||||||
RH Segment |
|
|
|
|
|
|
|
|
||||
Goodwill |
$ |
|
$ |
— |
$ |
— |
$ |
|
||||
Tradenames, trademarks and other intangible assets |
|
|
|
|
|
— |
|
|
||||
Waterworks |
|
|
|
|
|
|
||||||
Tradename |
|
|
|
— |
|
— |
|
|
||||
The following sets forth the fiscal 2020 goodwill, tradenames, trademarks and other intangible assets activity for the RH Segment and Waterworks (in thousands):
FOREIGN |
|||||||||||||||
FEBRUARY 1, |
CURRENCY |
JANUARY 30, |
|||||||||||||
|
2020 |
|
ACQUISITION |
|
IMPAIRMENT |
|
TRANSLATION |
|
2021 |
||||||
RH Segment |
|
|
|
|
|
|
|
|
|
|
|||||
Goodwill |
$ |
|
$ |
|
$ |
— |
$ |
|
$ |
|
|||||
Tradenames, trademarks and other intangible assets |
|
|
|
|
|
— |
|
— |
|
|
|||||
Waterworks (1) |
|
|
|
|
|
|
|
|
|
|
|||||
Tradename (2) |
|
|
|
— |
|
( |
|
— |
|
|
|||||
| (1) |
Waterworks reporting unit goodwill of $ |
| (2) |
Presented net of an impairment charge of $ |
94 | FORM 10-K |
PART II — FINANCIAL STATEMENTS |
NOTE 8—EQUITY METHOD INVESTMENTS
Equity method investments represent our
In fiscal 2020, we contributed capital of $
In fiscal 2021, we purchased an additional
As of January 29, 2022 and January 30, 2021, $
The carrying amount of our investments in the Aspen LLCs differs from our underlying equity in the net assets of the Aspen LLCs, resulting in equity method basis differences upon our investment. We account for these basis differences as if the Aspen LLCs were consolidated subsidiaries, thereby affecting the determination of the amount of our share of earnings or losses of the equity method investments.
During fiscal 2021 and fiscal 2020, we recorded our proportionate share of equity method investments losses of $
PART II — FINANCIAL STATEMENTS |
FORM 10-K | 95 |
NOTE 9—ACCOUNTS PAYABLE, ACCRUED EXPENSES AND OTHER CURRENT LIABILITIES
Accounts payable and accrued expenses consist of the following (in thousands):
|
|
JANUARY 29, |
|
JANUARY 30, |
||
|
2022 |
2021 |
||||
Accounts payable |
$ |
|
$ |
|
||
Accrued compensation |
|
|
|
|
||
Accrued occupancy |
|
|
|
|
||
Accrued sales taxes |
|
|
|
|
||
Accrued freight and duty |
|
|
|
|
||
Accrued professional fees |
|
|
|
|
||
Accrued catalog costs |
|
|
|
|
||
Other accrued expenses |
|
|
|
|
||
Deferred consideration for asset purchase |
— |
|
||||
Total accounts payable and accrued expenses |
$ |
|
$ |
|
||
Other current liabilities consist of the following (in thousands):
|
|
JANUARY 29, |
|
JANUARY 30, |
||
|
2022 |
2021 |
||||
Federal and state tax payable |
$ |
|
$ |
|
||
Allowance for sales returns |
|
|
||||
Unredeemed gift card and merchandise credit liability |
|
|
|
|
||
Current portion of term loan |
|
— |
||||
Finance lease liabilities |
|
|
||||
Current portion of equipment promissory notes |
|
|
||||
Other current liabilities |
|
|
|
|
||
Total other current liabilities |
$ |
|
$ |
|
||
NOTE 10—OTHER NON-CURRENT OBLIGATIONS
Other non-current obligations consist of the following (in thousands):
|
|
JANUARY 29, |
|
JANUARY 30, |
||
|
2022 |
2021 |
||||
Unrecognized tax benefits |
$ |
|
$ |
|
||
Non-current portion of equipment promissory notes—net |
|
|
||||
Other non-current obligations |
|
|
|
|
||
Deferred payroll taxes |
— |
|
||||
Total other non-current obligations |
$ |
|
$ |
|
||
96 | FORM 10-K |
PART II — FINANCIAL STATEMENTS |
NOTE 11—LEASES
Lease costs—net consist of the following (in thousands):
|
YEAR ENDED |
||||||||
JANUARY 29, |
|
JANUARY 30, |
|
FEBRUARY 1, |
|||||
|
2022 |
|
2021 |
|
2020 |
||||
Operating lease cost (1) |
|
$ |
|
$ |
|
$ |
|
||
Finance lease costs |
|||||||||
Amortization of leased assets (1) |
|
|
|
||||||
Interest on lease liabilities (2) |
|
|
|
||||||
Variable lease costs (3) |
|
|
|
||||||
Sublease income (4) |
( |
( |
( |
||||||
Total lease costs—net |
$ |
|
$ |
|
$ |
|
|||
| (1) | Operating lease costs and amortization of finance lease right-of-use assets are included in cost of goods sold or selling, general and administrative expenses on the consolidated statements of income based on our accounting policy. Refer to Note 3—Significant Accounting Policies. |
| (2) | Included in interest expense—net on the consolidated statements of income. |
| (3) |
Represents variable lease payments under operating and finance lease agreements, primarily associated with contingent rent based on a percentage of retail sales over contractual levels of $ |
| (4) | Included as an offset to selling, general and administrative expenses on the consolidated statements of income. |
Lease right-of-use assets and lease liabilities consist of the following (in thousands):
JANUARY 29, |
JANUARY 30, |
|||||||
|
2022 |
|
2021 |
|||||
Balance Sheet Classification |
||||||||
Assets |
||||||||
Operating leases |
$ |
|
$ |
|
||||
Finance leases (1)(2) |
|
|
||||||
Total lease right-of-use assets |
$ |
|
$ |
|
||||
Liabilities |
||||||||
Current (3) |
||||||||
Operating leases |
$ |
|
$ |
|
||||
Finance leases |
|
|
||||||
Total lease liabilities—current |
|
|
||||||
Non-current |
||||||||
Operating leases |
|
|
||||||
Finance leases |
|
|
||||||
Total lease liabilities—non-current |
|
|
||||||
Total lease liabilities |
$ |
|
$ |
|
||||
| (1) | Finance lease right-of-use assets include capitalized amounts related to our completed construction activities to design and build leased assets, which are reclassified from other non-current assets upon lease commencement. |
PART II — FINANCIAL STATEMENTS |
FORM 10-K | 97 |
| (2) |
Finance lease right-of-use assets are recorded net of accumulated amortization of $ |
| (3) | Current portion of lease liabilities represents the reduction of the related lease liability over the next 12 months. |
The maturities of lease liabilities are as follows as of January 29, 2022 (in thousands):
OPERATING |
FINANCE |
||||||||||
FISCAL YEAR |
|
LEASES |
|
LEASES |
|
TOTAL |
|||||
2022 |
$ |
|
$ |
|
$ |
|
|||||
2023 |
|
|
|
||||||||
2024 |
|
|
|
||||||||
2025 |
|
|
|
||||||||
2026 |
|
|
|
||||||||
Thereafter |
|
|
|
||||||||
Total lease payments (1)(2) |
|
|
|
||||||||
Less—imputed interest (3) |
( |
( |
( |
||||||||
Present value of lease liabilities |
$ |
|
$ |
|
$ |
|
|||||
| (1) |
Total lease payments include future obligations for renewal options that are reasonably certain to be exercised and are included in the measurement of the lease liability. Total lease payments exclude $ |
| (2) |
Excludes future commitments under |
| (3) | Calculated using the discount rate for each lease at lease commencement. |
Supplemental information related to leases consists of the following:
YEAR ENDED |
||||||
JANUARY 29, |
JANUARY 30, |
|||||
2022 |
2021 |
|||||
Weighted-average remaining lease term (years) |
||||||
Operating leases |
||||||
Finance leases |
||||||
Weighted-average discount rate |
||||||
Operating leases |
||||||
Finance leases |
||||||
98 | FORM 10-K |
PART II — FINANCIAL STATEMENTS |
Other information related to leases consists of the following (in thousands):
YEAR ENDED |
|||||||||
JANUARY 29, |
JANUARY 30, |
FEBRUARY 1, |
|||||||
2022 |
2021 |
2020 |
|||||||
Cash paid for amounts included in the measurement of lease liabilities |
|||||||||
Operating cash flows from operating leases |
$ |
( |
$ |
( |
$ |
( |
|||
Operating cash flows from finance leases |
( |
( |
( |
||||||
Financing cash flows from finance leases |
( |
( |
( |
||||||
Total cash outflows from leases |
$ |
( |
$ |
( |
$ |
( |
|||
Lease right-of-use assets obtained in exchange for lease obligations—net of lease terminations (non-cash) |
|||||||||
Operating leases |
$ |
|
$ |
|
$ |
|
|||
Finance leases |
|
|
|
||||||
Build-to-Suit Asset
During fiscal 2021, we opened the Dallas Design Gallery. During the construction period of this Design Gallery, we were the “deemed owner” for accounting purposes and classified the construction costs as build-to-suit asset within property & equipment—net on our consolidated balance sheets. Upon construction completion and lease commencement, we performed a sale-leaseback analysis and determined that we cannot derecognize the build-to-suit asset. Therefore, the asset will remain classified as a build-to-suit asset within property and equipment—net and will depreciate over the term of the useful life of the asset.
Asset Held for Sale and Sale-Leaseback Transaction
During fiscal 2020, we executed a sale-leaseback transaction for the Minneapolis Design Gallery for sales proceeds of $
During fiscal 2019, we executed a sale-leaseback transaction for the Yountville Design Gallery for sales proceeds of $
PART II — FINANCIAL STATEMENTS |
FORM 10-K | 99 |
NOTE 12—CONVERTIBLE SENIOR NOTES
$
In , we issued in a private offering $
Prior to
We may not redeem the 2024 Notes; however, upon the occurrence of a fundamental change (as defined in the indenture governing the notes), holders may require us to purchase all or a portion of their 2024 Notes for cash at a price equal to
100 | FORM 10-K |
PART II — FINANCIAL STATEMENTS |
Under GAAP, certain convertible debt instruments that may be settled in cash on conversion are required to be separately accounted for as liability and equity components of the instrument in a manner that reflects the issuer’s non-convertible debt borrowing rate. Accordingly, in accounting for the issuance of the 2024 Notes, we separated the 2024 Notes into liability and equity components. The carrying amount of the liability component was calculated by measuring the fair value of a similar liability that does not have an associated convertible feature. The carrying amount of the equity component, which is recognized as a debt discount, represents the difference between the proceeds from the issuance of the 2024 Notes and the fair value of the liability component of the 2024 Notes. The excess of the principal amount of the liability component over its carrying amount (“debt discount”) will be amortized to interest expense using an effective interest rate of
Debt issuance costs related to the 2024 Notes were comprised of discounts upon original issuance of $
Discounts and third party offering costs attributable to the liability component are recorded as a contra-liability and are presented net against the convertible senior notes due 2024 balance on the consolidated balance sheets. During fiscal 2021, fiscal 2020 and fiscal 2019, we recorded $
During fiscal 2021, holders of $
During the fourth quarter of fiscal 2021, holders of $
PART II — FINANCIAL STATEMENTS |
FORM 10-K | 101 |
The carrying value of the 2024 Notes, excluding the discounts upon original issuance and third party offering costs, is as follows (in thousands):
|
|
JANUARY 29, |
|
JANUARY 30, |
||
|
2022 |
2021 |
||||
Liability component |
|
|
|
|
||
Principal |
$ |
|
$ |
|
||
Less: Debt discount |
|
( |
|
( |
||
Net carrying amount (1) |
$ |
|
$ |
|
||
Equity component |
$ |
|
$ |
|
||
| (1) | Included in additional paid-in capital on the consolidated balance sheets. |
We recorded interest expense of $
2024 Notes—Convertible Bond Hedge and Warrant Transactions
In connection with the offering of the 2024 Notes and exercise of the overallotment option in ,
We recorded a deferred tax liability of $
$
In , we issued in a private offering $
102 | FORM 10-K |
PART II — FINANCIAL STATEMENTS |
Prior to
We may not redeem the 2023 Notes; however, upon the occurrence of a fundamental change (as defined in the indenture governing the 2023 Notes), holders may require us to purchase all or a portion of their 2023 Notes for cash at a price equal to
Under GAAP, certain convertible debt instruments that may be settled in cash on conversion are required to be separately accounted for as liability and equity components of the instrument in a manner that reflects the issuer’s non-convertible debt borrowing rate. Accordingly, in accounting for the issuance of the 2023 Notes, we separated the 2023 Notes into liability and equity components. The carrying amount of the liability component was calculated by measuring the fair value of a similar liability that does not have an associated convertible feature. The carrying amount of the equity component, which is recognized as a debt discount, represents the difference between the proceeds from the issuance of the 2023 Notes and the fair value of the liability component of the 2023 Notes. The excess of the principal amount of the liability component over its carrying amount (“debt discount”) will be amortized to interest expense using an effective interest rate of
Debt issuance costs related to the 2023 Notes were comprised of discounts upon original issuance of $
Discounts and third party offering costs attributable to the liability component are recorded as a contra-liability and are presented net against the convertible senior notes due 2023 balance on the consolidated balance sheets. We recorded $
PART II — FINANCIAL STATEMENTS |
FORM 10-K | 103 |
During fiscal 2021, holders of $
During the fourth quarter of fiscal 2021, holders of $
The carrying values of the 2023 Notes, excluding the discounts upon original issuance and third party offering costs, are as follows (in thousands):
|
|
JANUARY 29, |
|
JANUARY 30, |
||
|
2022 |
2021 |
||||
Liability component |
|
|
|
|
||
Principal |
$ |
|
$ |
|
||
Less: Debt discount |
|
( |
|
( |
||
Net carrying amount (1) |
$ |
|
$ |
|
||
Equity component |
$ |
|
$ |
|
||
| (1) | Included in additional paid-in capital on the consolidated balance sheets. |
We recorded interest expense of $
2023 Notes—Convertible Bond Hedge and Warrant Transactions
In connection with the offering of the 2023 Notes and exercise of the overallotment option in ,
104 | FORM 10-K |
PART II — FINANCIAL STATEMENTS |
We recorded a deferred tax liability of $
$
In , we issued in a private offering $
Under GAAP, certain convertible debt instruments that may be settled in cash on conversion are required to be separately accounted for as liability and equity components of the instrument in a manner that reflects the issuer’s non-convertible debt borrowing rate. Accordingly, in accounting for the issuance of the 2020 Notes, we separated the 2020 Notes into liability and equity components. The carrying amount of the liability component was calculated by measuring the fair value of a similar liability that does not have an associated convertible feature. The carrying amount of the equity component, which is recognized as a debt discount, represents the difference between the proceeds from the issuance of the 2020 Notes and the fair value of the liability component of the 2020 Notes. The debt discount was amortized to interest expense using an effective interest rate of
In May 2020, $
In July 2020, upon the maturity of the 2020 Notes, the remaining $
We recorded interest expense of $
2020 Notes—Convertible Bond Hedge and Warrant Transactions
In connection with the offering of the 2020 Notes in and the exercise in full of the overallotment option in July 2015,
PART II — FINANCIAL STATEMENTS |
FORM 10-K | 105 |
As a result of the operation of the bond hedge in connection with the maturity of the 2020 Notes, we were not required to issue any new shares to settle the notes as these shares were delivered to us under the terms of the bond hedge. The bond hedge was exercised in connection with the maturity date of the 2020 Notes.
During fiscal 2020, we delivered
$
In , we issued $
In June 2019, upon the maturity of the 2019 Notes, $
We recorded interest expense of $
2019 Notes—Convertible Bond Hedge and Warrant Transactions
In connection with the offering of the 2019 Notes,
During fiscal 2019, we delivered approximately
106 | FORM 10-K |
PART II — FINANCIAL STATEMENTS |
NOTE 13—CREDIT FACILITIES
The outstanding balances under our credit facilities were as follows (in thousands):
|
JANUARY 29, |
JANUARY 30, |
||||||||||||||||
|
2022 |
2021 |
||||||||||||||||
|
UNAMORTIZED |
UNAMORTIZED |
||||||||||||||||
DEBT |
NET |
DEBT |
NET |
|||||||||||||||
OUTSTANDING |
ISSUANCE |
CARRYING |
OUTSTANDING |
ISSUANCE |
CARRYING |
|||||||||||||
|
AMOUNT |
|
COSTS |
|
AMOUNT |
|
AMOUNT |
|
COSTS |
|
AMOUNT |
|||||||
Asset based credit facility (1) |
$ |
— |
$ |
— |
$ |
— |
$ |
— |
$ |
— |
$ |
— |
||||||
Term loan credit agreement (2) |
|
( |
|
— |
— |
— |
||||||||||||
Equipment promissory notes (3) |
|
|
( |
|
|
|
|
( |
|
|
||||||||
Total credit facilities |
$ |
|
$ |
( |
$ |
|
$ |
|
$ |
( |
$ |
|
||||||
| (1) |
Deferred financing fees associated with the asset based credit facility as of January 29, 2022 and January 30, 2021 were $ |
| (2) |
Represents the Term Loan Credit Agreement (defined below), of which outstanding amounts of $ |
| (3) |
Represents total equipment security notes secured by certain of our property and equipment, of which $ |
Asset Based Credit Facility & Term Loan Facilities
On
On
On
The availability of credit at any given time under the ABL Credit Agreement will be constrained by the terms and conditions of the ABL Credit Agreement, including the amount of collateral available, a borrowing base formula based upon numerous factors, including the value of eligible inventory and eligible accounts receivable, and other restrictions contained in the ABL Credit Agreement. All obligations under the ABL Credit Agreement are secured by substantial assets of the loan parties, including inventory, receivables and certain types of intellectual property.
PART II — FINANCIAL STATEMENTS |
FORM 10-K | 107 |
Borrowings under the revolving line of credit (other than swing line loans, which are subject to interest at the base rate) bear interest, at the borrower’s option, at either the base rate or London Inter-bank Offered Rate (“LIBOR”) subject to a
The ABL Credit Agreement contains various restrictive and affirmative covenants, including required financial reporting, limitations on granting certain liens, limitations on making certain loans or investments, limitations on incurring additional debt, restricted payment limitations limiting the payment of dividends and certain other transactions and distributions, limitations on transactions with affiliates, along with other restrictions and limitations similar to those frequently found in credit agreements of a similar type and size.
The ABL Credit Agreement does not contain any significant financial ratio covenants or coverage ratio covenants other than a consolidated fixed charge coverage ratio (“FCCR”) covenant based on the ratio of (i) consolidated EBITDA to the amount of (ii) debt service costs plus certain other amounts, including dividends and distributions and prepayments of debt as defined in the ABL Credit Agreement (the “FCCR Covenant”). The FCCR Covenant only applies in certain limited circumstances, including when the unused availability under the ABL Credit Agreement drops below the greater of (A) $
The ABL Credit Agreement contains customary representations and warranties, events of defaults and other customary terms and conditions for an asset based credit facility.
The availability of the revolving line of credit at any given time under the ABL Credit Agreement is limited by the terms and conditions of the ABL Credit Agreement, including the amount of collateral available, a borrowing base formula based upon numerous factors, including the value of eligible inventory and eligible accounts receivable, and other restrictions contained in the ABL Credit Agreement. As a result, actual borrowing availability under the revolving line of credit could be less than the stated amount of the revolving line of credit (as reduced by the actual borrowings and outstanding letters of credit under the revolving line of credit). As of January 29, 2022, the amount available for borrowing under the revolving line of credit under the ABL Credit Agreement was $
Term Loan Credit Agreement
On
The Term Loan bears interest at an annual rate based on LIBOR subject to a
All obligations under the Term Loan are guaranteed by certain domestic subsidiaries of RHI. Further, RHI and such subsidiaries have granted a security interest in substantially all of their assets (subject to customary and other exceptions) to secure the Term Loan. Substantially all of the collateral securing the Term Loan also secures the loans and other credit extensions under the ABL Credit Agreement. On October 20, 2021, in connection with the Term Loan Credit Agreement, RHI and certain other subsidiaries of RH party to the Term Loan Credit Agreement and the ABL Credit Agreement, as the case may be, entered into an Intercreditor Agreement (the “Intercreditor Agreement”) with the Term Agent and the ABL Agent. The Intercreditor Agreement establishes various customary inter-lender terms, including, without limitation, with respect to priority of liens, permitted actions by each party, application of proceeds, exercise of remedies in case of default, releases of liens and certain limitations on the amendment of the ABL Credit Agreement and the Term Loan Credit Agreement without the consent of the other parties.
108 | FORM 10-K |
PART II — FINANCIAL STATEMENTS |
The borrowings under the Term Loan Credit Agreement may be prepaid in whole or in part at any time, subject to a prepayment premium of
The Term Loan Credit Agreement contains various restrictive and affirmative covenants, including required financial reporting, limitations on granting certain liens, limitations on making certain loans or investments, limitations on incurring additional debt, restricted payment limitations limiting the payment of dividends and certain other transactions and distributions, limitations on transactions with affiliates, along with other restrictions and limitations similar to those frequently found in credit agreements of a similar type and size, but provides for unlimited exceptions in the case of incurring indebtedness, granting of liens and making investments, dividend payments, and payments of material junior indebtedness, subject to satisfying specified leverage ratio tests.
The Term Loan Credit Agreement does not contain a financial maintenance covenant.
The Term Loan Credit Agreement contains customary representations and warranties, events of defaults and other customary terms and conditions for a term loan credit agreement.
Equipment Loan Facility
On September 5, 2017, Restoration Hardware, Inc. entered into a Master Loan and Security Agreement with Banc of America Leasing & Capital, LLC (“BAL”) pursuant to which BAL and we agreed that BAL would finance certain equipment of ours from time to time, with each such equipment financing to be evidenced by an equipment security note setting forth the terms for each particular equipment loan. Each equipment loan is secured by a purchase money security interest in the financed equipment. As of January 29, 2022, the equipment security notes bore interest at a weighted-average rate of
Second Lien Credit Agreement
On April 10, 2019, Restoration Hardware, Inc., entered into a credit agreement, dated as of April 9, 2019 and effective as of April 10, 2019 (the “Second Lien Credit Agreement”), among (i) Restoration Hardware, Inc., as lead borrower, (ii) the guarantors party thereto, (iii) the lenders party thereto, each of whom were managed or advised by either Benefit Street Partners L.L.C. and its affiliated investment managers or Apollo Capital Management, L.P. and its affiliated investment managers, and (iv) BSP Agency, LLC, as administrative agent and collateral agent (the “Second Lien Administrative Agent”) with respect to a second lien term loan in an aggregate principal amount equal to $
The Second Lien Term Loan bore interest at an
Intercreditor Agreement
On April 10, 2019, in connection with the Second Lien Credit Agreement, Restoration Hardware, Inc. entered into an Intercreditor Agreement (the “Intercreditor Agreement”), dated as of April 9, 2019 and effective as of April 10, 2019, with the First Lien Administrative Agent and the Second Lien Administrative Agent. The Intercreditor Agreement established various customary inter-lender terms, including, without limitation, with respect to priority of liens, permitted actions by each party, application of proceeds, exercise of remedies in case of default, releases of liens and certain limitations on the amendment of the Credit Agreement and the Second Lien Credit Agreement without the consent of the other party. The Intercreditor Agreement is no longer in effect after repayment of the Second Lien Term Loan on September 20, 2019.
PART II — FINANCIAL STATEMENTS |
FORM 10-K | 109 |
NOTE 14—FAIR VALUE MEASUREMENTS
Certain financial assets and liabilities are required to be carried at fair value. Fair value is the price that would be received to sell an asset, or paid to transfer a liability, in an orderly transaction between market participants at the measurement date. In determining the fair value, we utilize market data or assumptions that we believe market participants would use in pricing the asset or liability, which would maximize the use of observable inputs and minimize the use of unobservable inputs to the extent possible, including assumptions about risk and the risks inherent in the inputs of the valuation technique.
The degree of judgment used in measuring the fair value of financial instruments generally correlates to the level of pricing observability. Pricing observability is impacted by a number of factors, including the type of financial instrument, whether the financial instrument is new to the market and not yet established and the characteristics specific to the transaction. Financial instruments with readily available active quoted prices for which fair value can be measured generally will have a higher degree of pricing observability and a lesser degree of judgment used in measuring fair value. Conversely, financial instruments rarely traded or not quoted will generally have less, or no, pricing observability and a higher degree of judgment used in measuring fair value.
Our financial assets and liabilities measured and reported at fair value are classified and disclosed in one of the following categories:
Level 1—Quoted prices are available in active markets for identical investments as of the reporting date.
Level 2—Pricing inputs are other than quoted prices in active markets, which are either directly or indirectly observable as of the reporting date, and fair value is determined through the use of models or other valuation methodologies.
Level 3—Pricing inputs are unobservable for the investment and include situations where there is little, if any, market activity for the investment. The inputs used in the determination of fair value require significant judgment or estimation.
A financial instrument’s categorization within the fair value hierarchy is based upon the lowest level of input that is significant to the fair value measurement.
Fair Value Measurements—Recurring
Amounts reported as cash and equivalents, receivables, and accounts payable and accrued expenses approximate fair value due to the short-term nature of activity within these accounts. The estimated fair value of the asset based credit facility approximates cost as the interest rate associated with the facility is variable and resets frequently. The estimated fair value of the Term Loan Credit Agreement approximates cost as it was recently issued and the interest rate associated with the credit agreement is variable and resets frequently. The estimated fair value and carrying value of the 2023 Notes and 2024 Notes were as follows (in thousands):
|
JANUARY 29, |
JANUARY 30, |
||||||||||
|
2022 |
2021 |
||||||||||
|
|
FAIR |
|
CARRYING |
|
FAIR |
|
CARRYING |
||||
VALUE |
VALUE (1) |
VALUE |
VALUE (1) |
|||||||||
Convertible senior notes due 2023 |
$ |
|
$ |
|
$ |
|
$ |
|
||||
Convertible senior notes due 2024 |
|
|
|
|
|
|
|
|||||
| (1) | Carrying value represents the principal amount less the equity component of the 2023 Notes and 2024 Notes classified in stockholders’ equity, and does not exclude the discounts upon original issuance, discounts and commissions payable to the initial purchasers and third party offering costs, as applicable. |
The fair value of each of the 2023 Notes and 2024 Notes was determined based on inputs that are observable in the market or that could be derived from, or corroborated with, observable market data, including the trading price of our convertible notes, when available, our stock price and interest rates based on similar debt issued by parties with credit ratings similar to ours (Level 2).
110 | FORM 10-K |
PART II — FINANCIAL STATEMENTS |
Fair Value Measurements—Non-Recurring
The fair value of the Waterworks tradename was determined based on unobservable (Level 3) inputs and valuation techniques, as discussed in “Impairment” within Note 3—Significant Accounting Policies.
The fair value of the acquired goodwill and tradename associated with the acquisitions by the RH Segment in fiscal 2020, as discussed in Note 6—Business Combinations, were determined based on unobservable (Level 3) inputs and valuation techniques.
The fair value of the real estate assets associated with our investment in the Aspen LLCs in fiscal 2020, as discussed in discussed in “Equity Method Investments” within Note 3—Significant Accounting Policies and Note 8—Equity Method Investments, were determined based on unobservable (Level 3) inputs and valuation techniques.
Upon settlement of our convertible senior notes, including the settlements in which holders of the 2023 Notes and 2024 Notes elected to exercise the early conversion option, we recognized a gain or loss on extinguishment of debt in the consolidated statements of income, which represents the difference between the carrying value and fair value of the convertible senior notes immediately prior to the settlement date. The fair value of each of the 2023 Notes and 2024 Notes related to the settlement of the early conversions was determined based on inputs that are observable in the market or that could be derived from, or corroborated with, observable market data, including the trading price of our convertible notes, when available, our common stock price and interest rates based on similar debt issued by parties with credit ratings similar to ours (Level 2).
NOTE 15—INCOME TAXES
The following is a summary of our income before income taxes, inclusive of our share of equity method investments losses (in thousands):
YEAR ENDED |
|||||||||
JANUARY 29, |
JANUARY 30, |
FEBRUARY 1, |
|||||||
|
2022 |
|
2021 |
|
2020 |
||||
Domestic |
$ |
|
$ |
|
$ |
|
|||
Foreign |
|
|
|
( |
|
|
|||
Total |
$ |
|
$ |
|
$ |
|
|||
The following is a summary of our income tax expense (in thousands):
YEAR ENDED |
|||||||||
JANUARY 29, |
JANUARY 30, |
FEBRUARY 1, |
|||||||
|
2022 |
|
2021 |
|
2020 |
||||
Current |
|||||||||
Federal |
$ |
|
$ |
|
$ |
|
|||
State |
|
|
|
|
|
|
|||
Foreign |
|
|
|
|
|
|
|||
Total current tax expense |
|
|
|
|
|
|
|||
Deferred |
|
|
|
|
|
|
|||
Federal |
|
( |
|
( |
|
( |
|||
State |
|
( |
|
( |
|
( |
|||
Foreign |
|
( |
|
( |
|
|
|||
Total deferred tax benefit |
|
( |
|
( |
|
( |
|||
Total income tax expense |
$ |
|
$ |
|
$ |
|
|||
PART II — FINANCIAL STATEMENTS |
FORM 10-K | 111 |
A reconciliation of the federal statutory tax rate to our effective tax rate is as follows:
|
YEAR ENDED |
||||||
|
JANUARY 29, |
|
JANUARY 30, |
|
FEBRUARY 1, |
||
|
2022 |
|
2021 |
|
2020 |
||
Provision at federal statutory tax rate |
|
|
% |
|
% |
|
% |
State income taxes—net of federal tax impact |
|
|
|
|
|
|
|
Non-deductible stock-based compensation |
|
|
|
|
|
— |
|
Tax rate adjustments and other |
|
|
|
|
|
|
|
Stock compensation—excess benefits |
|
( |
|
( |
|
( |
|
Valuation allowance |
|
— |
|
|
|
— |
|
Other permanent items |
|
— |
|
|
|
|
|
Effective tax rate |
|
|
% |
|
% |
|
% |
We have recorded deferred tax assets and liabilities based upon estimates of their realizable value, such estimates are based upon likely future tax consequences. In assessing the need for a valuation allowance, we consider both positive and negative evidence related to the likelihood of realization of the deferred tax assets. If, based on the weight of available evidence, it is more likely than not that the deferred tax assets will not be realized, we record a valuation allowance.
Significant components of our deferred tax assets and liabilities are as follows (in thousands):
|
JANUARY 29, |
|
JANUARY 30, |
|||
|
2022 |
|
2021 |
|||
Non-current deferred tax assets (liabilities) |
|
|
|
|
||
Lease liabilities |
$ |
|
$ |
|
||
Stock-based compensation |
|
|
||||
Accrued expenses |
|
|
|
|
||
Merchandise inventories |
|
|
|
|
||
Deferred lease credits |
|
|
|
|
||
Net operating loss carryforwards |
|
|
|
|
||
Deferred revenue |
|
|
|
|
||
Convertible senior notes |
|
|
|
|
||
Other |
|
|
|
|
||
Non-current deferred tax assets—net |
|
|
|
|
||
Valuation allowance |
|
( |
|
( |
||
Non-current deferred tax assets |
$ |
|
$ |
|
||
Property and equipment |
$ |
( |
$ |
( |
||
Lease right-of-use assets |
|
( |
|
( |
||
Tradename, trademarks and intangibles |
|
( |
|
( |
||
Prepaid expense and other |
|
( |
|
( |
||
State benefit |
|
( |
|
( |
||
Non-current deferred tax liabilities |
|
( |
|
( |
||
Total net non-current deferred tax assets |
$ |
|
$ |
|
||
112 | FORM 10-K |
PART II — FINANCIAL STATEMENTS |
A reconciliation of our valuation allowance against deferred tax assets in certain state and foreign jurisdictions due to historical losses is as follows (in thousands):
|
YEAR ENDED |
||||||||
|
JANUARY 29, |
|
JANUARY 30, |
|
FEBRUARY 1, |
||||
|
2022 |
|
2021 |
|
2020 |
||||
Balance at beginning of fiscal year |
$ |
|
$ |
|
$ |
|
|||
Net changes in deferred tax assets and liabilities |
|
( |
|
|
|
( |
|||
Balance at end of fiscal year |
$ |
|
$ |
|
$ |
|
|||
As of January 29, 2022, we had state net operating loss carryovers of $
A reconciliation of the exposures related to unrecognized tax benefits is as follows (in thousands):
|
YEAR ENDED |
||||||||
|
JANUARY 29, |
|
JANUARY 30, |
|
FEBRUARY 1, |
||||
|
2022 |
|
2021 |
|
2020 |
||||
Balance at beginning of fiscal year |
$ |
|
$ |
|
$ |
|
|||
Gross increases (decreases)—prior period tax positions |
|
( |
|
( |
|
( |
|||
Gross increases—current period tax positions |
|
|
|
|
|
|
|||
Reductions based on the lapse of the applicable statutes of limitations |
|
( |
|
( |
|
( |
|||
Balance at end of fiscal year |
$ |
|
$ |
|
$ |
|
|||
As of January 29, 2022, $
We account for interest and penalties related to exposures as a component of income tax expense. We had interest accruals of $
We are subject to taxation in the United States and various states and foreign jurisdictions. As of January 29, 2022, we are subject to examination by the tax authorities With few exceptions, as of January 29, 2022, we are no longer subject to U.S. federal, state, local, or foreign examinations by tax authorities for years before fiscal 2017.
PART II — FINANCIAL STATEMENTS |
FORM 10-K | 113 |
NOTE 16—NET INCOME PER SHARE
The weighted-average shares used for net income per share are as follows:
|
YEAR ENDED |
|||||
|
JANUARY 29, |
JANUARY 30, |
FEBRUARY 1, |
|||
|
|
2022 |
|
2021 |
|
2020 |
Weighted-average shares—basic |
|
|
|
|||
Effect of dilutive stock-based awards |
|
|
|
|
|
|
Effect of dilutive convertible senior notes (1) |
|
|
|
|
|
|
Weighted-average shares—diluted |
|
|
|
|
|
|
| (1) |
The 2019 Notes, 2020 Notes, 2023 Notes and 2024 Notes have an impact on our dilutive share count beginning at stock prices of $ |
While the share price for our common stock trades above the applicable conversion price of each series of notes or the applicable exercise price of each series of warrants for the notes, these instruments will have a dilutive effect with respect to our common stock to the extent that the price per share of our common stock continues to exceeds the applicable conversion or exercise price of the notes and warrants. Refer to Note 12—Convertible Senior Notes.
The following number of options and restricted stock units were excluded from the calculation of diluted net income per share because their inclusion would have been anti-dilutive:
|
YEAR ENDED |
|||||
|
JANUARY 29, |
JANUARY 30, |
FEBRUARY 1, |
|||
|
|
2022 |
|
2021 |
|
2020 |
Options |
|
|
|
|||
Restricted stock units |
|
|
|
|
|
— |
Total anti-dilutive stock-based awards |
|
|
|
|
|
|
NOTE 17—SHARE REPURCHASES AND SHARE RETIREMENTS
Share Repurchase Program
In 2018, our Board of Directors authorized a share repurchase program. In fiscal 2018, we repurchased approximately
Share Repurchases under Equity Plans
As of both January 29, 2022 and January 30, 2021, the aggregate unpaid principal amount of notes payable for share repurchases was $
114 | FORM 10-K |
PART II — FINANCIAL STATEMENTS |
Share Retirements
In fiscal 2020, we retired
In fiscal 2019, we retired
There was no impact on the consolidated statements of income or cash flows related to these share retirement activities.
NOTE 18—STOCK-BASED COMPENSATION
We recorded stock-based compensation expense of $
2012 Stock Incentive Plan and 2012 Stock Option Plan
The Restoration Hardware 2012 Stock Incentive Plan (the “Stock Incentive Plan”) was adopted on November 1, 2012. The Stock Incentive Plan provides for the grant of incentive stock options to our employees, non-qualified stock options, stock appreciation rights, restricted stock, restricted stock units, dividend equivalent rights, cash-based awards and any combination thereof to our employees, directors and consultants and our parent and subsidiary corporations’ employees, directors and consultants.
The Restoration Hardware 2012 Stock Option Plan (the “Option Plan”) was adopted on November 1, 2012 and on such date
As of January 30, 2021, there were a total of
The number of shares available for future issuance under the Stock Incentive Plan as of January 29, 2022 was
PART II — FINANCIAL STATEMENTS |
FORM 10-K | 115 |
2012 Stock Incentive Plan and 2012 Stock Option Plan—Stock Options
A summary of stock option activity under the Stock Incentive Plan and the Option Plan is as follows:
|
|
WEIGHTED-AVERAGE |
|||
OPTIONS |
EXERCISE PRICE |
||||
Outstanding—January 30, 2021 |
|
|
$ |
|
|
Granted |
|
|
|
||
Exercised |
|
( |
|
||
Cancelled |
|
( |
|
||
Outstanding—January 29, 2022 |
|
|
$ |
|
|
The fair value of stock options issued was estimated on the date of grant using the following assumptions:
YEAR ENDED |
|
||||||
|
JANUARY 29, |
|
JANUARY 30, |
|
FEBRUARY 1, |
|
|
2022 |
2021 |
2020 |
|
||||
Expected volatility |
|
|
% |
|
% |
|
% |
Expected life (years) |
|
|
|
||||
Risk-free interest rate |
|
|
% |
|
% |
|
% |
Dividend yield |
|
|
|
|
|
|
|
A summary of additional information about stock options is as follows:
YEAR ENDED |
|||||||||
|
JANUARY 29, |
|
JANUARY 30, |
|
FEBRUARY 1, |
||||
2022 |
2021 |
2020 |
|||||||
Weighted-average fair value per share of stock options granted |
$ |
|
$ |
|
$ |
|
|||
Aggregate intrinsic value of stock options exercised (in thousands) |
|
|
|
|
|
|
|||
Fair value of stock options vested (in thousands) |
|
|
|
|
|
|
|||
116 | FORM 10-K |
PART II — FINANCIAL STATEMENTS |
Information about stock options outstanding, vested or expected to vest, and exercisable as of January 29, 2022 is as follows:
OPTIONS OUTSTANDING |
OPTIONS EXERCISABLE |
|||||||||||
|
|
WEIGHTED- |
|
|
|
|||||||
AVERAGE |
WEIGHTED- |
WEIGHTED- |
||||||||||
REMAINING |
AVERAGE |
AVERAGE |
||||||||||
NUMBER OF |
CONTRACTUAL |
EXERCISE |
NUMBER OF |
EXERCISE |
||||||||
RANGE OF EXERCISE PRICES |
OPTIONS |
LIFE (IN YEARS) |
PRICE |
OPTIONS |
PRICE |
|||||||
$ |
|
|
$ |
|
|
$ |
|
|||||
$ |
|
|
|
|
|
|||||||
$ |
|
|
|
|
||||||||
$ |
|
|
|
|
|
|||||||
$ |
|
|
|
|
||||||||
Total |
|
|
|
$ |
|
|
|
$ |
|
|||
Vested or expected to vest |
|
|
|
$ |
|
|
|
|
|
|||
The aggregate intrinsic value of options outstanding, options vested or expected to vest, and options exercisable as of January 29, 2022 was $
We recorded stock-based compensation expense related to stock options of $
Chairman and Chief Executive Officer Option Grant
On October 18, 2020, our Board of Directors granted Mr. Friedman an option to purchase
The option contains selling restrictions on the underlying shares that lapse upon the achievement of both time-based service
Time-Based Restrictions
The time-based restrictions are measured over a
PART II — FINANCIAL STATEMENTS |
FORM 10-K | 117 |
Performance-Based Restrictions
The stock price performance-based restrictions of the option are measured annually over the performance year period and may lapse as to only one-quarter of the option in each of the first performance years, with the first performance year beginning in May 2021.
Any selling restrictions that have not lapsed in any performance year during the first four performance years may be achieved in a successive performance year through the end of the eighth performance year which ends in May 2029, provided Mr. Friedman continues to satisfy the service requirement through the date the performance target is achieved. Any selling restrictions that have not lapsed by the end of the eighth performance year will thereafter only lapse in May 2041, the
2012 Stock Incentive Plan—Restricted Stock Awards
We grant restricted stock awards, which include restricted stock and restricted stock units, to our employees and members of our Board of Directors. A summary of restricted stock award activity is as follows:
|
|
|
WEIGHTED- |
|
||||
AVERAGE |
||||||||
GRANT DATE FAIR |
INTRINSIC |
|||||||
AWARDS |
VALUE |
VALUE |
||||||
Outstanding—January 30, 2021 |
|
|
$ |
|
|
|
||
Granted |
|
|
|
|
|
|||
Released |
|
( |
|
|
|
|||
Cancelled |
|
( |
|
|
|
|||
Outstanding—January 29, 2022 |
|
|
$ |
|
$ |
|
||
A summary of additional information about restricted stock awards is as follows:
YEAR ENDED |
|||||||||
|
JANUARY 29, |
|
JANUARY 30, |
|
FEBRUARY 1, |
||||
2022 |
2021 |
2020 |
|||||||
Weighted-average fair value per share of awards granted |
$ |
|
$ |
|
$ |
|
|||
Grant date fair value of awards released (in thousands) |
|
|
|
|
|
|
|||
We recorded stock-based compensation expense related to restricted stock awards of $
NOTE 19—EMPLOYEE BENEFIT PLANS
We have a 401(k) plan for our employees who meet certain service and age requirements. Participants may contribute up to
118 | FORM 10-K |
PART II — FINANCIAL STATEMENTS |
NOTE 20—COMMITMENTS AND CONTINGENCIES
Commitments
We had
Contingencies
We are involved in lawsuits, claims, investigations and other legal proceedings incident to the ordinary course of our business. These disputes are increasing in number as the business expands and we grow larger. Litigation is inherently unpredictable. As a result, the outcome of matters in which we are involved could result in unexpected expenses and liability that could adversely affect our operations. In addition, any claims against us, whether meritorious or not, could be time consuming, result in costly litigation, require significant amounts of our senior leadership team’s time and result in the diversion of significant operational resources.
We review the need for any loss contingency reserves and establish reserves when, in the opinion of our senior leadership team, it is probable that a matter would result in liability, and the amount of loss, if any, can be reasonably estimated. Generally, in view of the inherent difficulty of predicting the outcome of those matters, particularly in cases in which claimants seek substantial or indeterminate damages, it is not possible to determine whether a liability has been incurred or to reasonably estimate the ultimate or minimum amount of that liability until the case is close to resolution, in which case no reserve is established until that time. When and to the extent that we do establish a reserve, there can be no assurance that any such recorded liability for estimated losses will be for the appropriate amount, and actual losses could be higher or lower than what we accrue from time to time. Although we believe that the ultimate resolution of our current legal proceedings will not have a material adverse effect on our consolidated financial statements, the outcome of legal matters is subject to inherent uncertainty.
NOTE 21—SEGMENT REPORTING
We define reportable and operating segments on the same basis that we use to evaluate our performance internally by the Chief Operating Decision Maker (the “CODM”), which we have determined is our Chief Executive Officer. We have
The retail operating segments are strategic business units that offer products for the home furnishings customer. While RH Segment and Waterworks have a shared senior leadership team and customer base, we have determined that their results cannot be aggregated as they do not share similar economic characteristics, as well as due to other quantitative factors.
We use operating income to evaluate segment profitability for the retail operating segments. Operating income is defined as net income before interest expense—net, tradename impairment, (gain) loss on extinguishment of debt, other expenses—net, income tax expense and our share of equity method investments losses.
Segment Information
The following table presents the statements of income metrics reviewed by the CODM to evaluate performance internally or as required under ASC 280—Segment Reporting (in thousands):
|
YEAR ENDED |
||||||||||||||||||||||||||
|
JANUARY 29, |
JANUARY 30, |
FEBRUARY 1, |
||||||||||||||||||||||||
|
2022 |
2021 |
2020 |
||||||||||||||||||||||||
|
RH SEGMENT |
|
WATERWORKS |
|
TOTAL |
|
RH SEGMENT |
|
WATERWORKS |
|
TOTAL |
|
RH SEGMENT |
|
WATERWORKS |
|
TOTAL |
||||||||||
Net revenues |
$ |
|
$ |
|
$ |
|
$ |
|
$ |
|
$ |
|
$ |
|
$ |
|
$ |
|
|||||||||
Gross profit |
|
|
|
|
|
|
|
|
|
|
|
|
|
|
|
|
|
|
|||||||||
Depreciation and amortization |
|
|
|
|
|
|
|
|
|
|
|
|
|
|
|
|
|
|
|||||||||
PART II — FINANCIAL STATEMENTS |
FORM 10-K | 119 |
In fiscal 2021 and fiscal 2020, the Real Estate Development segment share of equity method investments losses were $
The following table presents the balance sheet metrics as required under ASC 280—Segment Reporting (in thousands):
|
JANUARY 29, |
JANUARY 30, |
||||||||||||||||||||||
|
2022 |
2021 |
||||||||||||||||||||||
REAL ESTATE |
REAL ESTATE |
|||||||||||||||||||||||
|
|
RH SEGMENT |
|
WATERWORKS |
|
DEVELOPMENT |
|
TOTAL |
|
RH SEGMENT |
|
WATERWORKS |
|
DEVELOPMENT |
|
TOTAL |
||||||||
Goodwill (1) |
$ |
|
$ |
— |
$ |
— |
$ |
|
$ |
|
$ |
— |
$ |
— |
$ |
|
||||||||
Tradenames, trademarks and other intangible assets (2) |
|
|
|
|
|
— |
|
|
|
|
|
|
|
— |
|
|
||||||||
Equity method investments |
— |
— |
|
|
— |
— |
|
|
||||||||||||||||
Total assets |
|
|
|
|
|
|
|
|
|
|
|
|
|
|
|
|
||||||||
| (1) |
The Waterworks reporting unit goodwill of $ |
| (2) |
The Waterworks reporting unit tradename is presented net of an impairment charge of $ |
We use segment operating income to evaluate segment performance and allocate resources. Segment operating income excludes (i) a non-cash compensation charge related to a fully vested option grant made to Mr. Friedman in October 2020, (ii) asset impairments and changes in useful lives, (iii) product recall accruals and adjustments—net, (iv) severance costs associated with reorganizations, (v) gain (loss) on sale leaseback transactions, (vi) legal settlements, net of legal expenses and (vii) asset held for sale gain. These items are excluded from segment operating income in order to provide better transparency of segment operating results. Accordingly, these items are not presented by segment because they are excluded from the segment profitability measure that the CODM and our senior leadership team reviews.
The following table presents, for our retail operating segments, the segment operating income and income before income taxes (in thousands):
|
YEAR ENDED |
||||||||
|
JANUARY 29, |
JANUARY 30, |
FEBRUARY 1, |
||||||
|
|
2022 |
|
2021 |
|
2020 |
|||
Operating income: |
|||||||||
RH Segment |
$ |
|
$ |
|
$ |
|
|||
Waterworks |
|
|
|
|
|
|
|||
Non-cash compensation |
( |
( |
— |
||||||
Asset impairments and change in useful lives |
|
( |
|
( |
|
( |
|||
Recall accrual |
|
( |
|
( |
|
|
|||
Reorganization related costs |
|
( |
|
( |
|
( |
|||
(Gain) loss on sale leaseback transaction |
— |
( |
|
||||||
Legal settlements |
|
— |
|
— |
|
|
|||
Asset held for sale gain |
— |
— |
|
||||||
Income from operations |
|
|
|
|
|
|
|||
Interest expense—net |
|
|
|
|
|
|
|||
(Gain) loss on extinguishment of debt |
|
|
|
( |
|
|
|||
Other expense—net |
|
— |
— |
||||||
Tradename impairment |
— |
|
— |
||||||
Income before income taxes |
$ |
|
$ |
|
$ |
|
|||
120 | FORM 10-K |
PART II — FINANCIAL STATEMENTS |
We classify our sales into furniture and non-furniture product lines. Furniture includes both indoor and outdoor furniture. Non-furniture includes lighting, textiles, fittings, fixtures, surfaces, accessories and home décor. Net revenues in each category were as follows (in thousands):
|
YEAR ENDED |
||||||||
|
JANUARY 29, |
JANUARY 30, |
FEBRUARY 1, |
||||||
|
|
2022 |
|
2021 |
|
2020 |
|||
Furniture |
$ |
|
$ |
|
$ |
|
|||
Non-furniture |
|
|
|
|
|
|
|||
Total net revenues |
$ |
|
$ |
|
$ |
|
|||
We are domiciled in the United States and primarily operate our retail locations and outlets in the United States. As of January 29, 2022 we operated
PART II — FINANCIAL STATEMENTS |
FORM 10-K | 121 |
ITEM 9. CHANGES IN AND DISAGREEMENTS WITH ACCOUNTANTS ON ACCOUNTING AND FINANCIAL DISCLOSURE
None.
ITEM 9A. CONTROLS AND PROCEDURES
Evaluation of Disclosure Controls and Procedures
Our senior leadership team, with the participation of our Chief Executive Officer and Chief Financial Officer, evaluated the effectiveness of our disclosure controls and procedures (as defined in Rule 13a-15(e) under the Securities Exchange Act of 1934, as amended) as of the end of the period covered by this annual report. Based on that evaluation, our Chief Executive Officer and Chief Financial Officer have concluded that as of the end of the period covered by this report our disclosure controls and procedures were effective to provide reasonable assurance that information required to be disclosed by us in reports that we file or submit under the Securities Exchange Act of 1934, as amended, is recorded, processed, summarized and reported within the time periods specified in the SEC’s rules and forms, and include controls and procedures designed to ensure that the information required to be disclosed by us in such reports is accumulated and communicated to our senior leadership team, including our Chief Executive Officer and Chief Financial Officer, as appropriate, to allow timely decisions regarding required disclosures.
Management’s Report on Internal Control over Financial Reporting
Our senior leadership team is responsible for establishing and maintaining adequate internal control over financial reporting, as defined in Exchange Act Rule 13a-15(f). Our senior leadership team conducted an assessment of our internal control over financial reporting as of January 30, 2021 based on the framework established by the Committee of Sponsoring Organizations of the Treadway Commission in Internal Control—Integrated Framework (2013). Based on the assessment, our senior leadership team concluded that our internal control over financial reporting was effective as of January 29, 2022. The effectiveness of our internal control over financial reporting as of January 29, 2022 has been audited by PricewaterhouseCoopers LLP, an independent registered public accounting firm, as stated in their report which is included herein.
Changes in Internal Control over Financial Reporting
There were no changes in our internal control over financial reporting that occurred during our most recent fiscal quarter that have materially affected, or are reasonably likely to materially affect, our internal control over financial reporting.
Limitations on Effectiveness of Controls and Procedures and Internal Control over Financial Reporting
In designing and evaluating the disclosure controls and procedures and internal control over financial reporting, our senior leadership team recognizes that any controls and procedures, no matter how well designed and operated, can provide only reasonable assurance of achieving the desired control objectives. In addition, the design of disclosure controls and procedures and internal control over financial reporting must reflect the fact that there are resource constraints and that our senior leadership team is required to apply judgment in evaluating the benefits of possible controls and procedures relative to their costs.
ITEM 9B. OTHER INFORMATION
None.
ITEM 9C. DISCLOSURE REGARDING FOREIGN JURISDICTIONS THAT PREVENT INSPECTIONS
Not applicable.
122 | FORM 10-K |
PART II — FINANCIAL STATEMENTS |
PART III
ITEM 10. DIRECTORS, EXECUTIVE OFFICERS AND CORPORATE GOVERNANCE
The information required by this item will be contained in our definitive Proxy Statement for the 2022 Annual Meeting of Stockholders (the “Proxy Statement”) and is incorporated herein by reference.
ITEM 11. EXECUTIVE COMPENSATION
The information required by this item will be contained in our Proxy Statement and is incorporated herein by reference.
ITEM 12. SECURITY OWNERSHIP OF CERTAIN BENEFICIAL OWNERS AND MANAGEMENT AND RELATED STOCKHOLDER MATTERS
The information required by this item will be contained in our Proxy Statement and is incorporated herein by reference.
ITEM 13. CERTAIN RELATIONSHIPS AND RELATED TRANSACTIONS AND DIRECTOR INDEPENDENCE
The information required by this item will be contained in our Proxy Statement and is incorporated herein by reference.
ITEM 14. PRINCIPAL ACCOUNTANT FEES AND SERVICES
The information required by this item will be contained in our Proxy Statement and is incorporated herein by reference.
PART IV
ITEM 15. EXHIBITS AND FINANCIAL STATEMENT SCHEDULES
| (a) | The following documents are filed as part of this Annual Report on Form 10-K: |
| 1. | Consolidated Financial Statements |
The following financial statements are included in Part II, Item 8 of this Annual Report on Form 10-K:
Report of Independent Registered Public Accounting Firm on Consolidated Financial Statements
Consolidated Balance Sheets as of January 29, 2022 and January 30, 2021
Consolidated Statements of Income for the fiscal years ended January 29, 2022, January 30, 2021 and February 1, 2020
Consolidated Statements of Comprehensive Income for the fiscal years ended January 29, 2022, January 30, 2021 and February 1, 2020
Consolidated Statements of Stockholders’ Equity (Deficit) for the fiscal years ended January 29, 2022, January 30, 2021 and February 1, 2020
Consolidated Statements of Cash Flows for the fiscal years ended January 29, 2022, January 30, 2021 and February 1, 2020
Notes to the Consolidated Financial Statements
| 2. | Financial Statement Schedules |
Separate financial statement schedules have been omitted either because they are not applicable or because the required information is included in the consolidated financial statements or notes described in Item 15(a)(1) above.
| 3. | Exhibits |
The Exhibits listed in the Index to Exhibits, which appears immediately before the signature page and is incorporated herein by reference, are filed or incorporated by reference as part of this Annual Report on Form 10-K.
ITEM 16. FORM 10-K SUMMARY
The Company has elected not to include summary information.
EXHIBIT INDEX
INCORPORATED BY REFERENCE |
||||||||||||
|---|---|---|---|---|---|---|---|---|---|---|---|---|
EXHIBIT |
|
EXHIBIT DESCRIPTION |
|
FORM |
|
FILE NUMBER |
|
DATE OF |
|
EXHIBIT |
|
FILED |
3.1 |
10-K |
001-35720 |
March 29, 2017 |
3.1 |
||||||||
3.2 |
8-K |
001-35720 |
March 3, 2017 |
3.1 |
||||||||
4.1 |
10-K |
001-35720 |
March 30, 2020 |
4.1 |
||||||||
4.2 |
10-K |
001-35720 |
March 29, 2017 |
4.1 |
||||||||
4.3 |
8-K |
001-35720 |
June 19, 2018 |
4.1 |
||||||||
4.4 |
10-Q |
001-35720 |
September 5, 2018 |
4.2 |
||||||||
4.5 |
8-K |
001-35720 |
September 18, 2019 |
4.1 |
||||||||
10.1 |
S-1/A |
333-176767 |
October 23, 2012 |
10.4 |
||||||||
10.2* |
8-K |
001-35720 |
July 3, 2013 |
10.1 |
||||||||
10.3* |
S-8 |
333-184716 |
November 2, 2012 |
4.2 |
||||||||
10.4* |
S-8 |
333-184716 |
November 2, 2012 |
4.3 |
||||||||
10.5* |
S-8 |
333-184716 |
November 2, 2012 |
4.4 |
||||||||
10.6* |
10-Q |
001-35720 |
December 17, 2013 |
10.2 |
||||||||
10.7* |
10-K |
001-35720 |
March 31, 2014 |
10.17 |
||||||||
10.8* |
Notice of Stock Option Award and Stock Option Award Agreement by and between RH and Gary Friedman. |
8-K |
001-35720 |
May 3, 2017 |
10.1 |
|||||||
10.9* |
10-Q |
001-35720 |
September 9, 2017 |
10.2 |
||||||||
10.10* |
Form of Compensation Protection Agreement for Section 16 Presidents. |
10-K |
001-35720 |
March 29, 2018 |
10.11 |
|||||||
10.11 |
8-K |
001-35720 |
June 19, 2018 |
10.1 |
||||||||
INCORPORATED BY REFERENCE |
||||||||||||
|---|---|---|---|---|---|---|---|---|---|---|---|---|
EXHIBIT |
|
EXHIBIT DESCRIPTION |
|
FORM |
|
FILE NUMBER |
|
DATE OF |
|
EXHIBIT |
|
FILED |
10.12 |
8-K |
001-35720 |
June 19, 2018 |
10.2 |
||||||||
10.13 |
8-K |
001-35720 |
September 18, 2019 |
10.1 |
||||||||
10.14 |
8-K |
001-35720 |
September 18, 2019 |
10.2 |
||||||||
10.15 |
8-K |
001-35720 |
September 18, 2019 |
10.3 |
||||||||
10.16 |
8-K |
001-35720 |
September 18, 2019 |
10.4 |
||||||||
10.17 |
10-K |
001-35720 |
March 30, 2016 |
10.13 |
||||||||
10.18 |
8-K |
001-35720 |
July 13, 2017 |
10.1 |
||||||||
10.19 |
8-K |
001-35720 |
April 16, 2019 |
10.1 |
||||||||
10.20 |
8-K |
001-35720 |
April 16, 2019 |
10.2 |
||||||||
10.21 |
8-K |
001-35720 |
July 30, 2021 |
10.1 |
||||||||
10.22 |
8-K |
001-35720 |
October 25, 2021 |
10.1 |
||||||||
126 | FORM 10-K |
EXHIBIT INDEX |
INCORPORATED BY REFERENCE |
||||||||||||
|---|---|---|---|---|---|---|---|---|---|---|---|---|
EXHIBIT |
|
EXHIBIT DESCRIPTION |
|
FORM |
|
FILE NUMBER |
|
DATE OF |
|
EXHIBIT |
|
FILED |
10.23 |
8-K |
001-35720 |
October 21, 2020 |
10.1 |
||||||||
21.1 |
— |
— |
— |
— |
X |
|||||||
23.1 |
— |
— |
— |
— |
X |
|||||||
24.1 |
— |
— |
— |
— |
X |
|||||||
31.1 |
— |
— |
— |
— |
X |
|||||||
31.2 |
— |
— |
— |
— |
X |
|||||||
32.1 |
— |
— |
— |
— |
X |
|||||||
32.2 |
— |
— |
— |
— |
X |
|||||||
101.INS |
XBRL Instance Document––the instance document does not appear in the Interactive Data File because its XBRL tags are embedded within the Inline XBRL document. |
— |
— |
— |
— |
X |
||||||
101.SCH |
Inline XBRL Taxonomy Extension Schema Document |
— |
— |
— |
— |
X |
||||||
101.CAL |
Inline XBRL Taxonomy Extension Calculation Linkbase Document |
— |
— |
— |
— |
X |
||||||
101.DEF |
Inline XBRL Extension Definition |
— |
— |
— |
— |
X |
||||||
101.LAB |
Inline XBRL Taxonomy Extension Label Linkbase Document |
— |
— |
— |
— |
X |
||||||
101.PRE |
Inline XBRL Taxonomy Extension Presentation Linkbase Document |
— |
— |
— |
— |
X |
||||||
104 |
Cover Page Interactive Data File––the cover page interactive data file does not appear in the Interactive Data File because its XBRL tags are embedded within the Inline XBRL document. |
— |
— |
— |
— |
X |
||||||
* |
Indicates management contract or compensatory plan or arrangement. |
EXHIBIT INDEX |
FORM 10-K | 127 |
SIGNATURES
Pursuant to the requirements of Section 13 or 15(d) of the Securities Exchange Act of 1934, the registrant has duly caused this report to be signed on its behalf by the undersigned, thereunto duly authorized.
RH |
||
By: |
/s/ Gary Friedman |
|
Gary Friedman |
||
Chairman of the Board of Directors and Chief Executive Officer |
||
Date: March 30, 2022 |
||
POWER OF ATTORNEY
Know all persons by these presents, that each person whose signature appears below constitutes and appoints Gary Friedman and Jack Preston, and each of them, as such person’s true and lawful attorneys-in-fact and agents, with full power of substitution and resubstitution, for such person and in such person’s name, place and stead, in any and all capacities, to sign any and all amendments to this annual report on Form 10-K, and to file the same, with all exhibits thereto, and all other documents in connection therewith, with the Securities and Exchange Commission, granting unto each said attorneys-in-fact and agents, and each of them, full power and authority to do and perform each and every act and thing requisite and necessary to be done in connection therewith, as fully to all intents and purposes as such person might or could do in person, hereby ratifying and confirming all that said attorneys-in-fact and agents, or any of them or their or such person’s substitute or substitutes, may lawfully do or cause to be done by virtue thereof.
Pursuant to the requirements of the Securities Exchange Act of 1934, this report has been signed below by the following persons on behalf of the Registrant and in the capacities on March 30th, 2022.
/s/ Gary Friedman |
|
/s/ Jack Preston |
Gary Friedman |
Jack Preston |
|
Chairman of the Board of Directors and |
Chief Financial Officer |
|
(Principal Executive Officer) |
||
/s/ Christina Hargarten |
/s/ Carlos Alberini |
|
Christina Hargarten |
Carlos Alberini |
|
|
Chief Accounting Officer (Principal Accounting Officer) |
Director |
|
/s/ Keith Belling |
/s/ Eri Chaya |
|
Keith Belling |
Eri Chaya |
|
Director |
Director |
|
/s/ Mark Demilio |
/s/ Hilary Krane |
|
Mark Demilio |
Hilary Krane |
|
Director |
Director |
|
/s/ Katie Mitic |
/s/ Ali Rowghani |
|
Katie Mitic |
Ali Rowghani |
|
Director |
Director |
|
/s/ Leonard Schlesinger |
||
Leonard Schlesinger |
||
Director |