10-K/A: Annual report pursuant to Section 13 and 15(d)
Published on May 31, 2019
Table of Contents
UNITED STATES
SECURITIES AND EXCHANGE COMMISSION
Washington, D.C. 20549
FORM 10-K/A
(Mark One)
| ☒ | ANNUAL REPORT PURSUANT TO SECTION 13 OR 15(d) OF THE SECURITIES EXCHANGE ACT OF 1934 |
For the fiscal year ended February 2, 2019
or
| ☐ | TRANSITION REPORT PURSUANT TO SECTION 13 OR 15(d) OF THE SECURITIES EXCHANGE ACT OF 1934 |
For the transition period from to
Commission file number: 001-35720

(Exact name of registrant as specified in its charter)
| Delaware | 45-3052669 | |
| (State or other jurisdiction of incorporation or organization) |
(I.R.S. Employer Identification Number) |
|
| 15 Koch Road Corte Madera, CA |
94925 | |
| (Address of principal executive offices) | (Zip Code) | |
Registrants telephone number, including area code: (415) 924-1005
Securities registered pursuant to Section 12(b) of the Act:
| (Title of each class) |
(Trading symbol) |
(Name of each exchange on which registered) |
||
| Common Stock, $0.0001 par value | RH | New York Stock Exchange, Inc. |
Securities registered pursuant to Section 12(g) of the Act: None
Indicate by check mark if the registrant is a well-known seasoned issuer, as defined in Rule 405 of the Securities Act. Yes ☒ No ☐
Indicate by check mark if the registrant is not required to file reports pursuant to Section 13 or Section 15(d) of the Act. Yes ☐ No ☒
Indicate by check mark whether the registrant (1) has filed all reports required to be filed by Section 13 or 15(d) of the Securities Exchange Act of 1934 during the preceding 12 months (or for such shorter period that the registrant was required to file such reports), and (2) has been subject to such filing requirements for the past 90 days. Yes ☒ No ☐
Indicate by check mark whether the registrant has submitted electronically every Interactive Data File required to be submitted pursuant to Rule 405 of Regulation S-T (§232.405 of this chapter) during the preceding 12 months (or for such shorter period that the registrant was required to submit such files). Yes ☒ No ☐
Indicate by check mark whether the registrant is a large accelerated filer, an accelerated filer, a non-accelerated filer, a smaller reporting company, or an emerging growth company. See the definitions of large accelerated filer, accelerated filer, smaller reporting company, and emerging growth company in Rule 12b-2 of the Exchange Act.
| Large accelerated filer | ☒ | Accelerated filer | ☐ | |||
| Non-accelerated filer | ☐ | Smaller reporting company | ☐ | |||
| Emerging growth company | ☐ | |||||
If an emerging growth company, indicate by check mark if the registrant has elected not to use the extended transition period for complying with any new or revised financial accounting standards provided pursuant to Section 13(a) of the Exchange Act.
Indicate by check mark whether the registrant is a shell company (as defined in Rule 12b-2 of the Exchange Act). Yes ☐ No ☒
As of August 3, 2018, the last business day of the registrants most recently completed second quarter, the approximate market value of the registrants common stock held by non-affiliates was $2,651,665,414. Solely for purposes of this disclosure, shares of common stock held by executive officers and directors of the registrant as of such date have been excluded because such persons may be deemed to be affiliates.
As of May 23, 2019, 18,360,211 shares of registrants common stock were outstanding.
DOCUMENTS INCORPORATED BY REFERENCE
None.
Table of Contents
RH
| 1 | ||||||
| PART II. | ||||||
| Item 9B. |
Other Information | 2 | ||||
| PART III. | ||||||
| Item 10. |
Directors, Executive Officers and Corporate Governance | 3 | ||||
| Item 11. |
Executive Compensation | 11 | ||||
| Item 12. |
Security Ownership of Certain Beneficial Owners and Management and Related Stockholder Matters | 39 | ||||
| Item 13. |
Certain Relationships and Related Transactions, and Director Independence | 41 | ||||
| Item 14. |
Principal Accounting Fees and Services | 43 | ||||
| PART IV. | ||||||
| Item 15. |
Exhibits and Financial Statement Schedules | 44 | ||||
Table of Contents
This Amendment No. 1 on Form 10-K/A (the Amendment) amends the Annual Report on Form 10-K of RH, a Delaware corporation (we, us, or the Company), for the fiscal year ended February 2, 2019, originally filed with the Securities and Exchange Commission (the SEC) on March 29, 2019 (the Original Filing). This Amendment is being filed to include the information required by Item 10Directors, Executive Officers and Corporate Governance, Item 11Executive Compensation, Item 12Security Ownership of Certain Beneficial Owners and Management and Related Stockholder Matters, Item 13Certain Relationships and Related Transactions, and Director Independence and Item 14Principal Accountant Fees and Services of Part III of Form 10-K. The reference on the cover page of the Original Filing to the incorporation by reference of portions of our definitive proxy statement into Part III of the Original Filing is hereby deleted. Items 10, 11, 12, 13 and 14 of Part III of the Original Filing are amended and restated in their entirety as set forth in the Amendment. In addition, pursuant to Rule 13a-14(a) of the Securities Exchange Act of 1934, as amended (the Exchange Act), we are including with the Amendment certain currently dated certifications. Because no financial statements have been included in this Amendment and this Amendment does not contain or amend any disclosure with respect to Items 307 and 308 of Regulation S-K, paragraphs 3, 4 and 5 of the certifications have been omitted. We are not including the certifications under Section 906 of the Sarbanes-Oxley Act of 2002 as no financial statements are being filed with this Amendment.
In addition, the Amendment includes information under Item 9BOther Information with respect to amendments to our amended and restated credit agreement and second lien credit agreement entered into on May 31, 2019. Item 9B of Part II of the Original Filing is amended to add the disclosure as set forth in this Amendment.
Except as described above, no other amendments are being made to the Original Filing. The Original Filing continues to speak as of the date of the Original Filing, and we have not updated the disclosures contained therein to reflect any events that occurred at a date subsequent to the filing of the Original Filing other than as expressly indicated in this Amendment. Accordingly, this Amendment should be read in conjunction with the Original Filing and our other filings made with the SEC on or subsequent to March 29, 2019.
1
Table of Contents
| Item 9B. | Other Information. |
Fourth Amendment to Eleventh Amended and Restated Credit Agreement
On May 31 2019, Restoration Hardware, Inc., a wholly-owned subsidiary of RH, entered into a Fourth Amendment to the Eleventh Amended and Restated Credit Agreement, dated as of May 31, 2019 (the Fourth Amendment), which amends that certain Eleventh Amended and Restated Credit Agreement, dated as of June 28, 2017, among Restoration Hardware, Inc., as lead borrower, various other subsidiaries of RH named therein as borrowers, the guarantors party thereto, the lenders party thereto and Bank of America, N.A. as administrative agent and collateral agent (as heretofore amended or otherwise modified from time to time, the First Lien Credit Agreement). The Fourth Amendment, among other things, (a) extends the time to deliver monthly financial statements to the lenders for the fiscal months ending February 2019 and March 2019 until June 19, 2019; (b) removes the requirement to deliver monthly financial statements to the lenders for the last fiscal month of any fiscal quarter; and (c) waives any default or event of default under the First Lien Credit Agreement relating to the delivery of monthly financial statements or other information to lenders for the fiscal months ending February 2019 and March 2019. The foregoing is only a summary of the material terms of the Fourth Amendment and does not purport to be complete, and is qualified in its entirety by reference to the Fourth Amendment, a copy of which is filed as Exhibit 10.26 hereto and incorporated by reference herein.
First Amendment to Second Lien Credit Agreement
On May 31, 2019, Restoration Hardware, Inc., a wholly-owned subsidiary of RH, entered into a First Amendment to the Credit Agreement, dated as of May 31, 2019 (the First Amendment), which amends that certain Credit Agreement, dated as of April 9, 2019 and effective as of April 10, 2019, among Restoration Hardware, Inc., as lead borrower, the guarantors party thereto, the lenders party thereto, and BSP Agency, LLC as administrative agent and collateral agent (the Second Lien Credit Agreement). The First Amendment, among other things, (a) removes the requirement to deliver monthly financial statements to the lenders for the last fiscal month of any fiscal quarter; and (b) waives any default or event of default under the Second Lien Credit Agreement relating to the delivery of monthly financial statements or other information to lenders for the fiscal months ending February 2019 and March 2019. The foregoing is only a summary of the material terms of the First Amendment and does not purport to be complete, and is qualified in its entirety by reference to the First Amendment, a copy of which is filed as Exhibit 10.27 hereto and incorporated by reference herein.
2
Table of Contents
| Item 10. | Directors, Executive Officers and Corporate Governance. |
DIRECTORS
Below is detailed biographical information and ages, as of May 23, 2019, for each of our directors and a summary of the qualifications and skills demonstrated by each directors experience.
CLASS I DIRECTORS CONTINUING IN OFFICE UNTIL THE 2019 ANNUAL MEETING
| ERI CHAYA | ||
| Age: 45 Director since 2012 Board Committees: None |
Eri Chaya has served as a member of our board of directors since November 2012. Ms. Chaya also serves as our President, Chief Creative and Merchandising Officer. Ms. Chaya leads product curation and integration, brand development and design, and Interior Design for RH Interiors, Modern, Outdoor, Baby & Child and Teen, across the Companys physical, digital and print channels of distribution. Ms. Chaya served as RHs Co-President, Chief Creative and Merchandising Officer and Director from May 2016 to November 2017, Chief Creative Officer from April 2008 to May 2016 and Vice President of Creative from July 2006 to April 2008. Prior to RH, Ms. Chaya was a creative director at Goodby, Silverstein and Partners, an international advertising agency, and a creative director at Banana Republic.
Qualifications: Ms. Chaya was selected to our board of directors because of her extensive knowledge and experience in design, product development, brand development, marketing and advertising. |
|
| MARK DEMILIO | ||
| Age: 63 Director since 2009 Board Committees: Audit, Compensation, Nominating and Corporate Governance |
Mark Demilio has served as a member of our board of directors since September 2009 and currently serves as the boards Lead Independent Director. Since September 2015, Mr. Demilio has served as a member of the board of directors and Chairman of the audit committee of Schumacher Clinical Partners, a privately-held provider of emergency medicine and hospitalist services through physician staffing and management. Since June 2018, Mr. Demilio has served as a member of the board of directors and Chairman of the audit committee of Nurse Assist, a privately-held FDA registered manufacturer of medical device products. Mr. Demilio was a member of the board of directors of Cosi, Inc., a national restaurant chain, from April 2004 to May 2017, served on its audit committee, its compensation committee and its nominating and corporate governance committee, and served for a time as Chairman of the board of directors of Cosi and as the interim Chief Executive Officer of Cosi. From February 2014 through March 2016, Mr. Demilio served as a member of the board of directors and Chairman of the audit committee of The Paslin Company, a private company that designs, assembles and integrates robotic assembly lines for the automotive industry. From December 2000 until his retirement in October 2008, Mr. Demilio served as the Chief Financial Officer of Magellan Health Services, Inc., a Nasdaq-listed managed specialty healthcare company that managed the delivery of behavioral healthcare treatment services, specialty pharmaceuticals and radiology services. Mr. Demilio has also been the General Counsel for Magellan Health Service, the Chief Financial Officer and General Counsel of Youth Services International, Inc., an attorney specializing in corporate and securities law with the law firms of Miles & Stockbridge and Piper & Marbury, a financial analyst for CareFirst BlueCross BlueShield of Maryland and a certified public accountant with Arthur Andersen LLP.
Qualifications: Mr. Demilio was selected to our board of directors because he possesses particular knowledge and experience in accounting, finance and capital structure, strategic planning and leadership of complex organizations and board practices of other major corporations. |
|
3
Table of Contents
| LEONARD SCHLESINGER | ||
| Age: 66 Director since 2014 Board Committees: Compensation |
Leonard Schlesinger was appointed to our board of directors in April 2014. Dr. Schlesinger has served as the Baker Foundation Professor of Business Administration at Harvard Business School, a role he returned to in July 2013 after having served as the President of Babson College from July 2008 until July 2013 and having held various positions at public and private companies. From 1999 to 2007, Dr. Schlesinger held various executive positions at Limited Brands, Inc. (now L Brands, Inc.), an NYSE-listed company, including Vice Chairman of the board of directors and Chief Operating Officer. While at Limited Brands, he was responsible for the operational and financial functions across the enterprise including Express, Limited Stores, Victorias Secret Beauty, Bath and Body Works, C.O. Bigelow, Henri Bendel and the White Barn Candle Company. Dr. Schlesinger also previously served as Executive Vice President and Chief Operating Officer at Au Bon Pain Co., Inc. and as a director of numerous public and private retail, consumer products and technology companies. Dr. Schlesinger has also held leadership roles at leading MBA and executive education programs and other academic institutions, including twenty years at Harvard Business School where he served as the George Fisher Baker Jr. Professor of Business Administration. Dr. Schlesinger holds a Doctor of Business Administration from Harvard Business School, an M.B.A. from Columbia University and a Bachelor of Arts in American Civilization from Brown University.
Qualifications: Dr. Schlesingers extensive experience at numerous private and public retail companies provides the board with valuable operational, financial and business expertise. |
|
CLASS II DIRECTORS CONTINUING IN OFFICE UNTIL THE 2020 ANNUAL MEETING
| HILARY KRANE | ||
| Age: 55 Director since 2016 Board Committees: Audit |
Hilary Krane has served on our board of directors since her appointment in June 2016. She has served in executive roles at NIKE, Inc. since 2010 and currently serves as its Executive Vice President, Chief Administrative Officer and General Counsel. Prior to joining NIKE, Inc., Ms. Krane was General Counsel and Senior Vice President for Corporate Affairs at Levi Strauss & Co. from 2006 to 2010. From 1996 to 2006, she was a partner and assistant general counsel at PricewaterhouseCoopers LLP. Ms. Krane has been a director at the Federal Reserve Bank of San Francisco, Portland Branch since January 2018. Ms. Krane holds a Bachelor of Arts from Stanford University and a J.D. from the University of Chicago.
Qualifications: Ms. Krane was selected to our board of directors because of her experience contributing to the growth and development of innovative and iconic global brands. |
|
| KATIE MITIC | ||
| Age: 49 Director since 2013 Board Committees: Audit |
Katie Mitic has served on our board of directors since October 2013. Ms. Mitic was previously Founder and Chief Executive Officer of Sitch, Inc., a mobile app company from 2012 to 2017. From 2010 to 2012, Ms. Mitic served as Director of Platform & Mobile Marketing for Facebook, Inc., a social networking service. From June 2009 to July 2010, Ms. Mitic served as Senior Vice President, Product Marketing of Palm, Inc., a smartphone manufacturer. From 1994 to 2010, Ms. Mitic held leadership positions at various consumer technology companies. She also serves on the board of directors, | |
4
Table of Contents
| KATIE MITIC | ||
| compensation committee and nominating and governance committee of eBay, Inc., a global e-commerce company and on the board of directors of Headspace, a mobile health and wellness company. Ms. Mitic holds a B.A. degree in Economics from Stanford University and an M.B.A. degree from Harvard Business School.
Qualifications: Ms. Mitic was selected to our board of directors because of her extensive experience as a leader and entrepreneur obtained from her experience with major global consumer-facing technology companies. |
||
| ALI ROWGHANI | ||
| Age: 46 Director since 2015 Board Committees: |
Ali Rowghani was appointed to our board of directors on January 22, 2015. Mr. Rowghani has served in executive leadership positions at innovative growth companies, including Twitter, Inc. and Pixar Animation Studios, Inc. At Twitter, Mr. Rowghani was hired as the Companys first Chief Financial Officer in March 2010, and later served as Chief Operating Officer, with responsibility for business development, platform, media, product, and business analytics, from December 2012 to June 2014. Prior to Twitter, from June 2002 to February 2010, Mr. Rowghani served in various leadership roles at Pixar, including Chief Financial Officer and Senior Vice President, Strategic Planning, reporting to Pixar founder and President, Ed Catmull. Mr. Rowghani is currently the CEO of the YCombinator Continuity Fund, which invests in growth-stage startups. Mr. Rowghani holds a B.A. in International Relations and an M.B.A. from Stanford University.
Qualifications: Mr. Rowghanis operational and financial leadership, coupled with his expertise in scaling innovative, high-growth companies, provides the board with valuable operational and financial expertise. |
|
CLASS III DIRECTORS CONTINUING IN OFFICE UNTIL THE 2021 ANNUAL MEETING
| GARY FRIEDMAN | ||
| Age: 61 Director since 2013 Board Committees: None |
Gary Friedman has served as our Chairman and Chief Executive Officer of the Company, and Founder of the RH brand as we know it today since January 2014. Previously, Mr. Friedman served as our Co-Chief Executive Officer and Director from July 2013 to January 2014, and as Chairman and Co-Chief Executive Officer from May 2010 to October 2012. From October 2012 to July 2013, Mr. Friedman served as Chairman Emeritus, Creator and Curator on an advisory basis, and as Chief Executive Officer and a member of our Board of Directors from March 2001 to October 2012, during which time he served as our Chairman from March 2005 to June 2008. Mr. Friedman joined RH from Williams-Sonoma, Inc. where he spent 14 years serving as President and Chief Operating Officer from May 2000 to March 2001, as Chief Merchandising Officer of Williams-Sonoma, Inc. and President of Retail from 1995 to 2000, and as Executive Vice President of Williams-Sonoma, Inc. and President of the Williams-Sonoma and Pottery Barn brands from 1993 to 2000 during which time Mr. Friedman was responsible for transforming Pottery Barn from a $50 million dollar table top and accessories business, into a billion dollar plus home furnishings lifestyle brand. Mr. Friedman also developed and rolled out the revolutionary Williams-Sonoma Grande Cuisine stores, growing the brand from less than $100 million to almost $1 billion. Lastly, while at Williams-Sonoma Mr. Friedman spent several years conceptualizing and developing the West Elm brand which launched shortly after he left the company. Mr. Friedman joined Williams-Sonoma in 1988 as Senior Vice President of Stores and Operations. Mr. Friedman began his retail career in 1977 as a stock-boy at the Gap store in Santa Rosa, California. He spent eleven years with Gap, and held the positions of Store Manager, District Manager and Regional Manager overseeing 63 stores in Southern California. | |
5
Table of Contents
| GARY FRIEDMAN | ||
| Qualifications: Mr. Friedman was selected to our board of directors because of his leadership in re-conceptualizing and developing the RH brand and business into the leading luxury home brand in the North American market, his deep and unmatched expertise in developing and rapidly growing many of the leading consumer brands in the home furnishings space, and his extensive knowledge of building and leading complex multi-branded and multi-channel organizations. | ||
| CARLOS ALBERINI | ||
| Age: 63 Director since 2010 Board Committees: None |
Carlos Alberini has served on our board of directors since June 2010. Mr. Alberini currently serves as a member of the board of directors and Chief Executive Officer of Guess?, Inc., an NYSE-listed specialty retailer of apparel and accessories, since February 2019. Mr. Alberini previously served as the Chairman and Chief Executive Officer of Lucky Brand from February 2014 to February 2019. Mr. Alberini served as our Co-Chief Executive Officer from June 2010 through October 2012 and from July 2013 through January 2014, and he served as our sole Chief Executive Officer from October 2012 through July 2013. Mr. Alberini was President and Chief Operating Officer of Guess from December 2000 to June 2010. From May 2006 to July 2006, Mr. Alberini served as Interim Chief Financial Officer of Guess. Mr. Alberini served as a member of the board of directors of Guess from December 2000 to September 2011. From October 1996 to December 2000, Mr. Alberini served as Senior Vice President and Chief Financial Officer of Footstar, Inc., a retailer of footwear. From May 1995 to October 1996, Mr. Alberini served as Vice President of Finance and Acting Chief Financial Officer of the Melville Corporation, a retail holding corporation. From 1987 to 1995, Mr. Alberini was with The Bon-Ton Stores, Inc., an operator of department stores, in various capacities, including Corporate Controller, Senior Vice President, Chief Financial Officer and Treasurer. Prior to that, Mr. Alberini served in various positions at PricewaterhouseCoopers LLP, an audit firm.
Qualifications: Mr. Alberini was selected to our board of directors because he possesses particular knowledge and experience in retail and merchandising, branded consumer goods, accounting, financing and capital finance, board practices of other large retail companies and leadership of complex organizations. |
|
| KEITH BELLING | ||
| Age: 61 Director since 2016 Board Committees: None |
Keith Belling has served on our board of directors since April 2016, and previously served as an advisor to the board of directors from May 2015 to April 2016. Mr. Belling is the founder and CEO of RightRice, a next generation rice brand that launched in February 2019, in Whole Foods Markets nationwide and on Amazon. Mr. Belling is also the co-founder, Chairman and former Chief Executive Officer of popchips, inc. (popchips) a leading better-for-you snack food business that launched in 2007. He previously served as popchips Chief Executive Officer from 2007 through 2012, leading the company to sales and distribution at over 30,000 retail stores across North America and the United Kingdom and has served as the Chairman of the Board since 2007. Mr. Belling has served as an advisor to several innovative consumer, real estate and technology companies, including Modern Meadow Inc., Olly Nutrition, and LBA Realty LLC. Mr. Belling also has founded other businesses, including e-commerce company Allbusiness.com, a leading small business portal, founded in 2008, where Mr. Belling formerly served as Chief Executive Officer and which was acquired by NBCi. Mr. Belling was a real estate attorney with Morrison & Foerster LLP, where he represented a diverse clientele including developers and real estate investors.
Qualifications: Mr. Belling has been selected to our board because of his experience as a founder, leader, and entrepreneur of several innovative consumer companies, as well as his background and experience in the real estate sector. |
|
6
Table of Contents
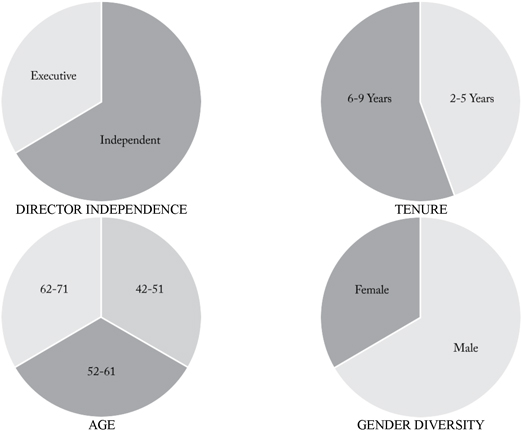
COMPOSITION AND QUALIFICATIONS OF OUR BOARD OF DIRECTORS
Our board of directors consists of nine directors, including our Chairman and Chief Executive Officer. Our certificate of incorporation provides that, subject to any rights applicable to any then-outstanding preferred stock, our board of directors shall consist of such number of directors as determined from time to time by resolution adopted by a majority of the total number of authorized directors whether or not there exist any vacancies in previously authorized directorships. Subject to any rights applicable to any then-outstanding preferred stock, any additional directorships resulting from an increase in the number of directors may only be filled by the directors then in office, unless otherwise required by law or by a resolution passed by our board of directors. The term of office for each director will be until his or her successor is elected at our annual meeting or his or her death, resignation or removal, whichever is earliest to occur.
Our board of directors is divided into three classes, with each director serving a three-year term, and one class being elected at each years annual meeting of shareholders. Our directors by class are as follows:
Class I: Eri Chaya, Mark Demilio and Leonard Schlesinger, with a term expiring at the 2019 annual meeting.
Class II: Hilary Krane, Katie Mitic and Ali Rowghani, with a term expiring at the 2020 annual meeting.
Class III: Gary Friedman, Carlos Alberini and Keith Belling, with a term expiring at the 2021 annual meeting.
We believe our board of directors should be composed of individuals with sophistication and experience in many substantive areas that impact our business. We believe experience, qualifications, or skills in the following areas are most important: retail merchandising; marketing and advertising; furniture and consumer goods; sales and distribution; accounting, finance, and capital structure; strategic planning and leadership of complex organizations; legal/regulatory and government affairs; people management; and board practices of other major corporations. We believe that all our current board members possess the professional and personal qualifications necessary for board service, and have highlighted particularly noteworthy attributes for each board member in their individual biographies above and as summarized below.
7
Table of Contents
| COMMITTEE MEMBERSHIP | ||||||||||||||||
| NAME/ CURRENT POSITION | AGE | DIRECTOR SINCE |
INDEPENDENT | AUDIT | COMP. | NOM. &CORP. GOVERNANCE |
||||||||||
| Gary Friedman RH Chairman and CEO |
61 | Jul. 2013 | ||||||||||||||
| Carlos Alberini Director and CEO of Guess? Inc. |
63 | Jun. 2010 | ◾ | |||||||||||||
| Keith Belling Founder and Chairman of popchips, inc. |
61 | Apr. 2016 | ||||||||||||||
| Eri Chaya RH President, Chief Creative and Merchandising Officer |
45 | Nov. 2012 | ||||||||||||||
| Mark Demilio Director and Chairman of the Audit Committee of Schumacher Clinical Partners and Nurse Assist |
63 | Sep. 2009 | ◾ | ☐ | ◾ | ☐ | ||||||||||
| Hilary Krane EVP, CAO and General Counsel, NIKE, Inc. |
55 | Jun. 2016 | ◾ | ◾ | ||||||||||||
| Katie Mitic Director of eBay, Inc. |
49 | Oct. 2013 | ◾ | ◾ | ||||||||||||
| Ali Rowghani CEO, YCombinator Continuity Fund |
46 | Jan. 2015 | ◾ | ◾ | ||||||||||||
| Leonard Schlesinger Professor of Business Administration, Harvard Business School |
66 | Apr. 2014 | ◾ | ☐ | ||||||||||||
| ☐ | Committee Chair |
| ◾ | Committee Member |
| EXPERIENCE | ||||||||||||||||||||||||||||
| NAME/ CURRENT POSITION | BUSINESS LEADERSHIP |
BRAND/ RETAIL |
GROWTH COMPANY |
PUBLIC CO. EXECUTIVE/ DIRECTOR |
INVESTMENT/ FINANCIAL |
LEGAL | RISK MANAGEMENT |
|||||||||||||||||||||
| Gary Friedman RH Chairman and CEO |
◾ | ◾ | ◾ | ◾ | ||||||||||||||||||||||||
| Carlos Alberini Director and CEO of Guess? Inc. |
◾ | ◾ | ◾ | ◾ | ◾ | |||||||||||||||||||||||
| Keith Belling Founder and Chairman, popchips, inc. |
◾ | ◾ | ◾ | ◾ | ||||||||||||||||||||||||
| Eri Chaya RH President, Chief Creative and Merchandising Officer |
◾ | ◾ | ||||||||||||||||||||||||||
| Mark Demilio Director and Chairman of the Audit Committee of Schumacher, Clinical Partners and Nurse Assist |
◾ | ◾ | ◾ | ◾ | ◾ | |||||||||||||||||||||||
| Hilary Krane EVP, CAO & General Counsel, NIKE, Inc. |
◾ | ◾ | ◾ | ◾ | ||||||||||||||||||||||||
| Katie Mitic Director, eBay, Inc. |
◾ | ◾ | ◾ | ◾ | ||||||||||||||||||||||||
| Ali Rowghani CEO, YCombinator Continuity Fund |
◾ | ◾ | ◾ | ◾ | ◾ | |||||||||||||||||||||||
| Leonard Schlesinger Harvard Business School Professor, Business Administration |
◾ | ◾ | ◾ | ◾ | ◾ | |||||||||||||||||||||||
| ◾ | Committee Member |
8
Table of Contents
EXECUTIVE OFFICERS
Below is a list of the names and ages, as of May 23, 2019, of our executive officers and a description of their business experience.
| NAME | AGE | POSITION | ||||
| Gary Friedman |
61 | Chairman and Chief Executive Officer |
||||
| Eri Chaya |
45 | President, Chief Creative and Merchandising Officer |
||||
| DeMonty Price |
57 | President, Chief Operating, Service and Values Officer |
||||
| David Stanchak |
60 | President, Chief Real Estate and Development Officer |
||||
| Jack Preston |
45 | Chief Financial Officer |
||||
Gary Friedman has served as our Chairman and Chief Executive Officer of the Company, and Founder of the RH brand as we know it today since January 2014. Previously, Mr. Friedman served as our Co-Chief Executive Officer and Director from July 2013 to January 2014, and as Chairman and Co-Chief Executive Officer from May 2010 to October 2012. From October 2012 to July 2013, Mr. Friedman served as Chairman Emeritus, Creator and Curator on an advisory basis, and as Chief Executive Officer and a member of our board of directors from March 2001 to October 2012, during which time he served as our Chairman from March 2005 to June 2008. Mr. Friedman joined RH from Williams-Sonoma, Inc. where he spent 14 years serving as President and Chief Operating Officer from May 2000 to March 2001, as Chief Merchandising Officer of Williams-Sonoma, Inc. and President of Retail from 1995 to 2000, and as Executive Vice President of Williams-Sonoma, Inc. and President of the Williams-Sonoma and Pottery Barn brands from 1993 to 2000 during which time Mr. Friedman was responsible for transforming Pottery Barn from a $50 million dollar table top and accessories business, into a billion dollar plus home furnishings lifestyle brand. Mr. Friedman also developed and rolled out the revolutionary Williams-Sonoma Grande Cuisine stores, growing the brand from less than $100 million to almost $1 billion. Lastly, while at Williams-Sonoma Mr. Friedman spent several years conceptualizing and developing the West Elm brand which launched shortly after he left the company. Mr. Friedman joined Williams-Sonoma in 1988 as Senior Vice President of Stores and Operations. Mr. Friedman began his retail career in 1977 as a stock-boy at the Gap store in Santa Rosa, California. He spent eleven years with Gap, and held the positions of Store Manager, District Manager and Regional Manager overseeing 63 stores in Southern California.
Eri Chaya serves as our President, Chief Creative and Merchandising Officer and Director. Ms. Chaya leads product curation and integration, brand development and design, and Interior Design for RH Interiors, Modern, Outdoor, Baby & Child and Teen, across the Companys physical, digital and print channels of distribution. Ms. Chaya served as RHs Co-President, Chief Creative and Merchandising Officer and Director from May 2016 to November 2017, Chief Creative Officer from April 2008 to May 2016 and Vice President of Creative from July 2006 to April 2008. Ms. Chaya has been a member of our board of directors since 2012. Prior to RH, Ms. Chaya was a creative director at Goodby, Silverstein and Partners, an international advertising agency, and a creative director at Banana Republic.
DeMonty Price serves as our President, Chief Operating, Service and Values Officer. Mr. Price leads service and operations across the Companys Galleries, outlets, distribution centers, care centers and home delivery network, as well as ensure a deep commitment to the Companys values and beliefs throughout the organization. Mr. Price served as Co-President, Chief Operating, Service and Values Officer from May 2016 to November 2017. Mr. Price joined RH in 2002 and served as the Companys Chief Service and Values Officer from September 2015 to May 2016, and Senior Vice President of Retail Galleries and Operations, and the Companys Chief Values Officer from June 2006 to September 2015. Prior to RH, Mr. Price was with Williams-Sonoma, Inc. for four years in various field leadership roles, as well as with Gap Inc. and Nike Inc.
David Stanchak serves as our President, Chief Real Estate and Development Officer. Mr. Stanchak leads real estate development, architecture and design for all of the Companys brands, concepts and facilities domestically and internationally. Prior to Mr. Stanchaks appointment to the Office of the President in November 2017, Mr. Stanchak served as RHs Chief Real Estate and Transformation Officer since May 2017 and Chief Real Estate and Development Officer from May 2015 to May 2017. From 2008 to 2013, Mr. Stanchak served as Senior Vice President of Dicks Sporting Goods and as President of Golf Galaxy. Mr. Stanchak has also been the President and owner of Pinpoint Real Estate Company since 1995. Over his 30-year career in the commercial real estate industry, Mr. Stanchak has worked as a senior executive, board member, consultant, investor, real estate broker and attorney in all aspects of high-growth, multi-unit retail brand development. He has had direct responsibility for opening more than 2,500 retail store locations, managing real estate portfolios and deploying in excess of $2 billion for retailers including RH, Dicks Sporting Goods, Field & Stream, Golf Galaxy, True Runner, DSW, Filenes Basement, Mike Ditkas Steakhouse, James Hardie Building Products, Blockbuster Entertainment, Einstein/Noah Bagel Corp. and Boston Market.
9
Table of Contents
Jack Preston serves as our Chief Financial Officer and leads all financial functions including strategic and financial planning, accounting, treasury, tax, internal audit and investor relations across the Companys multiple businesses and brands. Mr. Preston served as RHs Senior Vice President, Finance and Chief Strategy Officer from August 2014 to March 2019, and Senior Vice President, Finance and Strategy from April 2013 to August 2014. Prior to RH, Mr. Preston worked for Bank of America Merrill Lynch for over 12 years, where he most recently served as a director in the consumer and retail investment banking group. Mr. Preston holds a bachelor of commerce degree from the Sauder School of Business at the University of British Columbia.
CODE OF BUSINESS CONDUCT AND CODE OF ETHICS
We have adopted a code of business conduct and code of ethics applicable to our principal executive, financial and accounting officers and all persons performing similar functions. Copies of these codes are available on the Investor Relations section of our website, which is located at ir.rh.com, by clicking on Corporate Governance. The contents of our website are not incorporated by reference into this Amendment. We expect that any amendments to either code, or any waiver of the requirements of either code, will be disclosed on our website or as required by applicable law or NYSE listing requirements.
FAMILY RELATIONSHIPS
There are no family relationships between any of our directors and executive officers.
AUDIT COMMITTEE
The audit committee was established for the primary purpose of assisting the board of directors in overseeing the accounting and financial reporting processes of the Company and audits of its financial statements. The audit committee is responsible for, among other matters:
| | Appointing, retaining, compensating, evaluating, terminating and overseeing our independent registered public accounting firm; |
| | Delineating relationships between our independent registered public accounting firm and our Company consistent with the rules of the NYSE and requesting information from our independent registered public accounting firm and management to determine the presence or absence of a conflict of interest; |
| | Reviewing with our independent registered public accounting firm the scope and results of their audit; |
| | Approving all audit and permissible non-audit services to be performed by our independent registered public accounting firm; |
| | Overseeing the financial reporting process and discussing with management and our independent registered public accounting firm the interim and annual financial statements that we file with the SEC; |
| | Reviewing and monitoring our accounting principles, accounting policies, financial and accounting controls and compliance with legal and regulatory requirements; |
| | Establishing procedures for the confidential anonymous submission of concerns regarding questionable accounting, internal controls or auditing matters; and |
| | Reviewing and approving related-person transactions. |
Our audit committee currently consists of Mr. Demilio, Ms. Krane and Ms. Mitic. Rule 10A-3 of the Exchange Act, and NYSE rules require us to have at least three audit committee members, all of whom are independent. Our board of directors has affirmatively determined that each of Mr. Demilio, Ms. Krane and Ms. Mitic meets the definition of independent director for purposes of serving on our audit committee under Rule 10A-3 of the Exchange Act and NYSE rules. In addition, our board of directors has determined that Mr. Demilio qualifies as an audit committee financial expert, as such term is defined in Item 407(d)(5) of Regulation S-K.
Our board of directors has adopted a written charter for the audit committee, which is available on the Investor Relations section of our website, which is located at ir.rh.com, by clicking on Corporate Governance. The audit committee conducts an annual self-evaluation of its performance, as set forth in its charter.
10
Table of Contents
| Item 11. | Executive Compensation. |
COMPENSATION DISCUSSION AND ANALYSIS
Executive Summary
We align our executive compensation practices to the business objectives of our Company in order to drive ongoing improvements in our financial performance. This compensation discussion and analysis (CD&A) explains the strategy, design, and decision-making processes of our compensation programs and practices in the fiscal year ended February 2, 2019 (fiscal 2018) for our named executive officers. This CD&A is intended to provide perspective on the compensation information contained in the compensation tables that follow this discussion. This CD&A also discusses how the fiscal 2018 compensation of our named executive officers aligns with the key goals of our compensation philosophy, namely, attracting and retaining the best talent and driving financial performance. We also discuss how our Company uses its compensation programs including equity programs to encourage an ownership and stakeholder perspective among our named executive officers by providing them with a long-term interest in the growth and financial performance of our Company that aligns with the interests of our shareholders.
We believe that continually analyzing and refining our compensation program enables us to achieve the key goals of our compensation philosophy and supports ongoing improvements in our financial performance.
Fiscal 2018 Business Highlights
We call your attention to the following information about the Companys 2018 financial performance along with key executive compensation actions and decisions, and our key corporate governance policies and practices. The following business highlights are only a summary. For more complete information about these topics, please review the Companys prior filings with the SEC.
RH is a curator of design, taste and style in the luxury lifestyle market. The Company offers its collections through its retail galleries across North America, the Companys multiple Source Books, and online at RH.com, RHModern.com, RHBabyandChild.com, RHTeen.com and Waterworks.com. The home furnishings market is large and fragmented and we believe we have an opportunity to be the home brand for the luxury consumer at scale, both nationally and internationally. Our growth and long-term strategy is centered on the expansion of our product assortment, developing new categories, the transformation of our real estate platform and on international expansion.
We believe that compensation paid to our executive officers should be closely aligned with the performance of the Company, on both a short-term and long-term basis. The compensation committees decision-making regarding executive compensation in any given fiscal year is informed in part by the financial performance of the Company during the prior fiscal year as well as the strategic and business initiatives pursued by the Company during the year and over time. The Company undergoes an annual process to re-assess its compensation alignment. Accordingly, the compensation committee took actions in 2018 to better align the compensation of our leadership team with the Companys performance goals and long-term business strategy as well as to retain the Companys key talent. Below we highlight the Companys strong recent performance including fiscal 2018 financial performance, fiscal 2018 key strategies and initiatives and fiscal 2018 share price performance.
| FISCAL 2018 | ||
| Financial Performance(1) | GAAP diluted earnings per share of $5.68 compared to $0.01 last year, adjusted diluted earnings per share of $8.54 compared to $3.05 last year, an increase of 180%.
GAAP net income of $150.6 million compared to $2.2 million last year, adjusted net income of $400 million compared to $89.2 million last year, an increase of 151%.
GAAP operating margin of 11.5% versus 5.4% last year, adjusted operating margin of 12.1% versus 7.0% last year.
GAAP net revenues and adjusted net revenues increased 3% to $2.51 billion.
|
|
| Key Strategies & Initiatives | We focused in fiscal 2017 and fiscal 2018 on executing our new membership business model, architecting a new operating platform and maximizing cash flow by increasing revenues and earnings while decreasing inventory and capital spending.
We believe that our record fiscal 2018 results demonstrate the strength of the RH brand, the power of our new business model, our focus on managing the business with a bias for earnings versus revenue growth, and our continued success revolutionizing physical retailing.
|
|
11
Table of Contents
| FISCAL 2018 | ||
| While most in our industry are closing or downsizing stores, we remain committed to our quest of revolutionizing physical retailing. Our progress in fiscal 2018 included the opening of RH Portland and RH Nashville in the first half of the year, and the opening of two very unique and diverse retail experiences, RH New York and RH Yountville, in September. We continue to be pleased with the performance of our new Galleries and now have six Galleries with our integrated hospitality experience.
As we did in fiscal 2017, we continued to hold ourselves back from adding new businesses in fiscal 2018 outside of ongoing investments in RH Hospitality as we remained focused on optimizing the profitability of our new operating platform.
Our efforts architecting a new operating platform, inclusive of our distribution center network redesign, the redesign of our reverse logistics and outlet business, and the reconceptualization of our home delivery and customer experience, is driving lower costs and inventory levels, and higher earnings and inventory turns. We expect this multi-year effort to result in a dramatically improved customer experience, continued margin enhancement and significant cost savings over the next several years.
As previously mentioned, our plan is to accelerate our real estate transformation, opening 5 to 7 new Galleries per year, up from 3 to 5 per year.
We have several new brand extension plans in our development pipeline. We are launching RH Beach House with a dedicated Source Book and plan to launch RH Ski House with a dedicated Source Book. Additionally, we have plans to elevate and expand our assortments in key categories with the introduction of new bespoke collections as we pivot back to growth over the next several years. Our investment in RH Interior Design continues to provide a significant revenue opportunity as we continue building our ability to provide world class interior design services in North Americain our continued move beyond creating and selling products to conceptualizing and selling spaces.
|
||
| Share Price Performance | We commenced fiscal 2018 with our common stock price trading at a price near $90 per share and ended the fiscal year with our stock having traded in the range of $120 per share to above $130 per share toward the end of our fiscal year. We believe our stock price performance was driven by our financial performance through the year as well as the success of our focus on execution, architecture and cash. In each of fiscal 2017, 2018 and 2019, the Company has deeply focused on capital allocation, optimization of free cash flow and increasing the gross margins of the business. For example, our fiscal 2017 and fiscal 2018 share repurchase programs have resulted in the repurchase of $1.25 billion of our capital stock, which the Company believes will prove to be an excellent allocation of capital in the long term interest of shareholders. Although our stock price has experienced substantial volatility from quarter to quarter including during fiscal 2018, we believe over the long term investors have and will continue to experience stock price appreciation.
As of February 1, 2019, the last trading day of fiscal 2018, the closing price of our common stock was $133.64 per share, compared to $92.04 per share, which was the closing price of our common stock as of February 2, 2018, the last trading day of fiscal 2017.
|
|
| Other Performance Metrics | In fiscal 2018 we generated record revenues in excess of $2.5 billion, record GAAP operating margin of 11.5%, record adjusted operating margins of 12.1%(1), and industry leading ROIC of 27.8%.(2)
We have included a stock performance table below to disclose a measure of total shareholder return, reflecting positive performance, growth and the effectiveness of pay for performance alignment.
|
|
| (1) | Reconciliations of GAAP to non-GAAP financial measures for adjusted net revenues, adjusted operating margin, adjusted net income and adjusted diluted earnings per share are provided in the tables included in Annex A to this Amendment. |
| (2) | We define Return on Invested Capital (or ROIC) as adjusted operating income after-tax for the most recent twelve-month period, divided by the average of beginning and ending debt and equity less cash and equivalents as well as short and long-term investments for the most recent twelve month period. ROIC is not a measure of financial performance under GAAP, and should be considered in addition to, and not as a substitute for other financial measures prepared in accordance with GAAP. Our method of determining ROIC may differ from other companies methods and therefore may not be comparable. |
12
Table of Contents
STOCK PERFORMANCE
The following table shows the total shareholder return for our common stock during the five fiscal year periods indicated below. The first row of the table indicates the cumulative return of an investor purchasing one share of RH common stock at the market close on January 31, 2014 and its value (percentage increase or decrease) at the associated fiscal year ends indicated in the table. The table then assumes a scenario where $100 was invested at the market close on January 31, 2014 in RH common stock, which is equivalent to 1.76 shares (if fractional shares were permitted), and its value (percentage increase or decrease) at the associated fiscal year ends indicated in the table.
| 2014 ( Jan. 31) |
2015 ( Jan. 30) |
2016 ( Jan. 29) |
2017 ( Jan. 27) |
2018 (Feb. 2) |
2019 (Feb. 1) |
|||||||||||||||||||
| Value of 1 share |
$ | 56.74 | $ | 87.53 | $ | 61.62 | $ | 26.09 | $ | 92.04 | $ | 133.64 | ||||||||||||
|
|
|
|
|
|
|
|
|
|
|
|
|
|||||||||||||
| Value of a $100 Investment |
$ | 100 | $ | 154.27 | $ | 108.60 | $ | 45.98 | $ | 162.21 | $ | 235.53 | ||||||||||||
|
|
|
|
|
|
|
|
|
|
|
|
|
|||||||||||||
| Percentage Change |
N/A | 54.27 | % | 8.60 | % | -54.02 | % | 62.21 | % | 135.53 | % | |||||||||||||
This table is supplemental to the stock performance graph presented in the Original Filing.
The following table sets forth, for fiscal 2018, our named executive officers, as defined in Item 402 of Regulation S-K promulgated under the Securities Act of 1933, as amended:
| NAME | TITLE | |
| Gary Friedman | Chairman and Chief Executive Officer | |
| Ryno Blignaut(1) | President, Chief Financial and Administrative Officer | |
| Karen Boone(2) | Former President, Chief Financial and Administrative Officer | |
| Eri Chaya | President, Chief Creative and Merchandising Officer and Director | |
| DeMonty Price | President, Chief Operating, Service and Values Officer | |
| David Stanchak | President, Chief Real Estate and Development Officer |
| (1) | Mr. Blignaut was hired on August 14, 2018. Mr. Blignaut left the Company in March 2019 due to health considerations, at which time Jack Preston assumed the role of Chief Financial Officer. |
| (2) | Ms. Boone left the Company in November 2018. |
We believe that compensation paid to our executive officers should be:
| | Closely aligned with the performance of the Company, on both a short-term and long-term basis; |
| | Linked to specific, measurable results intended to create value for shareholders; |
| | Transparent, accessible and understandable by all stakeholders to understand what drives our executives; and |
| | Tailored to achieve the key goals of our compensation program and philosophy. |
Our executive compensation programs are aligned with our shareholders interests, with performance-based compensation being tied primarily to our annual earnings before taxes and our long-term stock price performance.
The compensation committee has continued to focus on balancing the alignment of our executive compensation program with our financial performance, providing incentives for retention purposes, rewarding the continued transformation of the business in fiscal 2018 and tailoring our compensation arrangements to match changes in our executive leadership. In March 2019, the compensation committee reviewed the Companys financial results, corporate performance measures and the adjusted net income before tax metric goals that were set for fiscal 2018 with respect to its performance-based annual cash incentive awards. The committee reviewed the extent to which those established goals were achieved and determined that the related compensation earned was at the 170% achievement level based on its targeted fiscal 2018 performance objectives (see Fiscal 2018 Business Highlights above for more information regarding the Companys financial performance and key strategies and initiative for fiscal 2018). In the case of Mr. Blignaut, who was hired on August 14, 2018 and left the Company in March 2019, the compensation committee determined to provide him with a discretionary bonus for fiscal 2018 in recognition of his not being eligible for a bonus under the LIP program due to his departure from the Company as well as in consideration of his contributions to the Company during his tenure and his assistance with the transition of his roles and responsibilities to Mr. Preston, the Companys current Chief Financial Officer. In addition, the base salaries for Ms. Chaya, Mr. Price, Mr. Stanchak and Ms. Boone were increased from the fiscal 2017 base salaries, as further discussed below.
13
Table of Contents
In the case of our Chairman and Chief Executive Officer, Mr. Friedman, the compensation committee has determined that no additional equity grants be made to him for fiscal 2018 and fiscal 2019 given his multi-year equity grant structure. Equity grants are the primary form of long-term incentive compensation provided to Mr. Friedman. In fiscal 2017, the compensation committee determined to grant multi-year equity awards with performance conditions tied to stock price performance to Mr. Friedman. One of our overriding goals informing our compensation philosophy is to create in our management an ownership and entrepreneurial mindset in order to align management performance with improvements in shareholder returns. The multi-year stock option award granted to Mr. Friedman during fiscal 2017 required substantial stock price appreciation from the Companys share price on the date of grant: the stock price performance targets in Mr. Friedmans equity award were set at $100, $125 and $150 per share, measured over a minimum four year time period from the date of grant and represented premiums to the grant-date stock price of 105.7%, 157.1% and 208.5%, respectively.
The fiscal 2017 equity award to Mr. Friedman was structured as a multi-year equity award with performance conditions tied to stock price performance, which the committee determined to be a transparent and accessible measure of overall value that aligns Mr. Friedmans compensation with returns experienced by investors. The multi-year structure of the 2017 award was similar to the multi-year structure of the prior equity grant to Mr. Friedman in 2013 and is designed to incentivize Mr. Friedman and align him with a long-term view in leading the Company. Mr. Friedman has not requested changes to his base salary or bonus since 2016.
In its 2018 and 2019 annual review of executive compensation, the compensation committee affirmed the effectiveness of the multi-year equity structure. Since the date of the equity award to Mr. Friedman, the financial and operational performance of RH has improved and the stock price has appreciated. As of February 2, 2018, the last trading day of fiscal 2017, the closing price of our common stock was $92.04 per share, a substantial increase over the price at the time of the equity award to Mr. Friedman in May, 2017. As of February 1, 2019, the last trading day of fiscal 2018, the closing price of our common stock had further increased to $133.64 per share. Based on the strong performance of RHs stock price since the date of the award to Mr. Friedman, each of the first two tranches have met two-thirds of the performance hurdles and the first two tranches have met the time requirement as of the date of this Amendment.
We believe this grant shows our commitment to set compensation and performance targets for our executives that align with our long-term growth strategy and our shareholders interests.
We continue to believe that our executive compensation program, including the compensation of our Chairman and Chief Executive Officer, is clearly structured to reflect the best interest of shareholders and that if we continue to drive improving operational and financial performance investors will be rewarded by stock price appreciation.
Shareholder Engagement
We actively engage with major shareholders of the Company, which has been a practice of the Company since our initial public offering in 2012. At our 2018 annual meeting of shareholders, approximately 60% of the votes cast by our shareholders supported our say-on-pay proposal. We are committed to the interests of our shareholders and the delivery of shareholder value through our focus on execution, architecture and cash, including through capital allocation, optimization of free cash flow and increasing the gross margins of the business. We believe that, as part of this commitment, it is important to maintain an ongoing dialogue with shareholders, including with respect to feedback on our executive compensation programs. In 2016, we launched a formalized annual shareholder outreach program in order to solicit additional input from shareholders with respect to corporate governance and executive compensation practices. This shareholder outreach effort continued in 2017, 2018 and 2019. Along with our annual shareholder outreach program, throughout the year, members of our leadership team, including our Chief Financial Officer and head of investor relations, engage in regular shareholder and investor communications, in which we receive feedback.
As part of our shareholder outreach efforts, we have provided explanations of our organizational and management structures and our constant efforts to continue evolving our management structure in order to refine the organizational design and improve its alignment with the evolution of the business. In particular, we have highlighted that numerous business initiatives like the membership program have resulted in simplification of some aspects of our business, while other new initiatives require on-going management focus and efforts, and that the shifts in focus and responsibilities of our business and executive officers are designed to attune the organizational and management structures to the transformation of our business. This formalized shareholder outreach program is designed to solicit feedback from the Companys shareholders with respect to a number of topics related to our executive pay practices and corporate governance policies. This effort supplements the ongoing communications between our management and shareholders. We continue to receive feedback from our investors under our shareholder outreach program throughout the year.
As part of the shareholder outreach campaign,
14
Table of Contents
| | In 2016, we solicited the views of institutional investors that we believe represented approximately 94% of our issued and outstanding shares owned by institutional investors as of December 31, 2015, and had discussions with and received feedback from investors representing approximately 61% of such outstanding shares. |
| | In 2017, we solicited the views of institutional investors that we believe represented approximately 55% of our issued and outstanding shares owned by institutional investors as of December 31, 2016, and had discussions with and received feedback from investors representing approximately 40% of such outstanding shares. |
| | In 2018, we solicited the views of institutional investors that we believe represented approximately 67% of our issued and outstanding shares owned by institutional investors as of December 31, 2017, and had discussions with and received feedback from investors representing approximately 28% of such outstanding shares. |
| | In 2019, we solicited the views of institutional investors that we believe represented approximately 69% of our issued and outstanding shares owned by institutional investors as of December 31, 2018, and had discussions with and received feedback from investors representing approximately 31% of such outstanding shares. |
In 2019, inasmuch as we had contacts with a large number of our investors in our prior annual shareholder outreach campaigns, a number of our investors that had been previously contacted indicated there was not a need to have a further round of conversations in the current annual shareholder outreach campaign as their positions on the topics discussed had not changed in any significant way from the prior year conversations.
In addition to the general feedback noted in the chart below, investors have expressed appreciation of our outreach efforts and acknowledged our quick reaction and responsiveness to the against vote recommendation last year from two proxy advisory firms on our say-on-pay proposal. The results of the shareholder outreach campaign, including concerns and feedback we received, were provided to our board of directors.
| WHAT WE HEARD | WHAT WE DID | |
| Shareholders requested that we make our proxy statement more readable and make the information presented more accessible.
|
We continue to make improvements to our proxy statements from previous years, including providing more information in tables and charts rather than within lengthy narrative form in order to make the presentation easier to read and the information more accessible. | |
| Shareholders requested increased transparency around peer group or other competitive measurements used by the Company for our pay-for-performance alignment.
|
We provided additional disclosure around our market check approach to our compensation practices to ensure performance alignment and retention of our key executives. | |
| Shareholders requested increased transparency into the decision to use adjusted net income before tax in our annual (short-term) cash bonus or Leadership Incentive Program, or LIP.
|
We provided disclosure in our compensation discussion and analysis in order to explain the reasons we chose certain compensation metrics and to show how our program is aligned with shareholder interests. | |
| Shareholders requested increased transparency into the decision to use stock price as part of the performance metric under our long-term incentive (equity) program. | Given one of our core foci is on innovation and business transformation, and our objectives to use a metric that is objectively measurable, aligned on both the Companys short-term and long-term goals, useful across the multiple industries (such as e-commerce and hospitality) in which we operate or intend to operate in the long-term, transparent, understandable and accessible to our shareholders and other key stakeholders, including our employees, we believe and have determined stock price is a useful performance metric that addresses all of the Companys strategic goals for a performance metric.
We also provided detailed information concerning the structuring of a stock option that the compensation committee approved for grant to Mr. Friedman, our Chairman and Chief Executive Officer, under the 2012 Stock Incentive Plan to purchase 1,000,000 shares of the Companys common stock with certain selling restrictions tied to stock price appreciation (the 2017 Stock Option Award).
|
15
Table of Contents
| WHAT WE HEARD | WHAT WE DID | |
| Shareholders requested information related to other performance metrics such as total shareholder return (TSR) and return on invested capital (ROIC). | We continued to refine our executive compensation program, including in 2018, to create significant pay-for-performance alignment. Although we do not use these metrics as part of our long-term incentive strategy, we have been providing indications of these measures in our Form 10-K and as well as in our earnings releases and have determined to disclose them in our proxy statement for convenience.
We have included a stock performance table above to disclose a measure of total shareholder return, reflecting positive performance, growth and the effectiveness of pay for performance alignment.
Please see sub-section entitled Fiscal 2018 Business Highlights at the beginning of the Compensation Discussion and Analysis section of this Amendment.
|
|
| Shareholders requested additional disclosure regarding certain corporate governance practices. | We added details and information regarding certain of our corporate governance practices. In particular, in 2018 we included disclosure about our newly adopted stock ownership guidelines, board and executive diversity and our corporate social responsibility programs that addresses environmental, social and governance issues relevant to the Companys business.
|
|
| Shareholders requested further disclosure about the basis for Mr. Alberinis independence as a director in response to certain policy approaches by independent governance and proxy advisory firms around the ability of former chief executive officers to serve as independent board members on the boards of companies they once served as chief executive officers.
|
We provided additional disclosures regarding the basis for the determination that Mr. Alberini is an independent director. Since his departure, Mr. Alberini served in senior management roles at other companies, and is currently a director and CEO of Guess, Inc., which is a publicly traded company. Given his other active roles, and time away from RH management, we believe Mr. Alberini provides a valuable role as an independent director to RH. In each year, the board also determined not to appoint Mr. Alberini to any of RHs committees of the board of directors that require directors be independent. | |
| Shareholders requested further disclosure about the nature of our Chairman and Chief Executive Officers multi-year awards and further explanation around the period that the award is intended to cover. | In those circumstances where we make a multi-year equity award to an executive officer, we intend to disclose details concerning the multi-year nature of the award.
We have followed a practice of making multi-year equity awards to our Chairman and Chief Executive Officer in several instances and we have provided substantial additional disclosure concerning those multi-year awards. In particular, we provided a multi-year equity award to him in the second fiscal quarter of 2013. In the second quarter of fiscal 2017, we granted our Chairman and Chief Executive Officer an additional multi-year equity award that is designed to serve for a four year period. We have included enhanced disclosure concerning these multi-year equity awards to our Chairman and Chief Executive Officer in our compensation discussion and analysis in order to explain the intent and details behind these large equity awards as well as the fact that we have not granted further equity awards to Mr. Friedman in fiscal 2018 or fiscal 2019.
The multi-year structure arose out of a purposefully driven conversation and discussion between the compensation committee and Mr. Friedman and is believed to incentivize Mr. Friedman and align him with a long-term view in leading the Company.
|
16
Table of Contents
| WHAT WE HEARD | WHAT WE DID | |
| Shareholders also expressed a preference that equity awards granted to the executive officers of RH in particular be tied to performance metrics rather than simple time based metrics based on continued service. | Our compensation program relies on equity and equity upside as a key incentive that aligns incentives between the management team and our investors. For example, we consider stock option awards, which only have value if the stock goes higher, a key component of our compensation program.
Based on discussions and compensation reviews in 2016 and 2017, we structured the 2017 Stock Option Award to Mr. Friedman to require substantial stock price appreciation from the price of our common stock on the date of grant in order for restrictions on the shares underlying the award to lapse. We also required a four year service period for the Chief Executive Officer in order to assure that these price objectives would be measured on a sustained basis rather than at a single moment in time.
We believe the four year structure of the award aligns and incentivizes Mr. Friedman to take a multi-year and long-term approach in leading the Company.
|
|
| Shareholders requested additional disclosure around the new leadership team and the recent changes to our organizational design. | As a result of the ongoing evolution of our business, we continuously adjust the structure and operation of our executive leadership team to meet the needs of our business and optimize the outcome of our initiatives. We frequently implement changes to our organizational design in order to more closely align our management structure with the changing needs of the business. We have launched numerous initiatives that have become integral to the ongoing development of our business including, among others: (i) our membership program; (ii) the introduction of RH Hospitality in many of our new Gallery locations; (iii) the transformation of our real estate both through the introduction of new Galleries and changes in the real estate development model; (iv) ongoing restructuring and improvements to our distribution centers, transportation network and supply chain; (v) the introduction and expansion of design services as part of our Gallery operations; (vi) improvements in our home delivery and outlet model including the introduction of reverse logistics; (vii) improvements in our product assortment including the introduction of new categories such as RH Modern; and (viii) expansion of our business into international markets. While some of these initiatives such as the ongoing development of RH Hospitality have required us to add incremental management positions, others have simplified our business.
Our efforts architecting a new operating platform, inclusive of our distribution center network redesign, the redesign of our reverse logistics and outlet business, and the reconceptualization of our home delivery and customer experience, are driving lower costs and reductions in inventory levels. Likewise, the adoption of a membership model has resulted in simplification in our business and corresponding reduction in certain management personnel. Many of the efforts to improve our organizational design have resulted in changes in our home office operations and increased responsibilities for our executive leadership team.
Over the last several years, we have eliminated a large number of middle management positions as part of the organizational redesign and we have increased the scope of responsibility for our named executive officers including Ms. Chaya, Mr. Price and Mr. Stanchak, each of whom works closely with our CEO. Ms. Chaya, our President, Chief Creative and Merchandising Officer oversees our product assortment and merchandising as well as related parts of our business including our Source Books and web presence. Mr. Price, our President, Chief Operating, Service and Values Officer, oversees our Gallery operations, Human Resources, distribution centers and supply chain, outlet and call center operations. Mr. Stanchak, our President, Chief Real Estate and Development Officer oversees our real estate transformation. The compensation committee determined to increase the base salaries for these named executive officers, as discussed below, in order to incentivize such named executive officers to continue to drive operational performance through these initiatives.
|
17
Table of Contents
OVERVIEW OF COMPENSATION PROGRAM AND PHILOSOPHY
Our compensation program is designed to do the following:
| Attract and retain | We focus on attracting and retaining top-caliber, knowledgeable and experienced senior executives | |
| Encourage an ownership and entrepreneurial mindset | Our programs create in our management an ownership and entrepreneurial mindset in order to align the annual and long-term strategic goals of our executives with those of our Company and our shareholders, including improvements in shareholder returns | |
| Motivate | Our programs motivate our executives to achieve superior results for our Company and our shareholders | |
| Reward performance | We pay for performance that is achieved through creativity, the capitalization of unique strategic opportunities and business initiatives, and results in shareholder-aligned financial successes, including improvements in our stock price | |
| Encourage appropriate risk taking | Our programs focus our executives to analyze business initiatives where we seek return on investment that exceeds downside risks | |
| Provide transparent reward systems | Our reward systems are easily understood by our managers and shareholders | |
| Reinforce the succession planning process | Our programs help management to focus on identifying, and help us reward, retain and promote from within, the next generation of senior leadership to achieve the Companys growth, profitability and other objectives through increased responsibilities and compensation | |
This compensation philosophy guides the compensation committee in assessing the compensation to be paid to our executives, including our named executive officers. The compensation committee endeavors to ensure that the total compensation paid to the named executive officers is fair, competitive and consistent with our compensation philosophy. This compensation philosophy also guides the compensation committee as to the proper allocation among current cash compensation (in the form of annual base salary), short-term compensation (in the form of performance-based, annual cash incentives), and long-term compensation (in the form of equity incentive compensation). We evaluate both the performance and compensation of our named executive officers annually to ensure that the executive compensation program we implement achieves these goals.
One of our overriding goals informing our compensation philosophy is to create in our management an ownership and entrepreneurial mindset in order to align management performance with improvements in shareholder returns. Our compensation programs aim to improve upon this interest alignment through various methods, including the use of stock options for equity grants, the use of long-term price performance targets in the award granted to our Chief Executive Officer and various profit metrics in the bonus plan.
We have implemented executive compensation policies and practices that reinforce our compensation philosophy and align with those commonly-viewed best practices and sound governance principles that we believe are appropriate for us. The following chart summarizes these policies and practices:
PRACTICES WE FOLLOW
| | 100% independent directors on our compensation committee |
| | Annual review and approval of our compensation strategy |
| | Independent compensation consultant engaged by our compensation committee |
| | Performance-based cash incentives |
| | Significant portion of executive compensation is either tied to corporate performance directly or indirectly through stock price performance because of the equity component of compensation |
| | We have continued to shift our vesting practices to incentivize retention and a long-term leadership approach by using either five-year or seven-year vesting periods, with vesting weighted more heavily in the back years |
| | For most equity awards, we have shifted our vesting practices to use five-year vesting periods |
18
Table of Contents
| | Generally, we use five-year vesting upon hiring, as well as for subsequent grants |
| | Depending on the circumstances, awards may vest 20% per year on a straight-line basis or in a back-end loaded schedule where larger amounts vest in later years |
| | We have been more frequently using the back-end loaded vesting structure and shifting from awards that vest on a straight-line basis in order to create longer term incentives for performance |
| | Five-year vesting structures that are not straight-line vesting may vest in several different ways including, by way of example: |
| | 15% in year one; 15% in year two; 20% in year three; 25% in year four; and 25% in year five; or |
| | 10% in year one; 10% in year two; 20% in year three; 30% in year four; and 30% in year five |
| | Prohibition on short sales, hedging of stock ownership positions and transactions involving derivatives of our common stock |
| | In May 2018, the board adopted stock ownership guidelines applicable to all directors and executive officers of the Company in order to further align the financial interest of our directors and executive officers with the interest of our investors |
| | Our Chairman and Chief Executive Officer, Mr. Friedman, has consistently maintained a significant equity ownership interest in the Company and, as of May 23, 2019, beneficially owns approximately 31.0% of the Companys common stock which, based on the average closing price for RH stock for fiscal 2018, was valued at approximately 468.5 times his annual base salary for fiscal 2018(1), far above the multiple of six times salary minimum ownership requirement |
| | Broad-based company-sponsored health and retirement benefits programs |
PRACTICES WE AVOID
| | No single trigger change of control benefits |
| | No post-termination retirement- or pension-type non-cash benefits or perquisites for our executive officers that are not available to our employees generally |
| | No hedging or derivative transactions involving our securities by directors, officers, employees or other insiders |
| | We have not repriced or bought out underwater stock options |
| | No acceleration of share vesting generally instead, we have simple customary levels of severance protection commensurate with a senior position |
| | No tax gross-ups for change of control benefits |
| | No defined value pensions or long term cash incentives like supplemental retirement plans or other forms of long-term deferred compensation |
| | No equity awards for management with short-term restrictions or vesting, such as one-, two- or three-year vesting |
| (1) | Based on shares owned directly, shares owned indirectly and reported as beneficially owned for Section 16 reporting purposes, and the in the money value of stock options, restricted stock and restricted stock units that are no longer subject to vesting or selling restrictions. |
COMPENSATION COMMITTEE INTERLOCKS AND INSIDER PARTICIPATION
No member of the compensation committee has served as one of our officers or employees at any time. None of our executive officers serves as a member of the compensation committee of any other company that has an executive officer serving as a member of our board of directors. None of our executive officers serves as a member of the board of directors of any other company that has an executive officer serving as a member of our compensation committee. None of our directors or executive officers are members of the same family.
COMPENSATION COMMITTEE REVIEW OF COMPENSATION
Our board of directors has established a compensation committee that is generally responsible for the oversight, implementation and administration of our executive compensation plans and programs.
19
Table of Contents
The compensation committee engages in the following, either together with the board of directors as a whole or as a committee, making recommendations to the board of directors regarding approval, as necessary:
| | Annually review and approve the Companys corporate goals and objectives relevant to compensation of the Chief Executive Officer; |
| | Evaluate the Chief Executive Officers performance in light of such goals and objectives; |
| | Determine and approve the Chief Executive Officers compensation level based on this evaluation; |
| | Annually review the following: |
| | Annual base salary levels; |
| | Annual incentive compensation levels; |
| | Long-term incentive compensation levels; and |
| | Any supplemental or special benefits |
| | Ensure that appropriate overall corporate performance measures and goals are set and determine the extent to which the established goals have been achieved and any related compensation earned; |
| | Determine the appropriateness of, and in some cases retain, a compensation consultant to offer advice for the consideration of the compensation committee and consider the independence of such consultant in accordance with applicable SEC and NYSE rules; and |
| | Perform other necessary tasks related to the implementation and administration of executive compensation plans and programs. |
The compensation committees annual review of executive compensation generally occurs within the timeframe of April to June of each year.
COMPENSATION LEVEL SETTING PROCESS
Our compensation committee reviews the following, among other factors, when determining compensation:
| | The individuals performance and contributions to financial objectives; |
| | Equity awards previously granted to the executive, which includes amounts of such awards that remain unvested or are under selling restrictions and therefore continue to incentivize future performance; |
| | Individual leadership, expectations, expertise, skill, and knowledge; |
| | Overall compensation, including base salary and bonus opportunity, as a whole; |
| | Analyses of competitive market compensation practices and labor market conditions; |
| | Alignment with the long-term business strategy of the Company; |
| | Retention and succession planning; |
| | Input from senior management, including our Chairman and Chief Executive Officer; and |
| | Input from an independent compensation consultant. |
As we are headquartered in the San Francisco Bay Area, which is a highly dynamic and competitive market for talent, we seek to provide competitive compensation practices for our executive leadership in order to attract and retain the best available talent.
To set a competitive, reasonable and appropriate level of compensation, the board of directors and the compensation committee take a holistic approach and considers all relevant factors to the compensation decision being made in any given year. The board of directors and the compensation committees approach to evaluating these factors is subjective, not formulaic, and may place more or less weight on a particular factor when determining a particular executive officers compensation.
ROLE OF MANAGEMENT IN DETERMINING EXECUTIVE COMPENSATION
In determining the total compensation for each executive officer, the board of directors and the compensation committee consider the specific recommendations of our Chairman and Chief Executive Officer (other than with respect to his own compensation) and may consider input from other senior members of management.
20
Table of Contents
Our Chairman and Chief Executive Officer plays a significant role in the compensation setting process for the other named executive officers by:
| | Evaluating their performance; |
| | Discussing the role and responsibilities of the relevant executive officer within the Company and the expected future contributions of the executive officer; |
| | Considering retention and succession planning; |
| | Recommending business performance targets and establishing objectives; and |
| | Recommending salary levels, bonuses and equity awards. |
Our Chairman and Chief Executive Officer annually reviews the compensation paid to other named executive officers over the fiscal year through presentations to the compensation committee, either as a committee or together with the board of directors as a whole, and provides his recommendations regarding the compensation to be paid to such persons during the next year. Following a review of such recommendations, the board of directors or the compensation committee, after reviewing the other factors and input as discussed above, takes action regarding such compensation recommendations as it deems appropriate. The board of directors and the compensation committee also consider input from our Chairman and Chief Executive Officer, as well as our Chief Financial Officer and certain of our Presidents, when setting financial objectives for our performance-based incentive program.
Our executive compensation program is designed to reward successful annual performance while encouraging long-term value creation for our shareholders. Short- and long-term incentive compensation is subject to rigorous, objective, at-risk performance hurdles across our performance metrics and performance periods, which the compensation committee intends to be an incentive to management to drive Company performance and encourage prudent risk management consistent with the Companys financial and strategic goals.
ROLE OF COMPENSATION CONSULTANTS
The compensation committee has periodically engaged compensation consultants to assist the committee in assessing compensation market conditions. Willis Towers Watson, which advised the compensation committee with respect to our executive and board compensation programs for fiscal 2015, was initially engaged by the compensation committee to provide evaluations and recommendations concerning our executive and board compensation programs and to advise the compensation committee with respect to structuring our compensation plans to achieve our business objectives for fiscal 2016.
On January 14, 2017, Mercer was engaged by the compensation committee to provide evaluations and recommendations concerning our executive and board compensation programs and to advise the compensation committee with respect to structuring our compensation plans to achieve our business objectives for fiscal 2017. Mercer has continued to provide evaluations and recommendations concerning our executive and board compensation programs and to advise the compensation committee with respect to structuring our compensation plans to achieve our business objectives for fiscal 2018 and fiscal 2019.
During their respective terms in fiscal 2016, and in fiscal 2017 and 2018, each of Willis Towers Watson and Mercer conducted research as directed by the compensation committee and supported the compensation committee in the design of executive and board compensation. Although Willis Towers Watson and Mercer each worked with management to develop plans that support our business objectives while carrying out its duties for the compensation committee, each of Willis Towers Watson and Mercer was retained by and reports directly to the compensation committee and does not provide any other services to the Company other than those approved by the compensation committee that would not constitute a conflict of interest or that would not otherwise compromise their independence.
ANALYSES OF COMPETITIVE MARKET PRACTICES
Due to the unique nature of our Company and the lack of direct industry competitors, we do not engage in a formal benchmarking process in setting compensation. Instead, we consider from time to time, as the compensation committee deems appropriate, an array of available data and information in order to assess the competitiveness of our compensation program and philosophy, including market information concerning local and national market compensation practices that are determined to be relevant to the Company. Given the location of our corporate headquarters in the San Francisco Bay Area, we pay close attention to the opportunities that exist for executives at other growth companies, both inside and outside the retail industry, located in the San Francisco Bay Area, including public companies, as well as private companies that could be candidates for an initial public offering in the future.
21
Table of Contents
We conducted a comprehensive review of market compensation practices for executive officer compensation in fiscal 2016 and then again conducted a review in relation to our review of our Chief Executive Officers compensation at the time of setting his fiscal 2017 multi-year equity grant. At such times, the compensation committee reviewed the compensation practices of a number of companies, including companies of similar size to us, companies that have out-performed the market consistently in terms of growth and return measures, other brand and retail companies, particularly specialty retail companies, and companies in the technology sector. In addition, the compensation committee reviewed data related to a number of companies with headquarters located on the West Coast (in particular, in the San Francisco Bay Area), regardless of size, because we believe such companies located on the West Coast have unique hiring and compensation practices, which are important for us to consider given the location of our headquarters and the talent pool from which we hire our executive and other employees.
In addition, Mercer also provided the compensation committee with data from their own review of proxy information. The result of this analysis is a comprehensive review of the elements of compensation and practices that are determined to be relevant in setting compensation for our executive officers.
In connection with the comprehensive review of market compensation practices, the Company and the compensation committee consider the executive compensation practices and the market data only as reference points in the review of the Companys compensation practices, but do not benchmark or use market data in order to set compensation for the executive officers and other executives of the Company.
For fiscal 2018, total compensation of the Companys named executive officers and other executives was generally within the range of the market data referenced above, although individuals may be compensated above or below this level based on various reasons, such as competitive factors, our financial and operating performance and consideration of individual performance and experience.
EXECUTIVE COMPENSATION COMPONENTS
The principal components of our compensation program for our named executive officers are summarized in the chart below, which is followed by a detailed explanation of the principal components of our compensation program for our named executive officers. In determining our named executive officers overall compensation program, the compensation committee and the board of directors, as applicable, each considers how a particular component motivates performance and promotes retention and sound long-term decision-making.
| COMPENSATION ELEMENTS | OBJECTIVES | |
| Annual base salary | Compensate for services rendered during the fiscal year. | |
| Performance-based annual cash incentives | Motivate and reward our named executive officers for specific annual financial and/or operational goals and objectives. | |
| Long-term equity incentive compensation | Attract and retain our named executive officers and align the financial rewards paid to our named executive officers with our long-term performance and the financial interests of our shareholders. | |
| Perquisites and other personal benefits | Provide a competitive level of perquisites to better enable us to attract and retain superior employees for key positions. | |
| Employment agreements; severance and change of control benefits | Promote stability and continuity of senior management. | |
Annual Base Salary
We provide our named executive officers with an annual base salary to compensate them for services rendered during the fiscal year. The base salary for each of the named executive officers is guided by a variety of factors, which may include market information regarding salary levels for positions that are deemed relevant for comparison purposes, as well as such individuals work experience, personal performance, responsibilities and other considerations, including internal alignment. The relative weight given to each factor is not specifically quantified and varies with each individual at the discretion of the compensation committee and/or the board of directors.
22
Table of Contents
Each named executive officers base salary is typically reviewed annually and is adjusted from time to time on the following bases: evaluation of the executive officers personal performance for the year; the recommendations of our Chairman and Chief Executive Officer (other than with respect to his own base salary); the Companys performance for the year; the competitive marketplace for executives in comparable positions, including market information regarding salary levels for positions that are deemed relevant for comparison purposes; and in the case of increases in base salary other than on an annual basis, an individuals exceptional performance, or increased responsibilities.
During its annual review of executive compensation for fiscal 2018, the compensation committee reviewed data provided by Mercer and compared that data to each executives current cash compensation. As part of their review, the compensation committee in particular considered, in addition to other factors listed above, our financial performance in 2018 and continued focus on multiple long-term key strategies, including transforming our real estate platform, expanding our product offering and increasing our market share, architecting a new operating platform, elevating the customer experience, increasing operating margins, optimizing the allocation of capital in the business and maximizing cash flow, and pursuing international expansion. Following this review, the base salaries of certain of our named executive officers were increased in fiscal 2018, with salary amounts as follows:
| NAME | BASE SALARY | PERCENTAGE INCREASE |
||||||||||
| FISCAL 2017 | FISCAL 2018 | |||||||||||
| Gary Friedman |
$ | 1,250,000 | $ | 1,250,000 | 0 | % | ||||||
| Ryno Blignaut(1) |
n/a | $ | 750,000 | n/a | ||||||||
| Karen Boone(2) |
$ | 750,000 | $ | 775,000 | 3.33 | % | ||||||
| Eri Chaya |
$ | 850,000 | $ | 950,000 | 11.76 | % | ||||||
| DeMonty Price |
$ | 700,000 | $ | 850,000 | 21.43 | % | ||||||
| David Stanchak |
$ | 650,000 | $ | 700,000 | 7.69 | % | ||||||
| (1) | Mr. Blignaut was hired on August 14, 2018. Mr. Blignaut left the Company in March 2019 due to health considerations, at which time Jack Preston assumed the role of Chief Financial Officer. |
| (2) | Ms. Boone left the Company in November 2018. |
With our continued focus on the transformation of our business and executing a new business model, including the particular focuses on execution, architecture and cash and capital allocation, the Company implemented changes to our organizational design, including by streamlining and realigning our home office operations. This included significant changes in the responsibilities taken on by DeMonty Price, our President, Chief Operating, Service and Values Officer, who took on the responsibility over our supply chain, outlet and call center operations, Eri Chaya, our President, Chief Creative and Merchandising Officer, who took on additional roles and responsibilities due to the departure of our former President, Chief Merchandising and Business Development Officer, and David Stanchak who was promoted at the end of fiscal 2017 to President, Chief Real Estate and Development Officer. These changes in the responsibilities of such officers were accompanied by a simplification of our organizational structure and design as part of our constant efforts to reevaluate, refine and streamline the management organizational structure and design in order to meet the needs of the business as our business transforms and evolves. As a result of this reorganization and increased set of roles and responsibilities by such officers, the compensation committee made commensurate increases to their respective salaries.
Performance-Based Annual Cash Incentives
We have adopted the Leadership Incentive Program, or LIP, which is a cash-based incentive compensation program designed to motivate and reward annual performance for eligible employees, including our named executive officers. The compensation committee considers annually whether LIP bonus targets should be established for the year and, if so, approves the group of employees eligible to participate in the LIP for that year. The LIP includes various incentive levels based on the participants position with the Company. Cash bonuses under the LIP link a significant portion of the named executive officers total cash compensation to our overall performance.
The LIP bonus for our named executive officers is based on achievement of financial objectives, rather than individual performance, in order to focus the entire senior management team on the attainment of enterprise-wide financial objectives. Each named executive officer is provided a target bonus amount equal to a percentage of the eligible portion of such officers base salary (which eligible portion is based on the salary earned during the fiscal year). The target bonus amount is based on the Company meeting the target achievement level for the relevant financial objectives.
23
Table of Contents
The compensation committee and/or the board of directors establishes the target achievement level at which 100% of such participants target bonus will be paid (the 100% Achievement Level), the minimum threshold achievement level at which 20% of the participants target bonus will be paid (the 20% Achievement Level) and the achievement level at which 200% of the participants target bonus will be paid (the 200% Achievement Level). The exact amount of the bonus payable under the LIP is based on the level of achievement of such financial objectives, with the bonus amount increasing for each named executive officer as a percentage of the eligible portion of such officers base salary to the extent the achievement of such financial objectives for the fiscal year exceeds the 100% Achievement Level, and with the bonus amount decreasing as a percentage of base salary to the extent the achievement of such financial objectives for the fiscal year is below the 100% Achievement Level (but above the 20% Achievement Level). The compensation committee also may adopt separate minimum or maximum payout amounts for certain individuals under the LIP. The LIP is structured so that no bonuses are paid under the LIP unless we meet the 20% Achievement Level.
The compensation committee, either as a committee or with the board of directors as a whole, sets the financial objectives each year under the LIP, and the payment and amount of any bonus depends upon whether we achieve at least a certain percentage of the financial objectives under the LIP (at least 20% for fiscal 2018). The compensation committee, either as a committee or with the board of directors as a whole, generally establishes such objectives for the Company at levels that it believes can be reasonably achieved with strong performance over the fiscal year. In making the determination of minimum and target levels, the compensation committee and/or the board of directors may consider the specific circumstances facing our Company during the year and our strategic plan for the year. The compensation committee and the board of directors have discretion to interpret the LIPs performance objectives in light of relevant factors both internal and external to the Company, and to adjust the amount paid under the LIP accordingly. The compensation committee and the board of directors exercise such discretion based on business judgment, taking into account both recurring and extraordinary factors affecting performance of the Company as well as other relevant factors. The compensation committee may consult the board of directors, as deemed necessary, with respect to material issues concerning the administration of the LIP, including interpretations of the terms of the LIP.
For fiscal 2018, the performance metric for the LIP was based on adjusted net income (Adjusted Income), which we define as consolidated income before taxes, adjusted for the impact of certain non-recurring and other items that we do not consider representative of our ongoing operating performance. We believe that Adjusted Income provides meaningful information regarding the performance of our business and facilitates a meaningful evaluation of operating results on a comparable basis with historical results. We do not adjust for depreciation or amortization. Therefore, Adjusted Income indirectly reflects the Companys capital use and capital expenditures, which are important factors of our long-term business strategy. We believe the use of Adjusted Income is relevant in assessing overall performance of the Company and aligns this performance metric with the interests of shareholders. Our management uses this non-GAAP financial measure in order to have comparable financial results to analyze changes in our underlying business from quarter to quarter.
For fiscal 2018, the compensation committee approved the following targets under the LIP:
| ACHIEVEMENT LEVEL | ADJUSTED INCOME BEFORE TAX |
CHANGE FROM FISCAL 2017 | ||
| 20% |
$ 169 million | increase of approximately $66 million | ||
| 100% |
$ 218 million | increase of approximately $60 million | ||
| 200% |
$ 280 million | increase of approximately $73 million |
In fiscal 2018, LIP targets were established based upon the Companys operating plans and objectives for fiscal 2018 which in turn were formulated in part based upon the results for fiscal 2017. The compensation committee sets the LIP targets with the objective of encouraging the management team to drive financial performance based upon the Companys operating plan and financial objectives for the year in question.
The following table sets forth the bonus targets as a percentage of the eligible portion of the executives base salary under the LIP in fiscal 2018 for our executive officers at the 20% Achievement Level, the 100% Achievement Level and the 200% Achievement Level. During its annual review of the LIP and bonus targets for the executive officers for fiscal 2018, the compensation committee determined not to make any changes to the bonus targets as a percentage of the eligible portion of the executives base salary for Mr. Friedman, Ms. Chaya, Mr. Price and Mr. Stanchak from such targets for fiscal 2017.
| ACHIEVEMENT LEVEL | GARY FRIEDMAN |
RYNO BLIGNAUT(1) |
KAREN BOONE(2) |
ERI CHAYA |
DEMONTY PRICE |
DAVID STANCHAK |
||||||||||||||||||
| Below 20% |
0 | % | 0 | % | 0 | % | 0 | % | 0 | % | 0 | % | ||||||||||||
| 20% |
20 | % | 10 | % | 10 | % | 10 | % | 10 | % | 10 | % | ||||||||||||
| 100% |
125 | % | 50 | % | 50 | % | 50 | % | 50 | % | 50 | % | ||||||||||||
| 200% |
250 | % | 100 | % | 100 | % | 100 | % | 100 | % | 100 | % | ||||||||||||
| (1) | Mr. Blignaut was hired on August 14, 2018. Mr. Blignaut left the Company in March 2019 due to health considerations, at which time Jack Preston assumed the role of Chief Financial Officer. |
| (2) | Ms. Boone left the Company in November 2018. |
24
Table of Contents
In March 2019, the compensation committee reviewed our financial results related to the LIP targets set in the prior year, and determined that the Company reached the 170% Achievement Level with respect to the Companys financial objectives. In fiscal 2018, the Company substantially exceeded its targets under the LIP due to the Companys ongoing acceleration in financial performance. The compensation committee determined that Adjusted Income for fiscal 2018 for purposes of the LIP was approximately $261.2 million, which reflected the compensation committees determination that certain other extraordinary or non-recurring items should also be excluded from determining Adjusted Income for purposes of the LIP. The $261.2 million represents a 71% year-over-year increase from prior year results. Accordingly, the compensation committee approved payment of the bonuses earned under the LIP for our named executive officers as follows:
| NAME | FISCAL 2018 | CHANGE FROM FISCAL 2017 BONUS AS % OF BASE SALARY |
||||||||||||||
| BONUS EARNED UNDER THE LIP |
ELIGIBLE PORTION OF BASE SALARY |
BONUS EARNED AS % OF ELIGIBLE BASE SALARY |
||||||||||||||
| Gary Friedman |
$ | 2,664,063 | $ | 1,250,000 | 213 | % | 100 | % | ||||||||
| Ryno Blignaut (1) |
n/a | n/a | n/a | n/a | ||||||||||||
| Karen Boone (2) |
n/a | n/a | n/a | n/a | ||||||||||||
| Eri Chaya |
$ | 781,302 | $ | 916,538 | 85 | % | 40 | % | ||||||||
| DeMonty Price |
$ | 681,766 | $ | 799,808 | 85 | % | 40 | % | ||||||||
| David Stanchak |
$ | 582,464 | $ | 683,269 | 85 | % | 40 | % | ||||||||
| (1) | Mr. Blignaut was hired on August 14, 2018. Mr. Blignaut left the Company in March 2019 due to health considerations, at which time Jack Preston assumed the role of Chief Financial Officer. |
| (2) | Ms. Boone left the Company in November 2018. |
The LIP provides substantial variation in compensation from year to year based upon the achievement of financial performance objectives. In prior years, we have paid bonuses under the LIP based on financial performance that has exceeded targets (in the case of fiscal 2014, based on achievement of 106% of target objectives) and that has partially met targets (in the case of fiscal 2015, based on achievement of 30% of target objectives and in the case of fiscal 2017, based on the achievement of 90% of target objectives), and we have not paid bonuses under the LIP when the Company has not met targets (in the case of fiscal 2016, based on achievement of less than 20% of target objectives).
Mr. Blignaut, who was hired on August 14, 2018, was not eligible for a cash bonus payable under the 2018 LIP due to his departure from the Company in March 2019. The compensation committee determined to provide him with a discretionary bonus for fiscal 2018 in the amount of $171,000 in recognition of his assistance with the transition of his roles and responsibilities to Mr. Preston, the Companys current Chief Financial Officer.
Long-Term Equity Incentive Compensation
We believe that providing long-term incentives as a component of compensation helps us to attract and retain our named executive officers. These incentives also align the financial rewards paid to our named executive officers with our long-term performance, thereby encouraging our named executive officers to focus on our long-term performance goals.
In June and August 2018, the compensation committee performed its annual review of executive compensation, including a review of the Companys annual share usage, or burn rate, and equity use as they relate to equity grants for executive officers to determine if such grants were appropriate and in line with our compensation philosophy and objectives. The compensation committee also took into consideration (i) Mr. Friedmans recommendations, other than with respect to his own compensation, (ii) the competitive environment for executive talent in the San Francisco Bay Area, (iii) each executive officers current equity holdings and the present value thereof and (iv) the Companys continued desire to align its executive officers long-term
25
Table of Contents
interests with those of our shareholders. The compensation committees determinations regarding equity grants for executive officers for 2018 were also influenced by the desire to provide additional retention incentives to the Companys executive officers, and the level of awards approved by the compensation committee took into account this desire to include a retention feature in the awards. The compensation committees determinations regarding equity grants for employees for 2018 were also influenced by the desire to manage the annual share usage, or burn rate, and thus the compensation committee elected to substantially limit new equity grants and scale back new hire awards in fiscal 2018.
In fiscal 2018, the compensation committee reviewed the grants of equity awards to the executive officers. In fiscal 2017, the compensation committee determined to award Mr. Friedman a multi-year equity award with performance conditions tied to stock price performance. Consistent with the compensation committees determination that such fiscal 2017 equity award be a multi-year grant, the compensation committee did not make equity awards to Mr. Friedman in fiscal 2018 or fiscal 2019. See 2017 Stock Option Award to Chairman and Chief Executive Officer below for further detail regarding the multi-year equity award.
In fiscal 2018, the compensation committee determined to make additional equity awards to the other named executive officers. The compensation committee approved grants of stock options to the named executive officers, as follows:
| NAME | STOCK OPTIONS |
RESTRICTED STOCK UNITS |
||||||
| Gary Friedman |
| | ||||||
| Ryno Blignaut |
100,000 | (1) | | |||||
| Karen Boone |
25,000 | (2) | | |||||
| Eri Chaya |
50,000 | (3) | | |||||
| DeMonty Price |
50,000 | (3) | | |||||
| David Stanchak |
25,000 | (2) | | |||||
| (1) | The stock options were granted at an exercise price of $153.10 per share, the fair market value of our common stock on August 14, 2018, the date of grant. The options vest at a rate of 20% per year over five years on each anniversary of the date of grant, and expire in 10 years, subject to the named executive officers continued service with the Company. |
| (2) | The stock options were granted at an exercise price of $109.87 per share, the fair market value of our common stock on June 6, 2018, the date of grant. The options vest on each anniversary of the date of grant with 2,500 options on each of years 1 and 2, 5,000 options on each of years 3 and 4 and 10,000 options on year 5, and expire in 10 years, subject to the named executive officers continued service with the Company. |
| (3) | The stock options were granted at an exercise price of $109.87 per share, the fair market value of our common stock on June 6, 2018, the date of grant. The options vest on each anniversary of the date of grant with 5,000 options on each of years 1 and 2, 10,000 options on each of years 3 and 4 and 20,000 options on year 5, and expire in 10 years, subject to the named executive officers continued service with the Company. |
We recently shifted our compensation practices towards the exclusive use of stock options, in lieu of full value awards such as restricted stock units, as part of our long-term equity incentive plan. We believe this shift, by rewarding the executives for creating upside gains in the share prices, creates the right incentives for our executives to drive performance and better align the long-term incentives of our executives with that of the long-term view of our shareholders. We found the use of other instruments such as restricted stock units did not significantly differentiate itself from cash compensation. As a high-growth company, we believe the use of stock options aligns our executives with the expectation of shareholders for the Company to exceed and increase its value overtime.
2017 Stock Option Award to Chairman and Chief Executive Officer
On May 2, 2017, the compensation committee granted a stock option to Mr. Friedman under the 2012 Stock Incentive Plan to purchase 1,000,000 shares of the Companys common stock with certain selling restrictions tied to stock price appreciation, with a ten year term and an exercise price of $50 per share, a premium to the market price for the common stock on the date of the grant. Selling restrictions attached to the shares only lapse upon the achievement of both certain stock price-based performance objectives and certain time-based service period requirements, as further described below. The compensation committee believes that the combination of time-based restrictions and performance-based restrictions tied to stock price appreciation creates a strong alignment between Mr. Friedman and the objectives of the Companys shareholders. As previously disclosed, the 2017 Stock Option Award was structured to be a multi-year award covering a four year period, similar to the 2013 award that was previously in place for four years. Consistent with this expectation the compensation committee did not grant Mr. Friedman an additional equity award in fiscal 2018 or fiscal 2019. The key terms of the 2017 Stock Option Award are:
26
Table of Contents
| | The 2017 Stock Option Award may be exercised at any time but the selling restrictions on the underlying shares would only lapse upon the Companys common stock price achieving price objectives of $100 per share, $125 per share and $150 per share and Mr. Friedman remaining in service through the achievement of such stock price performance requirements. |
| | To achieve any given price target, the Companys weighted average stock price, measured over a period of the last ten trading days on a volume weighted average price, must remain at or above the dollar thresholds stated above for twenty consecutive trading days (i.e., a trailing ten day average minimum price that must be sustained for twenty consecutive trading days). |
| | Stock price performance is measured annually over a performance year, and the selling restrictions may lapse for up to one-quarter of the award in any given performance year. A performance year is any twelve-month period that begins on May 2nd. With respect to any given performance year, if the twenty day average trading price as described above for RH common stock exceeds $100 per share, $125 per share, or $150 per share during such performance year, then the selling restrictions will lapse as to a maximum of 83,333 shares, 166,666 shares, or 250,000 shares, respectively, on the last day of such performance year, if Mr. Friedman remains in service with RH as an employee with the authority, duties, or responsibilities of a chief executive officer at such date. |
| | Any share selling restrictions that have not lapsed by the end of the eighth performance year will thereafter only lapse on the twentieth anniversary of the grant date. As a result, if the stock price goals are not achieved by the eighth performance year, the underlying shares issuable upon any exercise of the option could not be sold until the twentieth anniversary of the grant date and RH would have certain rights to repurchase such shares at a point in time after exercise using an unsecured promissory note. |
The following table quantifies the stock price appreciation from the date of grant that would be required to achieve each price objectives:
| PRICE TARGET ($) | PREMIUM TO GRANT DATE STOCK PRICE (%) |
|||||||
| Exercise Price |
$ | 50 | 2.8 | % | ||||
| Performance Targets |
$ | 100 | 105.7 | % | ||||
| $ | 125 | 157.1 | % | |||||
| $ | 150 | 208.5 | % | |||||
The following chart presents graphically the number of shares that would be eligible to have selling restrictions lapse in each year of the first four anniversaries of the date of grant at the various stock price objectives:
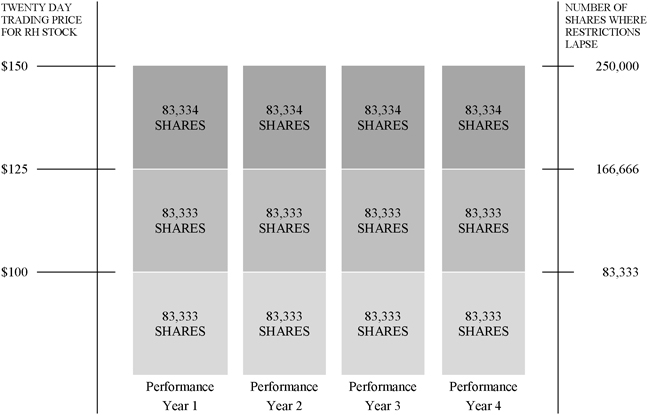
27
Table of Contents
During the first performance year, which ended on May 1, 2018, the $100 stock price performance objective was not achieved even though the stock price traded above $100 per share on 35 separate trading days during such year. The reason such target was not achieved is a function of the requirement that the stock price remain above the price target for twenty consecutive trading days and that the price is measured on each day as a ten-day average price. These features have the effect of requiring that the stock remain above the target price objective for a sustained period of time. Given that none of the stated price levels were met before May 1, 2018, the 250,000 options for which selling restrictions were eligible to lapse as early as the end of the first year after the date of grant were carried forward into future years up until the end of the eighth year from the date of the grant.
During the second performance year, which ended on May 1, 2019, the $100 stock price performance objective was achieved and the $125 stock price performance objective was achieved. As a result, the selling restrictions on 333,332 of the shares under the option have lapsed, as follows: (a) the selling restrictions for the carried over shares from the first performance year lapsed as to (i) 83,333 shares on June 12, 2018, the date on which the $100 stock price was met, and (ii) 83,333 shares on July 16, 2018, the date on which the $125 stock price was met and (b) the selling restrictions as to 166,666 shares from the second performance year lapsed on May 1, 2019. The $150 stock price performance objective was not achieved even though the stock price traded above $150 per share on 29 separate trading days during the year ended May 1, 2019, again due to the requirement that the stock price remain above the price target for twenty consecutive trading days and that the price is measured on each day as a ten-day average price.
In its annual review of executive compensation, the compensation committee affirmed the effectiveness of the multi-year equity structure. As of February 2, 2018, the last trading day of fiscal 2017, the closing price of our common stock was $92.04 per share. As of February 1, 2019, the last trading day of fiscal 2018, the closing price of our common stock was $133.64 per share. The multi-year structure is believed to incentivize Mr. Friedman and align him with a long-term view in leading the Company and avoids, among other things, the unnecessary annual distraction that most other companies face in having to address renegotiations of executive compensation with their chief executive officer.
The compensation committee believes that the structure of the 2017 Stock Option Award was well designed and provides the right incentives to Mr. Friedman as the committee believes that this award structure is contributing to RHs financial and stock price performance.
If Mr. Friedmans employment with RH is (i) terminated by RH without cause, (ii) terminated by Mr. Friedman for good reason (as such terms are defined in the option award agreement), or (iii) terminated for death or disability (as such term is defined in the option award agreement), then any selling restrictions on shares subject to the 2017 Stock Option Award that would have been eligible to lapse at any time during the twelve-month period following such termination had such termination not occurred will be eligible to lapse based solely upon the achievement of the stated price levels at any point during such twelve-month period. For further details regarding the option award agreement, see the Companys Current Report on Form 8-K filed on May 3, 2017.
Perquisites and Other Personal Benefits
We provide certain named executive officers with perquisites and other personal benefits that we and the compensation committee believe are reasonable and consistent with our overall compensation program to better enable us to attract and retain superior employees for key positions. We generally provide our named executive officers a car allowance, which is adjusted from time to time based on expenses incurred by our executive officers in connection with their travel to local retail locations and expenses related to fuel, tolls and parking. The compensation committee periodically reviews the levels of perquisites and other personal benefits provided to the named executive officers.
The named executive officers may not defer any component of any annual incentive bonus earned and do not participate in another nonqualified deferred compensation plan. Likewise, the Company does not maintain any defined benefit pension plans for its employees. However, our named executive officers are eligible to participate in the Companys 401(k) savings plan, as well as the Companys group health and welfare plans, on the same terms and conditions as other Company employees.
It has been our practice to provide key executive officers with relocation benefits in connection with their initial hiring by our Company. In some instances, newly hired key executives are provided a signing or guaranteed minimum bonus in order to assist with their transition into the Company and the San Francisco Bay Area or for other reasons. However, relocation incentives or benefits may be subject to repayment if the executive does not remain with the Company for the period of time specified in his or her offer documents. None of our named executive officers received such benefits in fiscal 2018.
28
Table of Contents
In addition, from time to time, the compensation committee may approve cash bonuses outside of the LIP on a discretionary basis for reasons such as individual performance or in connection with an executive officers initial employment arrangement with the Company or other events, and such bonus awards may overlap with bonus awards paid under the LIP. Payments of discretionary bonuses to our named executive officers, if any, are disclosed in the Bonus column of the Summary Compensation Table in this Amendment. None of our named executive officers received a discretionary bonus in fiscal 2018, with the exception of Mr. Blignaut, who received a discretionary bonus for fiscal 2018 in recognition of his assistance with the transition of his roles and responsibilities to Mr. Preston, the Companys current Chief Financial Officer, as well as the fact that he was not eligible for a LIP bonus by the terms of the plan due to his departure from the Company.
Employment Agreements; Severance and Change of Control Benefits
We have entered into agreements with certain key employees, including certain of the named executive officers, which agreements provide severance benefits in the event of certain terminations of employment. These severance protection agreements are designed to promote stability and continuity of senior management. Information regarding amounts that would be payable under such agreements for the named executive officers is provided under the heading Potential Payments Upon Termination and Change in Control in this Amendment. None of our employment agreements or other policies have tax gross-up features. In the event that any termination payments made to our Chairman and Chief Executive Officer are deemed under Section 280G of the U.S. Internal Revenue Code of 1986, as amended (the Code), to constitute excess parachute payments subject to an excise tax, then such payments will be payable either (i) in full or (ii) as to such lesser amount that would result in no portion of such payments being subject to the excise tax, and our Chairman and Chief Executive Officer will receive the greater, on an after-tax basis, of (i) or (ii) above, as determined by an independent accountant or tax advisor selected by our Chairman and Chief Executive Officer and paid for by the Company.
RISK CONSIDERATIONS IN OUR COMPENSATION PROGRAM
We conducted an assessment of the Companys compensation policies and practices for its employees and concluded that these policies and practices as currently designed are appropriately weighted among base salaries and short- and long-term incentives such that the Companys employees are not encouraged to take excessive risks. The compensation committee believes that such compensation policies and practices are not reasonably likely to have a material adverse effect on the Company. In reaching this conclusion, the compensation committee reviewed the compensation elements that comprise our compensation program, as well as the objectives that each item is designed to encourage, as described above under Executive Compensation Components.
Anti-Hedging Practices
Our insider trading policy provides that no employee or director may hedge ownership of our stock by engaging in short sales or purchasing and selling derivative securities related to our stock.
Clawback Provisions
Under the Dodd-Frank Wall Street Reform and Consumer Protection Act (Dodd-Frank), public companies will be required to adopt a policy to recover certain compensation in the event of a material accounting restatement. The Company will adopt a clawback policy as required by Dodd-Frank when final regulations are provided by the SEC and the NYSE and become effective.
Stock Ownership by Executives
In May 2018, the Board adopted stock ownership guidelines applicable to all directors and executive officers of the Company in order to further align the financial interest of our directors and executive officers with the interest of our investors. See Corporate Governance & Director IndependenceDirector and Executive Stock Ownership Guidelines.
Our Chairman and Chief Executive Officer, Mr. Friedman, has consistently maintained a significant equity ownership interest in the Company and, as of May 23, 2019, beneficially owns approximately 31.0% of the Companys common stock which, based on the average closing price for RH stock for fiscal 2018, was valued at approximately 468.5 times his annual base salary for fiscal 2018, far above the multiple of six times salary minimum ownership requirement. Additional information regarding the stockholdings of our other named executive officers and directors is set forth in this Amendment in the section entitled Security Ownership of Certain Beneficial Owners and Management.
Tax Deductibility
Section 162(m) of the Internal Revenue Code (Section 162(m)) limits the amount that we may deduct for compensation paid to certain of our executive officers to $1,000,000 per person in any year. Prior to December 22, 2017, when the Tax Cuts and Jobs Act of 2017 (TCJA) was signed into law, compensation that qualified as performance-based was excluded for
29
Table of Contents
purposes of calculating the amount of compensation subject to the $1,000,000 limit. Under the TCJA, this performance-based exception is repealed for taxable years beginning after December 31, 2017, except with respect to certain grandfathered compensation. The compensation committee reviews and considers the deductibility of executive compensation under Section 162(m) when determining the compensation of the Companys executive officers. However, the compensation committee retains the flexibility and discretion to approve compensation that is nondeductible under Section 162(m) as a means to ensure competitive levels of total compensation for our executive officers and promote varying corporate goals. In any event, the compensation committee intends to maintain an approach to executive officer compensation that strongly links pay to performance, and promotes the attraction and retention of qualified executives, but will also take into account tax-effectiveness of different compensation alternatives as it selects the right compensation mix.
CEO Pay Relative to Median Pay of Our Employees
The compensation for our CEO in fiscal 2018 ($3,943,757 as disclosed in the 2018 Summary Compensation Table) was approximately 115 times the annual total compensation, as defined by Item 402(u) of Regulation S-K, of our median employee ($34,416). Total compensation includes base salary, bonus compensation, equity awards and other perquisites and allowances. Our CEO to median employee pay ratio is calculated in accordance with Item 402(u) of Regulation S-K and represents a reasonable estimate calculated in accordance with SEC regulations and guidance. We identified the median employee by examining the gross wages reflected in our payroll records as reported to the Internal Revenue Service on Form W-2 for all individuals, excluding our CEO, who were employed by us on November 15, 2017. We used the same median employee that we identified in fiscal 2017 in determining median employee compensation for fiscal 2018. We included all employees, whether employed on a full-time, part-time, temporary or seasonal basis. We did not make any assumptions, adjustments, or estimates with respect to payroll compensation amounts. After identifying the median employee based on total W-2 payroll compensation, we calculated annual total compensation for such employee using the same methodology we use for our named executive officers as set forth in the 2018 Summary Compensation Table. Our CEO pay relative to the median pay of our employees for fiscal 2018 is significantly lower than the fiscal 2017 ratio because the compensation for our CEO in fiscal 2017 included the value of the fiscal 2017 equity award to Mr. Friedman. As discussed above, the fiscal 2017 equity award was structured as a multi-year award and, consistent with that intent, Mr. Friedman was not granted any equity awards in fiscal 2018. As a result, his fiscal 2018 total compensation was significantly lower than his fiscal 2017 total compensation.
COMPENSATION COMMITTEE REPORT
The information contained in the following report of the Companys compensation committee is not considered to be soliciting material, filed or incorporated by reference in any past or future filing by the Company under the Exchange Act or the Securities Act of 1933, as amended, unless and only to the extent that the Company specifically incorporates it by reference.
The compensation committee has reviewed and discussed the Compensation Discussion and Analysis set forth above with our management. Based on its review and discussions, the compensation committee recommended to our board of directors that the Compensation Discussion and Analysis be included in this Amendment.
Submitted by the compensation committee of the board of directors of RH:
Dr. Leonard Schlesinger (Chairman)
Mark Demilio
COMPENSATION OF NAMED EXECUTIVE OFFICERS
Summary Compensation Table
The following table shows the compensation earned by our named executive officers fiscal 2018, fiscal 2017 and fiscal 2016.
| NAME AND PRINCIPAL POSITION |
FISCAL YEAR |
SALARY | BONUS | STOCK AWARDS(1) |
OPTION AWARDS(1) |
NON-EQUITY INCENTIVE PLAN COMPENSATION(2) |
ALL OTHER COMPENSATION(3) |
TOTAL | ||||||||||||||||||||||||
| Gary Friedman |
2018 | $ | 1,250,000 | $ | | $ | | $ | | $ | 2,664,063 | $ | 29,694 | (6) | $ | 3,943,757 | ||||||||||||||||
|
|
|
|
|
|
|
|
|
|
|
|
|
|
|
|
|
|||||||||||||||||
| Chairman |
2017 | $ | 1,250,000 | $ | | $ | | $ | 23,870,000 | $ | 1,409,375 | $ | 35,095 | (6) | $ | 26,564,470 | ||||||||||||||||
|
|
|
|
|
|
|
|
|
|
|
|
|
|
|
|
|
|||||||||||||||||
| and CEO |
2016 | $ | 1,250,000 | $ | | $ | | $ | $ | | $ | 36,100 | (6) | $ | 1,286,100 | |||||||||||||||||
| Ryno Blignaut(4) President, Chief Financial and Administrative Officer |
2018 | $ | 357,692 | $ | 171,000 | (7) | $ | | $ | 8,594,000 | $ | | $ | 6,000 | $ | 9,128,692 | ||||||||||||||||
| Karen Boone |
2018 | $ | 556,731 | $ | | $ | | $ | 1,560,750 | $ | | $ | 9,000 | $ | 2,126,481 | |||||||||||||||||
|
|
|
|
|
|
|
|
|
|
|
|
|
|
|
|
|
|||||||||||||||||
| Former President, |
2017 | $ | 737,601 | $ | | $ | | $ | | $ | 332,658 | $ | 12,000 | $ | 1,082,259 | |||||||||||||||||
|
|
|
|
|
|
|
|
|
|
|
|
|
|
|
|
|
|||||||||||||||||
| Chief Financial and Administrative Officer |
2016 | $ | 700,000 | $ | | $ | 1,971,000 | $ | 1,733,550 | $ | | $ | 12,000 | $ | 4,416,550 | |||||||||||||||||
30
Table of Contents
| NAME AND POSITION |
FISCAL YEAR |
SALARY | BONUS | STOCK AWARDS(1) |
OPTION AWARDS(1) |
NON-EQUITY INCENTIVE PLAN COMPENSATION(2) |
ALL OTHER COMPENSATION(3) |
TOTAL | ||||||||||||||||||||||||
| Eri Chaya |
2018 | $ | 916,538 | $ | | $ | | $ | 3,121,500 | $ | 781,302 | $ | 12,000 | $ | 4,831,340 | |||||||||||||||||
|
|
|
|
|
|
|
|
|
|
|
|
|
|
|
|
|
|||||||||||||||||
| President, |
2017 | $ | 837,601 | $ | | $ | | $ | | $ | 377,758 | $ | 12,000 | $ | 1,227,359 | |||||||||||||||||
|
|
|
|
|
|
|
|
|
|
|
|
|
|
|
|
|
|||||||||||||||||
| CCO, CMO and Director |
2016 | $ | 800,000 | $ | | $ | 1,971,000 | $ | 1,733,550 | $ | | $ | 12,000 | $ | 4,516,550 | |||||||||||||||||
| DeMonty Price |
2018 | $ | 799,808 | $ | | $ | | $ | 3,121,500 | $ | 681,766 | $ | 12,000 | $ | 4,615,074 | |||||||||||||||||
|
|
|
|
|
|
|
|
|
|
|
|
|
|
|
|
|
|||||||||||||||||
| President, |
2017 | $ | 687,601 | $ | | $ | | $ | | $ | 310,108 | $ | 12,000 | $ | 1,009,709 | |||||||||||||||||
|
|
|
|
|
|
|
|
|
|
|
|
|
|
|
|
|
|||||||||||||||||
| Chief Operating, Service and Values Officer |
2016 | $ | 650,000 | $ | | $ | 2,124,000 | $ | 1,875,944 | $ | | $ | 12,000 | $ | 4,661,944 | |||||||||||||||||
| David Stanchak(5) |
2018 | $ | 683,269 | $ | | $ | | $ | 1,560,750 | $ | 582,464 | $ | 12,000 | $ | 2,838,483 | |||||||||||||||||
|
|
|
|
|
|
|
|
|
|
|
|
|
|
|
|
|
|||||||||||||||||
| President, Chief Real Estate and Development Officer |
2017 | $ | 637,601 | $ | | $ | | $ | 461,404 | $ | 287,558 | $ | 13,853 | (8) | $ | 1,400,416 | ||||||||||||||||
| (1) | Reflects the aggregate grant date fair value of the awards made in fiscal 2018, fiscal 2017 and fiscal 2016, computed in accordance with Financial Accounting Standards Board Accounting Standards Codification Topic 718 (FASB ASC 718) rather than the amount paid to or realized by the named executive officer. See Note 16Stock-Based Compensation to our audited consolidated financial statements contained in the Original Filing. |
| (2) | Reflects the cash awards that our named executive officers received under our LIP for fiscal 2018, fiscal 2017 and fiscal 2016 performance, as applicable. Discretionary bonuses not awarded under the LIP are reflected in the Bonus column above. |
| (3) | Reflects perquisites to the named executive officers in the form of car allowances, except as otherwise noted. |
| (4) | Mr. Blignaut was not a named executive officer prior to fiscal 2018 and, as a result, no disclosure is made for fiscal 2017 and fiscal 2016 in accordance with SEC rules. |
| (5) | Mr. Stanchak was not a named executive officer prior to fiscal 2017 and, as a result, no disclosure is made for fiscal 2016 in accordance with SEC rules. |
| (6) | In fiscal 2018, represents $12,000 in the form of a car allowance and $17,694 in imputed income related to Mr. Friedmans personal use of corporate aircraft. In fiscal 2017, represents $12,000 in the form of a car allowance and $23,095 in imputed income related to Mr. Friedmans personal use of corporate aircraft. In fiscal 2016, represents $12,000 in the form of a car allowance and $24,100 in imputed income related to Mr. Friedmans personal use of corporate aircraft. |
| (7) | Represents a discretionary bonus for fiscal 2018 in recognition of his assistance with the transition of his roles and responsibilities to Mr. Preston, the Companys current Chief Financial Officer. |
| (8) | In fiscal 2017, represents $12,000 in the form of a car allowance and $1,853 in imputed income related to Mr. Stanchaks personal use of corporate aircraft. |
For a description of actions taken by the compensation committee with respect to base salaries of our named executive officers for fiscal 2018, please see section entitled Base Salary in the Compensation Discussion and Analysis section of this Amendment.
For a description of the material terms of the named executive officers employment agreements, please see the section entitled Employment Agreements in this Amendment.
For a description of our Non-Equity Incentive Plan Compensation, please see the section entitled Performance-Based Annual Cash Incentives in the Compensation Discussion and Analysis section of this Amendment. For the compensation committees determination of awards under the LIP for our named executive officers for fiscal 2018, please see the section entitled Performance-Based Annual Cash Incentives in the Compensation Discussion and Analysis section of this Amendment. For the vesting schedules of outstanding equity awards and additional information concerning outstanding equity awards, please see Outstanding Equity Awards at Fiscal Year-End in this Amendment.
Grants of Plan-Based Awards
As further described above in the Compensation Discussion and Analysis section of this Amendment, the named executive officers are eligible to receive an annual cash bonus based on a percentage of their base salary under our LIP. Our Companys financial objectives with respect to the LIP are established each year and the payment and the amount of any bonus depend upon whether our Company achieves those performance goals. The specific amount any participant could receive depends on the level of our performance. The amounts shown in these columns for the named executive officers are based on the following assumptions:
In the threshold column, the amount for each named executive officer reflects the minimum bonus that would be awarded if we reach the 20% achievement level of our financial objectives, which is the minimum achievement level required for bonus payouts under the LIP.
In the target column, the amount for each named executive officer reflects the bonus amount that would be awarded if we reach the 100% achievement level of our financial objectives.
31
Table of Contents
In the maximum column, the amount for each named executive officer reflects the bonus that would be awarded if we reach the 200% achievement level of our financial objectives.
The following table provides information on the possible payouts under our LIP for fiscal 2018 based on certain assumptions about the achievement of performance objectives for our Company and the individual named executive officer at various levels. The following table does not set forth the actual bonuses awarded to the named executive officers for fiscal 2018 under the LIP. The actual bonuses awarded to the named executive officers for fiscal 2018 are reported in the Summary Compensation Table above under the column entitled Non-Equity Incentive Plan Compensation.
| ESTIMATED FUTURE PAYOUTS UNDER NON-EQUITY INCENTIVE PLAN AWARDS(1) |
ALL OTHER STOCK AWARDS: # OF SHARES OF STOCK OR UNITS |
ALL OTHER OPTION AWARDS: # OF SECURITIES UNDERLYING OPTIONS |
EXERCISE OR BASE PRICE OF OPTION AWARDS |
GRANT DATE FAIR VALUE OF STOCK AND OPTION AWARDS (2) |
||||||||||||||||||||||||||||
| NAME | GRANT DATE |
THRESHOLD | TARGET | MAXIMUM | ||||||||||||||||||||||||||||
| Gary Friedman |
| $ | 250,000 | $ | 1,562,500 | $ | 3,125,000 | | | | | |||||||||||||||||||||
| Ryno Blignaut |
| $ | 35,769 | $ | 178,846 | $ | 357,692 | | | | | |||||||||||||||||||||
| 8/14/2018 | | | | | 100,000 | $ | 153.10 | $ | 8,594,000 | |||||||||||||||||||||||
| Karen Boone |
| $ | 76,635 | $ | 383,173 | $ | 766,346 | | | | | |||||||||||||||||||||
| 6/6/2018 | | | | | 25,000 | $ | 109.87 | $ | 1,560,750 | |||||||||||||||||||||||
| Eri Chaya |
| $ | 91,654 | $ | 458,269 | $ | 916,538 | | | | | |||||||||||||||||||||
| 6/6/2018 | | | | | 50,000 | $ | 109.87 | $ | 3,121,500 | |||||||||||||||||||||||
| DeMonty Price |
| $ | 79,981 | $ | 399,904 | $ | 799,808 | | | | | |||||||||||||||||||||
| 6/6/2018 | | | | | 50,000 | $ | 109.87 | $ | 3,121,500 | |||||||||||||||||||||||
| David Stanchak |
| $ | 68,327 | $ | 341,635 | $ | 683,269 | | | | | |||||||||||||||||||||
| 6/6/2018 | | | | | 25,000 | $ | 109.87 | $ | 1,560,750 | |||||||||||||||||||||||
| (1) | Target awards as a percentage of the eligible portion of base salary for the named executive officers are set forth in the section entitled Performance-Based Annual Cash Awards in the Compensation Discussion and Analysis section of this Amendment. |
| (2) | For stock option awards, reflects the aggregate grant date fair value of the awards made in fiscal 2018, computed in accordance with FASB ASC 718. See Note 16Stock-Based Compensation to our audited consolidated financial statements contained in the Original Filing. Amounts shown do not reflect compensation actually received or that may be realized in the future by the named executive officer. The grant date fair value for stock option awards was $62.43 and $85.94 on June 6, 2018 and August 14, 2018, respectively, the two dates on which the stock option awards were made. |
OUTSTANDING EQUITY AWARDS AT FISCAL YEAR-END
The following table shows all outstanding stock options and stock awards held by the named executive officers as of February 2, 2019, the last day of fiscal 2018.
| STOCK OPTION AWARDS | RESTRICTED SHARE AWARDS | |||||||||||||||||||||||
|
NUMBER OF SECURITIES UNDERLYING UNEXERCISED OPTIONS |
SHARES OR UNITS THAT HAVE NOT YET VESTED |
|||||||||||||||||||||||
| NAME | EXERCISABLE (#) | UNEXERCISABLE (#) |
OPTION EXERCISE PRICE ($) |
OPTION EXPIRATION DATE |
NUMBER OF SHARES (#) |
MARKET VALUE ($)(1) |
||||||||||||||||||
| Gary Friedman |
2,976,826 | | $ | 46.50 | 10/31/2022 | | | |||||||||||||||||
| 1,000,000 | | $ | 75.43 | 7/1/2023 | | | ||||||||||||||||||
| 1,000,000 | (2) | | $ | 50.00 | 5/1/2027 | | | |||||||||||||||||
| Ryno Blignaut |
| 100,000 | (3) | $ | 153.10 | 8/13/2028 | | | ||||||||||||||||
| Karen Boone |
| | | | | | ||||||||||||||||||
| Eri Chaya |
95,600 | | $ | 29.00 | 10/31/2022 | | | |||||||||||||||||
| 120,000 | 30,000 | (4) | $ | 61.30 | 5/7/2024 | | | |||||||||||||||||
| 6,000 | 4,000 | (5) | $ | 87.31 | 5/5/2025 | | | |||||||||||||||||
| 30,000 | 70,000 | (6) | $ | 39.42 | 5/3/2026 | | | |||||||||||||||||
| | 50,000 | (7) | $ | 109.87 | 6/5/2028 | | | |||||||||||||||||
| | | | | 25,000 | (16) | $ | 3,341,000 | |||||||||||||||||
| | | | | 2,000 | (17) | $ | 267,280 | |||||||||||||||||
| | | | | 35,000 | (18) | $ | 4,677,400 | |||||||||||||||||
| DeMonty Price |
16,123 | | $ | 29.00 | 10/31/2022 | | | |||||||||||||||||
| 45,000 | 15,000 | (4) | $ | 61.30 | 5/7/2024 | | | |||||||||||||||||
| 6,000 | 4,000 | (5) | $ | 87.31 | 5/5/2025 | | | |||||||||||||||||
| 6,000 | 4,000 | (8) | $ | 93.51 | 10/1/2025 | | | |||||||||||||||||
| 28,000 | 42,000 | (9) | $ | 44.52 | 4/20/2026 | | | |||||||||||||||||
| 2,000 | 28,000 | (10) | $ | 39.42 | 5/3/2026 | | | |||||||||||||||||
| | 50,000 | (7) | $ | 109.87 | 6/5/2028 | | | |||||||||||||||||
| | | | | 12,500 | (16) | $ | 1,670,500 | |||||||||||||||||
| | | | | 2,000 | (10) | $ | 267,280 | |||||||||||||||||
| | | | | 2,000 | (19) | $ | 267,280 | |||||||||||||||||
| | | | | 18,000 | (20) | $ | 2,405,520 | |||||||||||||||||
| | | | | 17,000 | (21) | $ | 2,271,880 | |||||||||||||||||
| David Stanchak |
15,000 | 10,000 | (11) | $ | 91.69 | 4/22/2025 | | | ||||||||||||||||
| 45,000 | 30,000 | (12) | $ | 90.92 | 4/27/2025 | | | |||||||||||||||||
| 14,000 | 21,000 | (9) | $ | 44.52 | 4/20/2026 | | | |||||||||||||||||
| 8,000 | 12,000 | (13) | $ | 25.39 | 6/26/2026 | | | |||||||||||||||||
| 3,000 | 17,000 | (14) | $ | 45.21 | 8/28/2027 | | | |||||||||||||||||
| | 25,000 | (15) | $ | 109.87 | 6/5/2028 | | | |||||||||||||||||
| | | | | 10,000 | (22) | $ | 1,336,400 | |||||||||||||||||
| | | | | 9,000 | (20) | $ | 1,202,760 | |||||||||||||||||
32
Table of Contents
| (1) | Calculated by multiplying the number of unvested stock awards by $133.64, the fair market value of the Companys common stock on February 1, 2019, the last trading day of fiscal 2018. |
| (2) | Represents options granted to Mr. Friedman under our 2012 Stock Incentive Plan on May 2, 2017. These options are fully vested but the underlying shares are subject to selling restrictions that only lapse upon the achievement of both certain stock price-based performance objectives and certain time-based service period requirements. See Executive Summary2017 Stock Option Award to Chairman and Chief Executive Officer for a detailed explanation of the vesting and other provisions of this option award. As of February 2, 2019, 833,334 of these options were subject to selling restrictions. |
| (3) | Represents options granted on August 14, 2018. Subject to continuous service, these options vest and become exercisable as to 1/5th of the options on each anniversary of the grant date, and will be fully vested on August 14, 2023. |
| (4) | Represents options granted on May 8, 2014. Subject to continuous service, these options will be fully vested on May 8, 2019. |
| (5) | Represents options granted on May 6, 2015. Subject to continuous service, these options vest and become exercisable as to 50% of the options on each remaining anniversary of the grant date, and will be fully vested on May 6, 2020. |
| (6) | Represents options granted on May 4, 2016. Subject to continuous service, these options vest on each anniversary of the date of grant with 20,000 options on year 3 and 25,000 options on each of years 4 and 5, and will be fully vested on May 4, 2021. |
| (7) | Represents options granted on June 6, 2018. Subject to continuous service, these options vest on each anniversary of the date of grant with 5,000 options on each of years 1 and 2, 10,000 options on each of years 3 and 4 and 20,000 on year 5, and will be fully vested on June 6, 2023. |
| (8) | Represents options granted on October 2, 2015. Subject to continuous service, these options vest and become exercisable as to 50% of the options on each remaining anniversary of the grant date, and will be fully vested on October 2, 2020. |
| (9) | Represents options granted on April 21, 2016. Subject to continuous service, these options vest and become exercisable as to 1/3rd of the options on each remaining anniversary of the grant date, and will be fully vested on April 21, 2021. |
| (10) | Represents restricted stock units granted on May 4, 2016. Subject to continuous service, these options vest on each anniversary of the date of grant with 6,000 options on year 3 and 11,000 options on each of years 4 and 5, and will be fully vested on May 4, 2021. |
| (11) | Represents options granted on April 22, 2015. Subject to continuous service, these options vest and become exercisable as to 50% of the options on each remaining anniversary of the grant date, and will be fully vested on April 22, 2020. |
| (12) | Represents options granted on April 28, 2015. Subject to continuous service, these options vest and become exercisable as to 50% of the options on each of April 22, 2019 and 2020, and will be fully vested on April 22, 2020. |
| (13) | Represents options granted on June 27, 2016. Subject to continuous service, these options vest and become exercisable as to 1/3rd of the options on each remaining anniversary of the grant date, and will be fully vested on June 27, 2021. |
| (14) | Represents options granted on August 29, 2017. Subject to continuous service, these options vest on each anniversary of the date of grant with 3,000 options on year 2, 4,000 options on year 3 and 5,000 options on each of years 4 and 5, and will be fully vested on August 29, 2022. |
| (15) | Represents options granted on June 6, 2018. Subject to continuous service, these options vest on each anniversary of the date of grant with 2,500 options on each of years 1 and 2, 5,000 options on each of years 3 and 4 and 10,000 on year 5, and will be fully vested on June 6, 2023. |
| (16) | Represents restricted stock units granted on May 8, 2014. Subject to continuous service, these restricted stock units will be fully vested on June 16, 2019. |
| (17) | Represents restricted stock units granted on May 6, 2015. Subject to continuous service, these restricted stock units vest as to 50% of the units on each of June 16, 2019 and 2020, and will be fully vested on June 16, 2020. |
| (18) | Represents restricted stock units granted on May 4, 2016. Subject to continuous service, these restricted stock units vest on each anniversary of the date of grant with 10,000 units on year 3 and 12,500 units on each of years 4 and 5, and will be fully vested on May 4, 2021. |
| (19) | Represents restricted stock units granted on October 2, 2015. Subject to continuous service, these restricted stock units vest as to 50% of the units on each of September 14, 2019 and 2020, and will be fully vested on September 14, 2020. |
| (20) | Represents restricted stock units granted on April 21, 2016. Subject to continuous service, these restricted stock units vest as to 1/3rd of the units on each of June 16, 2019, 2020 and 2021, and will be fully vested on June 16, 2021. |
| (21) | Represents restricted stock units granted on May 4, 2016. Subject to continuous service, these restricted stock units vest on each anniversary of the date of grant with 4,000 units on year 3 and 6,500 units on each of years 4 and 5, and will be fully vested on May 4, 2021. |
| (22) | Represents restricted stock units granted on April 23, 2015. Subject to continuous service, these restricted stock units vest as to 50% of the units on each of April 22, 2019 and 2020, and will be fully vested on April 22, 2020. |
33
Table of Contents
OPTIONS EXERCISED, UNITS VESTED AND STOCK VESTED
The following table shows all restricted stock units or stock awards that vested in fiscal 2018, as well as stock options that were exercised by the named executive officers in fiscal 2018.
| OPTION AWARDS | RESTRICTED STOCK AWARDS | |||||||||||||||
| NAME | NUMBER OF SHARES ACQUIRED ON EXERCISE |
VALUE REALIZED ON EXERCISE |
NUMBER OF RESTRICTED STOCK UNITS VESTED |
VALUE OF RESTRICTED STOCK UNITS ON VESTING |
||||||||||||
| Gary Friedman |
| $ | | | $ | | ||||||||||
| Ryno Blignaut |
| $ | | | $ | | ||||||||||
| Karen Boone |
130,876 | $ | 9,171,411 | 8,500 | $ | 917,170 | ||||||||||
| Eri Chaya |
| $ | | 8,500 | $ | 917,170 | ||||||||||
| DeMonty Price |
7,777 | $ | 956,649 | 9,500 | $ | 1,414,050 | ||||||||||
| David Stanchak |
| $ | | 8,000 | $ | 924,610 | ||||||||||
BURN RATE AND DILUTION
We calculate our burn rate using the total number of equity awards (full value stock awards and stock options) granted under our stock incentive plan during the current fiscal year as a percentage of the total number of common shares outstanding as of the prior fiscal year. Our fiscal 2018 burn rate was 2.0%.
We believe to understand our use of equity under our stock incentive plan (including our annual burn rate) requires understanding the impact of our recent share buyback programs on our dilution. As a result, we analyze our equity metrics as a percentage of both the total number of common shares outstanding and the total number of pro forma common shares outstanding, which takes into account our share buyback programs.
Our pro forma overhang for fiscal 2018 based on the pro forma common shares outstanding was 18.5%.
Our annual overhang for fiscal 2018 based on the total number of common shares outstanding was 38.7%.
We calculate our equity overhang as the total number of outstanding shares issued or awarded (including any unexercised and unvested outstanding awards) under our equity plans as a percentage of the total number of common shares outstanding. Our pro forma equity overhang takes into account the effect of the Companys share repurchase program by using the total number of common shares outstanding prior to the Companys share repurchases (as of fiscal 2016) and includes the actual issuance of common stock via equity instruments through the current fiscal year end period.
| FISCAL 2018 (POST REPURCHASE ACTIVITY) | ||||||||||||||||
| FISCAL 2016 (PRE- REPURCHASE ACTIVITY) |
ON FISCAL 2018 SHARES OUTSTANDING |
ON FISCAL 2016 SHARES OUTSTANDING |
ON PRO FORMA FISCAL 2018 SHARES OUTSTANDING |
|||||||||||||
| Options & RSUs Outstanding |
9,591,678 | 7,914,885 | 7,914,885 | 7,914,885 | ||||||||||||
| Shares Outstanding |
40,828,633 | 20,477,813 | 40,828,633 | 42,745,524 | (1) | |||||||||||
| Overhang |
23.5 | % | 38.7 | % | 19.4 | % | 18.5 | % | ||||||||
| (1) | Pro forma fiscal 2018 shares outstanding is equal to the total shares outstanding as of fiscal 2016, plus the issuance of 1,919,691 shares during fiscal 2017 and fiscal 2018 as a result of the exercise of stock options and vested RSUs, minus the repurchase of shares from a former employee of 2,800 shares, and excludes the Companys share repurchase activity under the Board approved share repurchase programs. |
PENSION BENEFITS
None of our named executive officers received any pension benefits during fiscal 2018.
NONQUALIFIED DEFERRED COMPENSATION
None of our named executive officers contributed to or received earnings from a nonqualified deferred compensation plan during fiscal 2018.
EMPLOYMENT AND OTHER COMPENSATION AGREEMENTS
We have entered into employment agreements with the following named executive officers.
34
Table of Contents
Gary Friedman
We have entered into an employment agreement with Mr. Friedman, our Chairman and Chief Executive Officer. Mr. Friedmans employment agreement provides for an annual base salary of at least $1.25 million. If Mr. Friedmans employment is terminated by us without cause (as defined in the agreement) or by Mr. Friedman for good reason (as defined in the agreement), he is entitled to (a) all accrued salary and vacation pay through the termination date, (b) severance payments totaling $20 million, less withholdings, paid on our regular payroll schedule over the 24 months following the termination date, (c) any earned but unpaid portion of his annual bonus, (d) a pro-rata amount (based on the number of days Mr. Friedman was employed during the fiscal year through the termination date) of Mr. Friedmans target bonus for the applicable fiscal year in which termination of employment occurs, to be paid at the same time and in the same form as Mr. Friedmans annual bonus would otherwise be paid, (e) subject to his timely election under COBRA, continuation of medical benefits for 24 months following the termination date, subject to Mr. Friedmans payment of applicable premiums at the same rate that would have been applied had he remained an executive officer of our Company, paid for by us to the same extent that we paid for his health insurance prior to termination, (f ) his vested shares and options that are still subject to selling restrictions will remain outstanding for two years following the date of termination (during which time the selling restrictions may lapse in accordance with their terms) and will be subject to repurchase by us after two years at the then fair market value to the extent that such selling restrictions remain unlapsed, and (g) any unvested performance-based equity awards that Mr. Friedman may hold shall remain outstanding and vest according to their terms for a period of two years following the date of termination and shall be forfeited to the extent unvested after such period.
Mr. Friedmans employment agreement also provides that in the event he receives payments that would be subject to an excise tax, he would receive the greater of either (i) the payment in full or (ii) such lesser amount which would result in no portion of such payments being subject to the excise tax, on an after-tax basis.
If Mr. Friedmans services are terminated by us for cause (as defined in the agreement), he is entitled to all accrued salary and vacation pay through the termination date. Upon such termination for cause, certain of Mr. Friedmans other equity interests that are either unvested or subject to selling restrictions and repurchase rights will terminate, expire and be forfeited for no value, or otherwise be subject to repurchase in accordance with their terms and shall be forfeited to the extent unvested after such period. See Compensation Discussion and AnalysisLong-Term Equity Incentive Compensation.
Mr. Friedman has agreed that, during his employment with us or during the term when he is receiving continued payment from us after termination of his employment as described above, he will not directly or indirectly work for or engage or invest in any competitor. In addition, Mr. Friedman has agreed that, during his employment with us and for the two year period thereafter, he will not (a) solicit, directly or through any third party, any employee of ours or (b) use our proprietary information to solicit the business of any of our material customers or suppliers, or as specified in the employment agreement, encourage any of our suppliers and customers to reduce their business or contractual relationship with us. The agreement also contains a mutual non-disparagement clause.
Eri Chaya, DeMonty Price, David Stanchak, Ryno Blignaut and Karen Boone
On March 29, 2018, we entered into compensation protection agreements with each of Ms. Chaya, Mr. Price, Mr. Stanchak and Ms. Boone. On August 14, 2018, we entered into a compensation protection agreement with Mr. Blignaut. The compensation committee determined to offer these compensation protection agreements to each of these executive officers in order to provide uniform severance protection terms for each such executive officer. The effect of the compensation protection agreements is to supersede any other compensation severance arrangements previously in place for any such executive officer.
The compensation protection agreements provide each of the foregoing executive officers with severance if the executives employment is terminated by us without cause (as defined in the agreement), or by the executive for good reason (as defined in the agreement). In the event of such termination and subject to the executives execution and nonrevocation of a release of claims and continued compliance with the restrictive covenants described herein, the executive is entitled to: (a) all accrued base salary through the termination date; (b) any earned and unpaid portion of the annual bonus for the year prior to year in which such termination occurs; (c) to the extent bonuses have been paid for the year prior to the year in which the termination takes place (or no such bonus was paid at all), a prorated bonus based on the number of days the executive is employed in the year of termination based on our actual performance and if applicable, on executives individual performance at the midpoint of the applicable range; (d) severance payments equal to 12 months base salary, less withholdings, paid on our regular payroll schedule following the termination date; and (e) subject to the executives timely election under COBRA, payment of a portion of the executives COBRA premiums at the same rate that would have been applied had the executive remained an employee, paid for by us to the same extent that we paid for the executives health insurance prior to termination, for 12 months following the termination date (or if earlier, when the executive becomes eligible for similar coverage from another employer). The compensation protection agreements also provide that in the event the executive receives payments that would be subject to an excise tax, the executive would receive a lesser amount which would result in no portion of such payments being subject to the excise tax. Each executive has agreed that during employment with us, the executive will not directly or indirectly work for or
35
Table of Contents
engage or invest in any competitor. Each has also agreed that during employment with us and the 12 months following employment, the executive will not solicit, directly or through any third party any business from any of our material customers or suppliers or encourage any of our customers or suppliers to reduce their business or contractual relationship with us. Each executive will also cooperate with us following termination of employment in the defense of any action brought by a third party against us that relates to the executives employment with us.
POTENTIAL PAYMENTS UPON TERMINATION OR CHANGE IN CONTROL
Gary Friedman
The information below describes and quantifies certain compensation that would have been paid to Chief Executive Officer in the event of his termination of employment or a change in control, assuming such event was effective at February 2, 2019, the last day of our 2018 fiscal year, and based on fiscal 2018 compensation.
| BENEFITS AND PAYMENTS | TERMINATION WITHOUT CAUSE OR RESIGNATION WITH GOOD REASON |
|||
| Severance pursuant to employment agreement(1) |
$ | 20,000,000 | ||
| Bonus(2) |
$ | 2,664,063 | ||
| Intrinsic value of equity(3) |
$ | 69,700,056 | ||
| Health coverage total benefits(4) |
$ | 20,998 | ||
| Total |
$ | 92,385,117 | ||
| (1) | Payable over 24 months. |
| (2) | Corresponds to Mr. Friedmans annual bonus amount for fiscal 2018. |
| (3) | Performance-based option awards where the shares underlying the option are subject to selling restrictions shall continue to have such selling restrictions lapse according to the performance terms for a period of one or two years following such termination, as applicable. In the event Mr. Friedman is terminated on February 2, 2019, the selling restrictions applicable to his 2017 stock option awards would lapse in full (assuming, in the case of the 2017 stock option award, that the stock price performance targets set forth in the 2017 award are met within the one year time period following such termination). The value shown includes the value of such options held by Mr. Friedman that he would receive if the stock price hurdles are achieved on such termination date. This value is based on the excess of $133.64, the closing price of our common stock on February 1, 2019, the last trading day of fiscal 2018, over the exercise price of such options, multiplied by the number of shares that could be exercisable assuming that the selling restrictions lapsed on such termination date. |
| (4) | Continuation of medical benefits for 24 months following the termination date, subject to his payment of applicable COBRA premiums at the same rate that would have been applied had he remained an executive officer of the Company, paid for by us to the same extent that we paid for his health insurance prior to termination. |
Ryno Blignaut, Eri Chaya, DeMonty Price and David Stanchak
The information below describes and quantifies certain compensation that would have been paid to Mr. Blignaut, Ms. Chaya, Mr. Price and Mr. Stanchak under the compensation protection agreements in the event of his or her termination of employment or a change in control, assuming such event was effective at February 2, 2019, the last day of our 2018 fiscal year, and based on fiscal 2018 compensation.
| BENEFITS AND PAYMENTS | TERMINATION WITHOUT CAUSE OR RESIGNATION WITH GOOD REASON |
|||||||||||||||
| RYNO BLIGNAUT |
ERI CHAYA |
DEMONTY PRICE |
DAVID STANCHAK |
|||||||||||||
| Salary continuation(1) |
$ | 750,000 | $ | 950,000 | $ | 850,000 | $ | 700,000 | ||||||||
| Bonus(2) |
$ | 303,879 | $ | 781,302 | $ | 681,766 | $ | 582,464 | ||||||||
| Health coverage total benefits(3) |
$ | 18,242 | $ | 18,242 | $ | 13,421 | $ | 20,295 | ||||||||
| Total |
$ | 1,072,121 | $ | 1,749,544 | $ | 1,545,187 | $ | 1,302,759 | ||||||||
| (1) | This amount reflects salary continuation at each such executive officers current salary rate paid over twelve months. |
| (2) | Corresponds to each such executive officers annual bonus amount for fiscal 2018 that such executive officer would be entitled to receive if still employed on the date in 2019 that bonuses are actually paid. |
| (3) | Continuation of medical benefits for twelve months following the termination date, subject to the payment of applicable COBRA premiums by such executive officer at the same rate that would have been applied had he or she remained an executive officer of the Company, paid for by us to the same extent that we paid for his or her health insurance prior to termination. |
Karen Boone
Ms. Boone left the Company in November 2018. No compensation was paid to Ms. Boone in connection with her resignation.
36
Table of Contents
COMPENSATION OF DIRECTORS
On May 2, 2018, the board adopted several changes to the going forward compensation of non-management directors, with such changes to become effective at the time of the July 18, 2018 annual meeting on a going-forward basis. In order to better align with prevailing market practices, the board of directors determined to eliminate all per meeting fees in favor of an increase in the annual cash retainer for non-employee members of $15,000 per annum. The increased retainer is expected to align with the approximate level of fees paid previously as per meeting fees for the meetings of the board of directors each year. In addition, to reflect the level of work required for certain board roles, the board of directors elected to add a cash retainer of $30,000 per annum for the Lead Independent Director role (where there previously was no cash payment) and to increase the annual cash retainer for the head of the audit committee and compensation committee by $30,000 and $40,000, respectively.
We compensate all non-employee members of our board of directors as follows:
| PRIOR TO JULY 18, 2018 | EFFECTIVE AS OF JULY 18, 2018 | |||
| Annual cash retainer |
$120,000, paid quarterly in advance | $135,000, paid quarterly in advance | ||
| Lead Independent Director |
20,000 stock options granted upon appointment(1) | 20,000 stock options granted upon appointment and $30,000, paid quarterly in advance |
||
| Audit committee chairman |
$50,000, paid quarterly in advance | $80,000, paid quarterly in advance | ||
| Compensation committee chairman |
$35,000, paid quarterly in advance | $75,000, paid quarterly in advance | ||
| Audit committee member |
$25,000, paid quarterly in advance | $25,000, paid quarterly in advance | ||
| Compensation committee member |
$20,000, paid quarterly in advance | $20,000, paid quarterly in advance | ||
| Nominating & corporate governance committee chairman |
$25,000, paid quarterly in advance | $25,000, paid quarterly in advance | ||
| Nominating & corporate governance committee member |
$15,000, paid quarterly in advance | $15,000, paid quarterly in advance | ||
| Board meeting attendance fees |
$2,500 per in-person meeting; | N/A | ||
| $1,500 per telephonic meeting | N/A | |||
| Annual equity grant of restricted stock |
Aggregate value of $125,000(2) | Aggregate value of $125,000(2) |
| (1) | This option was granted in March 2016 upon Mark Demilios appointment as Lead Independent Director. No additional grant was made in fiscal 2018. The options vest in five equal installments over five years, subject to the individuals continuing service as the Lead Independent Director, such that the option shall become exercisable for 4,000 shares on the first anniversary of the date of the individuals appointment as Lead Independent Director and for an additional 4,000 shares upon each of the second, third, fourth and fifth anniversaries thereafter. |
| (2) | Based on the average closing price of our common stock on the date of grant, determined using the closing prices for the ten consecutive trading days prior to and inclusive of the date of grant, which shares vest in full on the one-year anniversary of the date of grant. Grants are made for service for the period between the annual meeting of shareholders for the fiscal year in which the grant was made and the annual meeting of shareholders for the following fiscal year. |
Annual equity grants described above are granted on the date of the annual meeting of shareholders each year.
Mr. Friedman and Ms. Chaya, as current Company employees, did not receive any compensation for board service for fiscal 2018. All directors receive reimbursement for reasonable out-of-pocket expenses incurred in connection with meetings of our board of directors.
37
Table of Contents
The following table shows the compensation earned by all non-employee directors during fiscal 2018:
| NAME | FEES EARNED | STOCK AWARDS(1) | TOTAL | |||||||||
| Carlos Alberini |
$ | 135,740 | $ | 122,235 | $ | 257,975 | ||||||
| Keith Belling |
$ | 135,740 | $ | 122,235 | $ | 257,975 | ||||||
| Mark Demilio |
$ | 264,192 | $ | 122,235 | $ | 386,427 | ||||||
| Hilary Krane |
$ | 158,240 | $ | 122,235 | $ | 280,475 | ||||||
| Katie Mitic |
$ | 158,240 | $ | 122,235 | $ | 280,475 | ||||||
| Ali Rowghani |
$ | 150,740 | $ | 122,235 | $ | 272,975 | ||||||
| Leonard Schlesinger |
$ | 192,712 | $ | 122,235 | $ | 314,947 | ||||||
| (1) | Reflects the aggregate grant date fair value of the awards of restricted stock made in fiscal 2018, computed in accordance with FASB ASC 718, Stock-Based Compensation. See Note 16Stock-Based Compensation in our audited consolidated financial statements contained in the Original Filing. Amounts shown do not reflect compensation actually received or that may be realized in the future by the director. |
At February 2, 2019, the last day of our 2018 fiscal year, the aggregate number of unvested restricted stock awards and unexercised stock options held by each of our directors during fiscal 2018, other than Mr. Friedman and Ms. Chaya, is set forth below. Information regarding equity awards held by Mr. Friedman and Ms. Chaya is set forth in the table entitled Outstanding Equity Awards at Fiscal Year-End in this Amendment.
| NAME | UNVESTED RESTRICTED STOCK(1) |
UNEXERCISED STOCK OPTIONS |
||||||
| Carlos Alberini |
915 | | ||||||
| Keith Belling |
915 | | ||||||
| Mark Demilio |
915 | 20,000 | (2) | |||||
| Hilary Krane |
915 | | ||||||
| Katie Mitic |
915 | | ||||||
| Ali Rowghani |
915 | | ||||||
| Leonard Schlesinger |
915 | | ||||||
| (1) | All restricted stock awards listed above vest as to 100% of the shares on July 18, 2019. |
| (2) | Mr. Demilio was granted options to purchase 20,000 shares of stock in connection with his appointment as Lead Independent Director on March 9, 2016. Such options vest pro rata over five years such that they will be fully vested on March 2, 2021, subject to Mr. Demilios continued service as Lead Independent Director. |
38
Table of Contents
| Item 12. | Security Ownership of Certain Beneficial Owners and Management and Related Stockholder Matters. |
The following table sets forth information as of May 23, 2019, regarding the beneficial ownership of our common stock by: each person or group who is known by us to own beneficially more than 5% of our outstanding shares of our common stock; each of our named executive officers; each of our current directors; and all of our current executive officers and directors as a group.
Beneficial ownership for the purposes of the following table is determined in accordance with the rules and regulations of the SEC. Percentage of beneficial ownership is based on 18,360,211 shares of common stock outstanding as of May 23, 2019. The shares outstanding as of May 23, 2019 reflects the effect of our repurchase of approximately 2.2 million shares of our common stock at an average price of $115.36 per share, for an aggregate repurchase amount of approximately $250.0 million, during our first fiscal quarter of 2019 ending May 4, 2019 pursuant to an existing share repurchase authorization.
Except as disclosed in the footnotes to this table and subject to applicable community property laws, we believe that each shareholder identified in the table possesses sole voting and investment power over all shares of common stock shown as beneficially owned by the shareholder. Unless otherwise indicated in the table or footnotes below, the address for each beneficial owner is c/o RH, 15 Koch Road, Corte Madera, CA 94925.
| NAME(1) | NUMBER | PERCENT | ||||||
| Gary Friedman(2) |
7,230,158 | 31.0 | % | |||||
| FMR LLC(3) 245 Summer Street, Boston, MA 02210 |
3,182,368 | 17.3 | % | |||||
| BlackRock, Inc.(4) 55 East 52nd Street, New York, NY 10055 |
2,774,620 | 15.1 | % | |||||
| The Vanguard Group(5) 100 Vanguard Blvd., Malvern, PA 19355 |
2,744,035 | 14.9 | % | |||||
| T. Rowe Price Associates, Inc.(6) 100 E. Pratt Street, Baltimore, MD 21202 |
1,431,521 | 7.8 | % | |||||
| Susquehanna Securities(7) 401 E. City Avenue, Suite 220, Bala Cynwyd, PA 19004 |
1,110,369 | 6.0 | % | |||||
| Miller Value Partners, LLC(8) One South Street, Suite 2550, Baltimore, MD 21202 |
985,635 | 5.4 | % | |||||
| The Goldman Sachs Group, Inc.(9) 200 West Street, New York, NY 10282 |
976,926 | 5.3 | % | |||||
| Carlos Alberini(10) |
69,344 | * | ||||||
| Keith Belling(11) |
17,501 | * | ||||||
| Ryno Blignaut |
| | ||||||
| Karen Boone |
| | ||||||
| Eri Chaya(12) |
385,829 | 2.1 | % | |||||
| Mark Demilio(13) |
57,106 | * | ||||||
| Hilary Krane(14) |
7,916 | * | ||||||
| Katie Mitic(15) |
15,267 | * | ||||||
| Jack Preston(16) |
77,001 | * | ||||||
| DeMonty Price(17) |
210,522 | 1.1 | % | |||||
| Ali Rowghani(18) |
6,953 | * | ||||||
| Leonard Schlesinger(19) |
11,502 | * | ||||||
| David Stanchak(20) |
152,962 | * | ||||||
| All current executive officers and directors |
8,242,061 | 36.4 | % | |||||
| * | Represents beneficial ownership of less than 1% of our outstanding common stock. |
| (1) | Under the rules of the SEC, our named executive officers include our principal executive officer, principal financial officer and the next three most highly compensated executive officers. |
| (2) | Includes 4,976,826 shares of common stock issuable upon the exercise of options that are exercisable within 60 days of May 23, 2019. As of May 23, 2019, 666,668 of these options are subject to selling restrictions. |
| (3) | Based on the Schedule 13G/A filed by FMR LLC on February 13, 2019. |
| (4) | Based on the Schedule 13G/A filed by BlackRock, Inc. on February 11, 2019. |
| (5) | Based on the Schedule 13G/A filed by Vanguard Group, Inc. on February 12, 2019. |
| (6) | Based on the Schedule 13G/A filed by T. Rowe Price Associates, Inc. on May 10, 2019 |
| (7) | Based on the Schedule 13G filed by Susquehanna Securities on February 14, 2019. Susquehanna Advisors Group, Inc. is the investment manager to Capital Ventures International and as such may exercise voting and dispositive power over the shares directly owned by Capital Ventures International. Susquehanna Investment Group and Susquehanna Securities are affiliated independent broker-dealers which, together with Capital Ventures International and Susquehanna Advisors Group, Inc., may be deemed a group. |
39
Table of Contents
| (8) | Based on the Schedule 13G/A filed by Miller Value Partners, LLC on February 14, 2019. |
| (9) | Based on the Schedule 13G/A filed by The Goldman Sachs Group, Inc. on February 12, 2019. |
| (10) | Includes 915 restricted stock awards that vest on July 18, 2019. |
| (11) | Includes 915 restricted stock awards that vest on July 18, 2019. |
| (12) | Includes 308,600 shares of common stock issuable upon the exercise of options that are exercisable within 60 days of May 23, 2019 and 26,000 restricted stock units that vest on June 16, 2019. |
| (13) | Includes 34,425 shares of common stock held by Mr. Demilios family trust, 12,000 shares of common stock issuable upon the exercise of options that are exercisable within 60 days of May 23, 2019 and 915 restricted stock awards that vest on July 18, 2019. |
| (14) | Includes 915 restricted stock awards that vest on July 18, 2019. |
| (15) | Includes 2,800 shares of common stock held by Ms. Mitics family trust and 915 restricted stock awards that vest on July 18, 2019. |
| (16) | Includes 63,500 shares of common stock issuable upon the exercise of options that are exercisable within 60 days of May 23, 2019 and 13,500 restricted stock units that vest on June 16, 2019. |
| (17) | Includes 145,123 shares of common stock issuable upon the exercise of options that are exercisable within 60 days of May 23, 2019 and 19,500 restricted stock units that vest on June 16, 2019. |
| (18) | Includes 915 restricted stock awards that vest on July 18, 2019. |
| (19) | Includes 915 restricted stock awards that vest on July 18, 2019. |
| (20) | Includes 118,500 shares of common stock issuable upon the exercise of options that are exercisable within 60 days of May 23, 2019 and 3,000 restricted stock units that vest on June 16, 2019. |
| (21) | Includes 5,624,549 shares of common stock our executive officers and directors have a right to acquire upon the exercise of options that are exercisable within 60 days of May 23, 2019, 6,405 restricted stock awards that vest on July 18, 2019 and 62,000 restricted stock units that vest on June 16, 2019. |
EQUITY COMPENSATION PLAN INFORMATION
The following table gives information about the Companys common stock that may be issued upon the exercise of options, warrants and rights under all of the Companys existing equity compensation plans as of February 2, 2019:
| EQUITY COMPENSATION PLAN INFORMATION | ||||||||||||
| PLAN CATEGORY | NUMBER OF SECURITIES TO BE ISSUED UPON OF OUTSTANDING OPTIONS, AND RIGHTS |
WEIGHTED- AVERAGE PRICE OF OUTSTANDING OPTIONS, AND RIGHTS |
NUMBER OF SECURITIES REMAINING AVAILABLE FOR FUTURE ISSUANCE(1) |
|||||||||
| Equity compensation plans approved by security holders |
7,499,416 | $ | 54.37 | 1,419,552 | (3) | |||||||
| Equity compensation plans not approved by security holders |
| | | |||||||||
| Total |
7,499,416 | (2) | $ | 54.37 | 1,419,552 | (3) | ||||||
| (1) | Excludes securities reflected in column entitled Number of Securities to be Issued Upon Exercise of Outstanding Options, Warrants and Rights. |
| (2) | Calculated without taking into account 415,469 shares underlying restricted stock units that will become issuable as those units vest, without any cash consideration or other payment required for such shares. |
| (3) | Excludes 409,556 shares available for issuance as of February 4, 2019 pursuant to the evergreen provision of our 2012 Stock Incentive Plan. |
40
Table of Contents
| Item 13. | Certain Relationships and Related Transactions, and Director Independence. |
TIME SHARING AGREEMENT FOR CORPORATE AIRCRAFT
On March 27, 2015, Restoration Hardware, Inc., a wholly-owned subsidiary of the Company, entered into an Aircraft Time Sharing Agreement (the Time Sharing Agreement) with Gary Friedman, its Chief Executive Officer. The Time Sharing Agreement governs use of any of the Companys aircraft (Corporate Aircraft) by Mr. Friedman for personal trips and provides that Mr. Friedman will lease such Corporate Aircraft and pay Restoration Hardware, Inc. an amount equal to the aggregate actual expenses of each personal use flight based on the variable costs of the flight, with the amount of such lease payments not to exceed the maximum payment level established under Federal Aviation Administration rules. Mr. Friedman maintains a deposit with the Company to be used towards payment of amounts due under the Time Sharing Agreement. On March 29, 2016, the parties entered into an Amended and Restated Time Sharing Agreement on substantially the same terms and conditions as the prior agreement.
DIRECTOR AND OFFICER INDEMNIFICATION AND LIMITATION OF LIABILITY
Our bylaws provide that we will indemnify our directors and officers to the fullest extent permitted by the Delaware General Corporation Law (the DGCL), subject to certain exceptions contained in our bylaws. In addition, our certificate of incorporation provides that our directors will not be liable for monetary damages for breach of fiduciary duty.
We entered into indemnification agreements with each of our executive officers and directors. The indemnification agreements provide the executive officers and directors with contractual rights to indemnification, expense advancement and reimbursement, to the fullest extent permitted under the DGCL, subject to certain exceptions contained in those agreements.
There is no pending litigation or proceeding naming any of our directors or officers to which indemnification is being sought, and we are not aware of any pending litigation that may result in claims for indemnification by any director or officer.
OUR POLICY REGARDING RELATED PARTY TRANSACTIONS
We have a written policy with respect to related party transactions. Under our related party transaction policies and procedures, a Related Party Transaction is any financial transaction, arrangement or relationship (or series of similar transactions, arrangements or relationships) in which we or any of our subsidiaries is a participant and in which a Related Party has or will have a direct or indirect interest, other than any transactions, arrangements or relationships in which the aggregate amount involved will not or may not be expected to exceed $120,000 in any calendar year, subject to certain exceptions. A Related Party is any of our executive officers, directors or director nominees, any shareholder directly or indirectly beneficially owning in excess of 5% of our stock or securities exchangeable for our stock, or any immediate family member of any of the foregoing persons.
Pursuant to our related person transaction policies and procedures, any Related Party Transaction must be reviewed by the audit committee. In connection with its review of a Related Party Transaction, the audit committee may take into account, among other factors it deems appropriate, whether the Related Party Transaction is on terms no less favorable than terms generally available to an unaffiliated third-party under the same or similar circumstances and the extent of the related partys interest in the Related Party Transaction. Management shall present to the audit committee the following information, to the extent relevant, with respect to actual or potential Related Party Transactions:
| 1. | A general description of the transaction(s), including the material terms and conditions; |
| 2. | The name of the related party and the basis on which such person or entity is a related party; |
| 3. | The related partys interest in the transaction(s), including the related partys position or relationship with, or ownership of, any entity that is a party to or has an interest in the transaction(s); |
| 4. | The approximate dollar value of the transaction(s), and the approximate dollar value of the related partys interest in the transaction(s) without regard to amount of profit or loss; |
| 5. | In the case of a lease or other transaction providing for periodic payments or installments, the aggregate amount of all periodic payments or installments expected to be made; |
| 6. | In the case of indebtedness, the aggregate amount of principal to be outstanding and the rate or amount of interest to be payable on such indebtedness; and |
| 7. | Any other material information regarding the transaction(s) or the related partys interest in the transaction(s). |
41
Table of Contents
We are not aware of any related party transaction since the beginning of the 2018 fiscal year required to be reported under our related party transaction policies and procedures or applicable SEC rules for which our policies and procedures did not require review or for which such policies and procedures were not followed.
DIRECTOR INDEPENDENCE
In accordance with our Corporate Governance Guidelines, the board of directors affirmatively determines that each independent director has no material relationship with the Company (either directly or as a partner, shareholder or officer of an organization that has a relationship with the Company) and meets the standards for independence as defined by applicable law and the rules of the NYSE.
Our board of directors undertook its annual review of the independence of our directors and considered whether any director has a material relationship with us that could compromise that directors ability to exercise independent judgment in carrying out that directors responsibilities. Our board of directors affirmatively determined that each of Mr. Alberini, Mr. Demilio, Ms. Krane, Ms. Mitic, Mr. Rowghani and Dr. Schlesinger is an independent director, as defined under the applicable rules of the NYSE and the SEC, and that the other members of the board are not independent. Further, the board of directors determined that each member of the board of directors audit committee, compensation committee and nominating and corporate governance committee satisfies independence standards applicable to each committee on which he or she serves.
The boards independence determination was based on information provided by our current directors. In particular, in making its determination that Mr. Alberini is an independent director, the board of directors considered that under the rules of the NYSE and the SEC, Mr. Alberini could be deemed independent for membership on the board of directors after February 2017 given that his prior service as the Companys Co-Chief Executive Officer and Chief Executive Officer had occurred more than three years prior to such date. In reaching its conclusion regarding the independence of Mr. Alberini, the board of directors further considered Mr. Alberinis time away from the management of RH, the fact that he had served as the chief executive officer of Lucky Brands, and the fact that he subsequently left Lucky Brands and is now serving as the chief executive officer of Guess?, Inc., a publicly traded company, listed on the NYSE, along with other prior and existing relationships between the Company and Mr. Alberini. In its annual re-assessment of independence of its members, the board concluded that Mr. Alberini is independent as it did in the prior year. The board has concluded Mr. Alberinis circumstances distinguish him from that of a former chief executive officer who remains on the board of directors upon retirement as chief executive officer. Although the board of directors determined that Mr. Alberini is an independent director under the applicable rules of the NYSE and the SEC, the board of directors has elected not to appoint Mr. Alberini to any of the committees of the Company that are required under applicable rules of the NYSE or SEC to be composed entirely of independent directors.
42
Table of Contents
| Item 14. | Principal Accountant Fees and Services. |
INDEPENDENT REGISTERED PUBLIC ACCOUNTING FIRMS FEES
We regularly review the services and fees from our independent registered public accounting firm, PricewaterhouseCoopers LLP (PwC). These services and fees are also reviewed with the audit committee annually. In accordance with standard policy, PwC periodically rotates the individuals who are responsible for the Companys audit.
In addition to performing the audit of the Companys consolidated financial statements, PwC provided various other services during fiscal 2018 and fiscal 2017. The Companys audit committee has determined that PwCs provision of these services, which are described below, does not impair PwCs independence with respect to the Company.
The aggregate fees billed for fiscal 2018 and fiscal 2017 for each of the following categories of services are as follows:
| FEES BILLED TO THE COMPANY | FISCAL 2018 | FISCAL 2017 | ||||||
| Audit fees(1) |
$ | 2,384,161 | $ | 1,983,997 | ||||
| Audit related fees(2) |
633,341 | 115,900 | ||||||
| Tax fees(3) |
460,910 | 397,169 | ||||||
| All other fees(4) |
| 33,788 | ||||||
| Total |
$ | 3,478,412 | $ | 2,530,854 | ||||
| (1) | Includes fees for audit services principally related to the year-end examination and the quarterly reviews of the Companys consolidated financial statements, consultation on matters that arise during a review or audit, review of SEC filings, and audit procedures related to managements implementation of new accounting systems. |
| (2) | Includes fees that are for assurance and related services other than those included in audit fees above. In 2017, these services were primarily related to lease accounting consulting, SEC comment letters, and debt offering and accounting services. In 2018, these services were primarily related to lease accounting consulting, debt offering and accounting services. |
| (3) | Includes fees for tax compliance and advice. |
| (4) | Includes fees for all other non-audit services. |
POLICY ON AUDIT COMMITTEE PRE-APPROVAL OF AUDIT AND PERMISSIBLE NON-AUDIT SERVICES OF INDEPENDENT REGISTERED PUBLIC ACCOUNTING FIRM
The audit committees policy is to pre-approve all audit and permissible non-audit services provided by the independent registered public accounting firm. These services may include audit services, audit-related services, tax services and other services. The independent registered public accounting firm and management are required to periodically report to the audit committee regarding the extent of services provided by the independent registered public accounting firm in accordance with this pre-approval, and the fees for the services performed to date. All of the services relating to the fees described in the table above were approved by the audit committee in accordance with the audit committees pre-approval policy.
43
Table of Contents
| Item 15. | Exhibits, Financial Statement Schedules. |
EXHIBIT INDEX
The exhibits listed in the exhibit index of the Original Filing and the exhibits listed in the exhibit index of this Amendment are filed with, or incorporated by reference in, this Amendment.
The following additional exhibits are filed with this Amendment:
44
Table of Contents
SIGNATURES
Pursuant to the requirements of Section 13 or 15(d) of the Securities Exchange Act of 1934, the registrant has duly caused this report to be signed on its behalf by the undersigned, thereunto duly authorized.
| RH | ||||||
| By: | /s/ Gary Friedman |
|||||
| Name: | Gary Friedman | |||||
| Title: | Chairman of the Board of Directors and Chief | |||||
| Date: May 31, 2019 | Executive Officer | |||||
45
Table of Contents
ANNEX A
RECONCILIATION OF GAAP NET INCOME TO ADJUSTED NET INCOME
(In thousands), (Unaudited)
| YEAR ENDED | ||||||||
| FEBRUARY 2, 2019 | FEBRUARY 3, 2018 | |||||||
| GAAP net income |
$ | 150,639 | $ | 2,180 | ||||
|
|
|
|
|
|||||
| Adjustments (pre-tax): |
||||||||
| Net revenues: |
||||||||
| Recall accrual [a] |
4,733 | 3,207 | ||||||
| Cost of goods sold: |
||||||||
| Asset impairments [b] |
3,807 | | ||||||
| Distribution center closures [c] |
1,478 | 1,737 | ||||||
| Impact of inventory step-up [d] |
380 | 2,527 | ||||||
| Recall accrual [a] |
(4,139 | ) | 4,315 | |||||
| Anti-dumping exposure [e] |
| (2,202 | ) | |||||
| Selling, general and administrative expenses: |
||||||||
| Reorganization related costs [f ] |
9,977 | 949 | ||||||
| Lease losses [g] |
3,411 | 4,417 | ||||||
| Recall accrual [a] |
1,025 | 185 | ||||||
| Distribution center closures [c] |
300 | 3,109 | ||||||
| Legal settlement [h] |
(5,289 | ) | | |||||
| Executive non-cash compensation [i] |
| 23,872 | ||||||
| Gain on sale of building and land [j] |
| (2,119 | ) | |||||
| Other expenses: |
||||||||
| Goodwill and tradename impairment [k] |
32,086 | 33,700 | ||||||
| Amortization of debt discount [l] |
39,216 | 27,926 | ||||||
| Loss on extinguishment of debt [m] |
917 | 4,880 | ||||||
|
|
|
|
|
|||||
| Subtotal adjusted items |
87,902 | 106,503 | ||||||
| Impact of income tax items [n] |
(14,847 | ) | (19,483 | ) | ||||
|
|
|
|
|
|||||
| Adjusted net income [o] |
$ | 223,694 | $ | 89,200 | ||||
|
|
|
|
|
|||||
| [a] | Represents a reduction in net revenues, impact on cost of goods sold, as well as accrual adjustments and insurance recoveries related to certain product recalls. |
| [b] | The adjustment includes accelerated depreciation expense of $2.6 million due to a change in the estimated useful life of certain assets and a $1.2 million inventory impairment charge related to holiday merchandise. |
| [c] | Represents disposals of inventory and property and equipment, lease related charges, inventory transfer costs and other costs associated with distribution center closures. |
| [d] | Represents the non-cash amortization of the inventory fair value adjustment recorded in connection with our acquisition of Waterworks. |
A-1
Table of Contents
| [e] | Represents the release of the remaining reserve for potential claims regarding anti-dumping duties which we believe have lapsed. The reserve related to potential tariff obligations of one of our foreign suppliers following the U.S. Department of Commerces review on the anti-dumping duty order on wooden bedroom furniture from China for the period from January 1, 2011 through December 31, 2011. |
| [f] | Represents severance costs and related taxes associated with reorganizations, including severance related to the closure of distribution centers and the Dallas customer call center as part of our supply chain reorganization. |
| [g] | The adjustment represents additional lease related charges due to the remeasurement of the lease loss liability for RH Contemporary Art resulting from an update to both the timing and the amount of future estimated lease related cash inflows in fiscal 2017 and fiscal 2018. |
| [h] | Represents a favorable legal settlement, net of related legal expenses. |
| [i] | Represents non-cash compensation charges related to a fully vested option grant made to Mr. Friedman in May 2017. |
| [j] | Represents the gain on the sale of building and land of one of our previously owned retail Galleries. |
| [k] | Represents goodwill and tradename impairment related to the Waterworks reporting unit. |
| [l] | Under GAAP, certain convertible debt instruments that may be settled in cash on conversion are required to be separately accounted for as liability and equity components of the instrument in a manner that reflects the issuers non-convertible debt borrowing rate. Accordingly, in accounting for GAAP purposes for the $350 million aggregate principal amount of convertible senior notes that were issued in June 2014 (the 2019 Notes), for the $300 million aggregate principal amount of convertible senior notes that were issued in June and July 2015 (the 2020 Notes) and for the $335 million aggregate principal amount of convertible senior notes that were issued in June 2018 (the 2023 Notes), we separated the 2019 Notes, 2020 Notes and 2023 Notes into liability (debt) and equity (conversion option) components and we are amortizing as debt discount an amount equal to the fair value of the equity components as interest expense on the 2019 Notes, 2020 Notes and 2023 Notes over their expected lives. The equity components represent the difference between the proceeds from the issuance of the 2019 Notes, 2020 Notes and 2023 Notes and the fair value of the liability components of the 2019 Notes, 2020 Notes and 2023 Notes, respectively. Amounts are presented net of interest capitalized for capital projects of $0.6 million and $0.2 million during the three months ended February 2, 2019 and February 3, 2018, respectively. Amounts are presented net of interest capitalized for capital projects of $2.7 million and $2.5 million during fiscal 2018 and fiscal 2017, respectively. |
| [m] | Represents the loss on extinguishment of debt related to the LILO term loan, the promissory note secured by our aircraft and the equipment security notes, all of which were repaid in full in June 2018, as well as the second lien term loan which was repaid in full in October 2017. |
| [n] | The adjustment for the three months ended February 2, 2019 is based on an adjusted tax rate of 21.8% which excludes a $3.6 million tax impact associated with the Waterworks reporting unit goodwill impairment. The adjustment for the three months ended February 3, 2018 is based on an adjusted tax rate of 34.0% which excludes the impact of tax reform, including the $6.0 million revaluation of the net deferred tax assets and $1.0 million transitional tax, as well as the $5.9 million tax impact associated with the Waterworks reporting unit goodwill impairment. The year ended February 2, 2019 and February 3, 2018 include adjustments to calculate income tax expense at adjusted tax rates of 16.9% and 34.7%, respectively, which are calculated based on the weighted-average fiscal 2018 and fiscal 2017 quarterly effective tax rates and exclude the impact of tax reform and the tax impact associated with the Waterworks reporting unit goodwill impairment. |
| [o] | Adjusted net income is a supplemental measure of financial performance that is not required by, or presented in accordance with, GAAP. We define adjusted net income as net income, adjusted for the impact of certain non-recurring and other items that we do not consider representative of our underlying operating performance. Management believes that adjusted net income provides meaningful supplemental information for investors regarding the performance of our business and facilitates a meaningful evaluation of actual results on a comparable basis with historical results. Our management uses this non-GAAP financial measure in order to have comparable financial results to analyze changes in our underlying business from quarter to quarter. |
A-2
Table of Contents
RECONCILIATION OF DILUTED NET INCOME PER SHARE TO ADJUSTED DILUTED NET INCOME PER SHARE
(Unaudited)
| YEAR ENDED | ||||||||
| FEBRUARY 2, 2019 | FEBRUARY 3, 2018 | |||||||
| Diluted net income per share |
$ | 5.68 | $ | 0.07 | ||||
| Pro forma diluted net income per share [a] |
$ | 5.75 | $ | 0.07 | ||||
| EPS impact of adjustments (pre-tax) [b]: |
||||||||
| Amortization of debt discount |
1.50 | 0.95 | ||||||
| Goodwill and tradename impairment |
1.23 | 1.15 | ||||||
| Reorganization related costs |
0.38 | 0.03 | ||||||
| Asset impairments |
0.14 | | ||||||
| Lease losses |
0.13 | 0.15 | ||||||
| Distribution center closures |
0.07 | 0.17 | ||||||
| Recall accrual |
0.06 | 0.26 | ||||||
| Loss on extinguishment of debt |
0.04 | 0.17 | ||||||
| Impact of inventory step-up |
0.01 | 0.10 | ||||||
| Legal settlement |
(0.20 | ) | | |||||
| Executive non-cash compensation |
| 0.82 | ||||||
| Anti-dumping exposure |
| (0.08 | ) | |||||
| Gain on sale of building and land |
| (0.07 | ) | |||||
|
|
|
|
|
|||||
| Subtotal adjusted items |
3.36 | 3.65 | ||||||
| Impact of income tax items [b] |
(0.57 | ) | (0.67 | ) | ||||
|
|
|
|
|
|||||
| Adjusted diluted net income per share [c] |
$ | 8.54 | $ | 3.05 | ||||
|
|
|
|
|
|||||
| [a] | For GAAP purposes, we incur dilution above the lower strike prices of our 2019 Notes, 2020 Notes and 2023 Notes of $116.09, $118.13 and $193.65, respectively. However, we exclude from our adjusted diluted shares outstanding calculation the dilutive impact of the convertible notes between $116.09 and $171.98 for our 2019 Notes, between $118.13 and $189.00 for our 2020 Notes, and between $193.65 and $309.84 for our 2023 Notes, based on the bond hedge contracts in place that will deliver shares to offset dilution in these ranges. At stock prices in excess of $171.98, $189.00 and $309.84, we will incur dilution related to the 2019 Notes, 2020 Notes and 2023 Notes, respectively, and our obligation to deliver additional shares in excess of the dilution protection provided by the bond hedges. Pro forma diluted net income per share for the three months ended February 2, 2019 is calculated based on GAAP net income and pro forma diluted weighted-average shares of 25,360,886, which excludes dilution related to the 2019 Notes and 2020 Notes of 341,905 shares. Pro forma diluted net income per share for the year ended February 2, 2019 is calculated based on GAAP net income and pro forma diluted weighted-average shares of 26,180,981, which excludes dilution related to the 2019 Notes and 2020 Notes of 352,244 shares. |
| [b] | Refer to table titled Reconciliation of GAAP Net Income to Adjusted Net Income and the related footnotes for additional information. |
| [c] | Adjusted diluted net income per share is a supplemental measure of financial performance that is not required by, or presented in accordance with, GAAP. We define adjusted diluted net income per share as net income, adjusted for the impact of certain non-recurring and other items that we do not consider representative of our underlying operating performance divided by the Companys share count. Management believes that adjusted diluted net income per share provides meaningful supplemental information for investors regarding the performance of our business and facilitates a meaningful evaluation of operating results on a comparable basis with historical results. Our management uses this non-GAAP financial measure in order to have comparable financial results to analyze changes in our underlying business from quarter to quarter. |
A-3
Table of Contents
RECONCILIATION OF NET REVENUES TO ADJUSTED NET REVENUES
(In thousands) (Unaudited)
| YEAR ENDED | ||||||||
| FEBRUARY 2, 2019 | FEBRUARY 3, 2018 | |||||||
| Net revenues |
$ | 2,505,653 | $ | 2,440,174 | ||||
| Recall accrual [a] |
4,733 | 3,207 | ||||||
|
|
|
|
|
|||||
| Adjusted net revenues [b] |
$ | 2,510,386 | $ | 2,443,381 | ||||
|
|
|
|
|
|||||
| [a] | Refer to table titled Reconciliation of GAAP Net Income to Adjusted Net Income and the related footnotes for additional information. |
| [b] | Adjusted net revenues and adjusted gross profit are supplemental measures of financial performance that are not required by, or presented in accordance with, GAAP. We define adjusted net revenues as net revenues, adjusted for the impact of certain non-recurring and other items that we do not consider representative of our underlying operating performance. We define adjusted gross profit as gross profit, adjusted for the impact of certain non-recurring and other items that we do not consider representative of our underlying operating performance. Management believes that adjusted net revenues and adjusted gross profit provide meaningful supplemental information for investors regarding the performance of our business and facilitates a meaningful evaluation of operating results on a comparable basis with historical results. Our management uses these non-GAAP financial measures in order to have comparable financial results to analyze changes in our underlying business from quarter to quarter. |
A-4
Table of Contents
RECONCILIATION OF NET INCOME TO OPERATING INCOME AND ADJUSTED OPERATING INCOME
(In thousands) (Unaudited)
| YEAR ENDED | ||||||||
| FEBRUARY 2, 2019 | FEBRUARY 3, 2018 | |||||||
| Net income |
$ | 150,639 | $ | 2,180 | ||||
| Interest expensenet |
75,074 | 62,570 | ||||||
| Goodwill and tradename impairment |
32,086 | 33,700 | ||||||
| Loss on extinguishment of debt |
917 | 4,880 | ||||||
| Income tax expense |
30,514 | 27,971 | ||||||
|
|
|
|
|
|||||
| Operating income |
289,230 | 131,301 | ||||||
| Reorganization related costs [a] |
9,977 | 949 | ||||||
| Asset impairments [a] |
3,807 | | ||||||
| Lease losses [a] |
3,411 | 4,417 | ||||||
| Distribution center closures [a] |
1,778 | 4,846 | ||||||
| Recall accrual [a] |
1,619 | 7,707 | ||||||
| Impact of inventory step-up [a] |
380 | 2,527 | ||||||
| Legal settlement [a] |
(5,289 | ) | | |||||
| Executive non-cash compensation [a] |
| 23,872 | ||||||
| Anti-dumping exposure [a] |
| (2,202 | ) | |||||
| Gain on sale of building and land [a] |
| (2,119 | ) | |||||
|
|
|
|
|
|||||
| Adjusted operating income [b] |
$ | 304,913 | $ | 171,298 | ||||
|
|
|
|
|
|||||
| Net revenues |
$ | 2,505,653 | $ | 2,440,174 | ||||
|
|
|
|
|
|||||
| Adjusted net revenues [c] |
$ | 2,510,386 | $ | 2,443,381 | ||||
|
|
|
|
|
|||||
| Operating margin [c] |
11.5 | % | 5.4 | % | ||||
|
|
|
|
|
|||||
| Adjusted operating margin [c] |
12.1 | % | 7.0 | % | ||||
|
|
|
|
|
|||||
| [a] | Refer to table titled Reconciliation of GAAP Net Income to Adjusted Net Income and the related footnotes for additional information. |
| [b] | Adjusted operating income is a supplemental measure of financial performance that is not required by, or presented in accordance with, GAAP. We define adjusted operating income as operating income, adjusted for the impact of certain non-recurring and other items that we do not consider representative of our underlying operating performance. Management believes that adjusted operating income provides meaningful supplemental information for investors regarding the performance of our business and facilitates a meaningful evaluation of operating results on a comparable basis with historical results. Our management uses this non-GAAP financial measure in order to have comparable financial results to analyze changes in our underlying business from quarter to quarter. |
| [c] | Operating margin is defined as operating income divided by net revenues. Adjusted operating margin is defined as adjusted operating income divided by adjusted net revenues. Refer to table titled Reconciliation of Net Revenues to Adjusted Net Revenues and the related footnotes for a definition and reconciliation of adjusted net revenues. |
A-5