10-K: Annual report pursuant to Section 13 and 15(d)
Published on March 29, 2019
UNITED STATES
SECURITIES AND EXCHANGE COMMISSION
Washington, D.C. 20549
FORM 10-K
(Mark One)
|
☒ |
ANNUAL REPORT PURSUANT TO SECTION 13 OR 15(d) OF THE SECURITIES EXCHANGE ACT OF 1934 |
For the fiscal year ended February 2, 2019
or
|
☐ |
TRANSITION REPORT PURSUANT TO SECTION 13 OR 15(d) OF THE SECURITIES EXCHANGE ACT OF 1934 |
For the transition period from to
Commission file number: 001-35720

(Exact name of registrant as specified in its charter)
|
Delaware |
|
45-3052669 |
|
(State or other jurisdiction of incorporation or organization) |
|
(I.R.S. Employer Identification Number) |
|
15 Koch Road Corte Madera, CA (Address of principal executive offices) |
|
94925 (Zip Code) |
Registrant’s telephone number, including area code: (415) 924-1005
Securities registered pursuant to Section 12(b) of the Act:
|
Common Stock, $0.0001 par value |
|
|
New York Stock Exchange, Inc. |
|
(Title of class) |
|
|
(Name of each exchange on which registered) |
Securities registered pursuant to Section 12(g) of the Act: None
Indicate by check mark if the registrant is a well-known seasoned issuer, as defined in Rule 405 of the Securities Act. Yes ☒ No ☐
Indicate by check mark if the registrant is not required to file reports pursuant to Section 13 or Section 15(d) of the Act. Yes ☐ No ☒
Indicate by check mark whether the registrant (1) has filed all reports required to be filed by Section 13 or 15(d) of the Securities Exchange Act of 1934 during the preceding 12 months (or for such shorter period that the registrant was required to file such reports), and (2) has been subject to such filing requirements for the past 90 days. Yes ☒ No ☐
Indicate by check mark whether the registrant has submitted electronically every Interactive Data File required to be submitted pursuant to Rule 405 of Regulation S-T (§232.405 of this chapter) during the preceding 12 months (or for such shorter period that the registrant was required to submit such files). Yes ☒ No ☐
Indicate by check mark if disclosure of delinquent filers pursuant to Item 405 of Regulation S-K (§229.405 of this chapter) is not contained herein, and will not be contained, to the best of registrant’s knowledge, in definitive proxy or information statements incorporated by reference in Part III of this Form 10-K or any amendment to this Form 10-K. ☐
Indicate by check mark whether the registrant is a large accelerated filer, an accelerated filer, a non-accelerated filer, a smaller reporting company, or an emerging growth company. See the definitions of “large accelerated filer,” “accelerated filer,” “smaller reporting company,” and “emerging growth company” in Rule 12b-2 of the Exchange Act.
|
Large accelerated filer |
☒ |
Accelerated filer |
☐ |
|
|
|
|
|
|
Non-accelerated filer |
☐ |
Smaller reporting company |
☐ |
|
|
|
|
|
|
Emerging growth company |
☐ |
|
|
If an emerging growth company, indicate by check mark if the registrant has elected not to use the extended transition period for complying with any new or revised financial accounting standards provided pursuant to Section 13(a) of the Exchange Act.
Indicate by check mark whether the registrant is a shell company (as defined in Rule 12b-2 of the Exchange Act). Yes ☐ No ☒
As of August 3, 2018, the last business day of the registrant’s most recently completed second quarter, the approximate market value of the registrant’s common stock held by non-affiliates was $2,651,665,414. Solely for purposes of this disclosure, shares of common stock held by executive officers and directors of the registrant as of such date have been excluded because such persons may be deemed to be affiliates.
As of March 22, 2019, 20,478,213 shares of registrant’s common stock were outstanding.
DOCUMENTS INCORPORATED BY REFERENCE
Portions of the registrant’s Proxy Statement for its 2019 Annual Meeting of Stockholders are incorporated by reference in Part III of this Annual Report on Form 10-K where indicated. Such proxy statement will be filed with the Securities and Exchange Commission within 120 days of the registrant’s fiscal year ended February 2, 2019.
INDEX TO FORM 10-K
|
|
|
|
|
Page |
|
|
|
|
|
|
|
Item 1. |
|
|
1 |
|
|
Item 1A. |
|
|
9 |
|
|
Item 1B. |
|
|
32 |
|
|
Item 2. |
|
|
32 |
|
|
Item 3. |
|
|
33 |
|
|
Item 4. |
|
|
33 |
|
|
|
|
|
|
|
|
|
|
|
|
|
|
Item 5. |
|
|
34 |
|
|
Item 6. |
|
|
36 |
|
|
Item 7. |
|
Management’s Discussion And Analysis of Financial Condition and Results of Operations |
|
42 |
|
Item 7A. |
|
|
77 |
|
|
Item 8. |
|
|
78 |
|
|
Item 9. |
|
Changes in and Disagreements with Accountants on Accounting and Financial Disclosure |
|
130 |
|
Item 9A. |
|
|
130 |
|
|
Item 9B. |
|
|
130 |
|
|
|
|
|
|
|
|
|
|
|
|
|
|
Item 10. |
|
|
132 |
|
|
Item 11. |
|
|
132 |
|
|
Item 12. |
|
Security Ownership of Certain Beneficial Owners and Management and Related Stockholder Matters |
|
132 |
|
Item 13. |
|
Certain Relationships and Related Transactions and Director Independence |
|
132 |
|
Item 14. |
|
|
132 |
|
|
|
|
|
|
|
|
|
|
|
|
|
|
Item 15. |
|
|
133 |
|
|
Item 16. |
|
|
133 |
i
SPECIAL NOTE REGARDING FORWARD-LOOKING STATEMENTS AND MARKET DATA
This annual report contains forward-looking statements that are subject to risks and uncertainties. Forward-looking statements give our current expectations and projections relating to our financial condition, results of operations, plans, objectives, future performance and business. You can identify forward-looking statements by the fact that they do not relate strictly to historical or current facts. These statements may include words such as “anticipate,” “estimate,” “expect,” “project,” “plan,” “intend,” “believe,” “may,” “will,” “short-term,” “non-recurring,” “one-time,” “unusual,” “should,” “likely” and other words and terms of similar meaning in connection with any discussion of the timing or nature of future operating or financial performance or other events.
Forward-looking statements are subject to risk and uncertainties that may cause actual results to differ materially from those that we expected. We derive many of our forward-looking statements from our operating budgets and forecasts, which are based upon many detailed assumptions. While we believe that our assumptions are reasonable, we caution that it is very difficult to predict the impact of known factors and it is impossible for us to anticipate all factors that could affect our actual results and matters that we identify as “short term,” “non-recurring,” “unusual,” “one-time,” or other words and terms of similar meaning may in fact recur in one or more future financial reporting periods. Important factors that could cause actual results to differ materially from our expectations, or cautionary statements, are disclosed in Item 1A—Risk Factors, Item 7—Management’s Discussion and Analysis of Financial Condition and Results of Operations, and elsewhere in this annual report. All forward-looking statements attributable to us, or persons acting on our behalf, are expressly qualified in their entirety by these cautionary statements, as well as other cautionary statements. You should evaluate all forward-looking statements made in this annual report in the context of these risks and uncertainties.
We cannot assure you that we will realize the results or developments we expect or anticipate or, even if substantially realized, that they will result in the consequences or affect us or our operations in the way we expect. The forward-looking statements included in this annual report are made only as of the date hereof. We undertake no obligation to publicly update or revise any forward-looking statement, whether as a result of new information, future events or otherwise, except as otherwise required by law.
ii
Overview
RH (“we,” “us,” or the “Company”) is a leading luxury retailer in the home furnishings marketplace. Our curated and fully-integrated assortments are presented consistently across our sales channels in sophisticated and unique lifestyle settings that we believe are on par with world-class interior designers. We offer dominant merchandise assortments across a growing number of categories, including furniture, lighting, textiles, bathware, décor, outdoor and garden, and child and teen furnishings. We position our Galleries as showrooms for our brand, while our Source Books and websites act as virtual extensions of our stores. In 2015 we began to introduce an integrated hospitality experience, including cafés, wine vaults and barista bars, into a number of our new Gallery locations. We believe this has created a unique new retail experience that cannot be replicated online, and that the addition of hospitality is helping to drive incremental sales of home furnishings in these Galleries.
Our business is fully integrated across our multiple channels of distribution, consisting of our stores, Source Books, and websites. As of February 2, 2019, we operated a total of 86 retail Galleries consisting of 20 Design Galleries, 43 legacy Galleries, 2 RH Modern Galleries and 6 RH Baby & Child Galleries throughout the United States and Canada, and 15 Waterworks showrooms throughout the United States and in the U.K. As of February 2, 2019, 6 of our Design Galleries include an integrated RH Hospitality experience and we plan to incorporate hospitality, including cafés, wine vaults and barista bars in many of the new Galleries that we open in the future. As of February 2, 2019, we operated 39 outlet stores throughout the United States and Canada.
Products and Product Development
We have positioned RH as a lifestyle brand and design authority by offering dominant merchandise assortments. We are merchants of luxury home furnishings and our luxury products embody our design aesthetic and reflect inspiration from across the centuries and around the globe.
We have developed a proprietary product development platform that is fully integrated from ideation to presentation. Key aspects of our product development platform are:
|
|
• |
Organization—We have established a collaborative, cross-functional organization centered on product leadership and coordinated across our product development, sourcing, merchandising, inventory and creative teams. Our product teams are focused on maximizing the sales potential of each product category across all channels, which eliminates channel conflicts and functional redundancies. |
|
|
• |
Process—For many of our products, we work closely with our network of artisan partners who possess specialized product development and manufacturing capabilities and who we consider an extension of our product development team. We collaborate with our global network of specialty vendors and manufacturers to produce artisanal pieces on a large scale with a high level of quality and value, including both distinctive original designs and reinterpretations of antiques. |
|
|
• |
Facility—We have built the RH Center of Innovation and Product Leadership, a facility which supports the entire product development process from product ideation to presentation for all channels. |
As a result of our proprietary organization, process and facility, our typical product lead times are 3 – 9 months, which enhances our ability to introduce more new products with each collection. In addition, our product development platform, sourcing capabilities and significant scale enable us to reduce our product costs.
Sales Channels
We distribute our products through a fully integrated sales platform comprised of our Stores, E-Commerce, Source Books and Trade and Contract. We believe the level of integration among all of our channels and our approach to the market distinguishes us from most other retailers. For fiscal 2018, sales of products originating in our stores represented 56% of our net revenues, while sales from our direct businesses represented 44% of our net revenues. We believe our channels complement each other and our customers’ buying decisions are influenced by their experiences across more than one of our sales channels. We encourage our customers to shop across our channels and have aligned our business and internal organization to be channel agnostic. Our integrated distribution and product delivery network serves all of our channels. We believe the key advantage of our multiple sales channels is our ability to leverage the unique attributes of each channel in our approach to the market.
1
Retail Galleries
Our retail Galleries are located in upscale malls and street locations, as well as in iconic locations. We believe situating our Galleries in desirable locations is critical to the success of our business, and we identify Gallery locations based on a variety of factors, including deal economics and availability of suitable new site locations based on several store specific aspects, such as geographic location, demographics, and proximity to affluent consumers. We pursue a market-based sales strategy, whereby we assess each market’s overall sales potential and how best to approach the market across all of our channels. We customize square footage, as well as catalog circulation, to maximize each market’s sales potential and increase our return on invested capital.
Our retail Galleries reinforce our luxury brand aesthetic and are highly differentiated from other home furnishings retailers. We have revolutionized the customer experience by showcasing products in a sophisticated lifestyle setting that we believe is on par with world-class interior designers, consistent with the imagery and product presentation featured in our catalogs and on our websites. Products in our Galleries are presented in fully appointed rooms, emphasizing collections over individual pieces. This presentation encourages a higher average order value as customers are inspired to consider purchasing a full collection of products to replicate the design aesthetic experienced in our Galleries. In addition, our store associates use iPads and other devices to allow customers to shop our entire merchandise assortment while in the Gallery.
We operate the following distinct store types as of February 2, 2019:
|
|
1) |
Design Galleries, which average approximately 33,000 leased selling square feet; |
|
|
2) |
Legacy Galleries, which average approximately 8,000 leased selling square feet; |
|
|
3) |
RH Modern Galleries, which are located in Los Angeles and Dallas, and which average approximately 11,000 leased selling square feet; |
|
|
4) |
RH Baby & Child Galleries, which average approximately 4,000 leased selling square feet; and |
|
|
5) |
Waterworks showrooms, which average approximately 4,000 leased selling square feet. |
We have identified key learnings from our real estate transformation that have supported the development of a new multi-tier market approach that we believe will optimize both market share and return on invested capital over time.
First, we have developed a new RH prototype Design Gallery that is an innovative and flexible blueprint, which we believe will enable us to more quickly place our disruptive product assortment and immersive retail experience into the market. The new model is a standard we will utilize in the future that is based on key learnings from our recent Gallery openings and will range in size from 33,000 leased selling square feet inclusive of our integrated hospitality experience to 29,000 leased selling square feet without. These new Galleries will represent our assortments from RH Interiors, Modern, Baby & Child, Teen and Outdoor and contain interior design offices and presentation rooms where design professionals can work with clients on their projects. Due to the reduced square footage compared to our recent Design Gallery openings and the efficient design, this new model will be more capital efficient with less development time and cost risk, but yield similar productivity. We anticipate the new prototype Design Galleries will represent approximately two thirds of our target markets. Future prototype location examples include Edina, MN, Corte Madera, CA, Columbus, OH and Charlotte, NC.
Second, we will continue to develop and open larger Bespoke Design Galleries in the top metropolitan markets, similar to those we opened in New York and Chicago. These iconic locations are highly profitable statements for our brand, and we believe they create a long-term competitive advantage that will be difficult to duplicate.
Third, we will continue to open indigenous Bespoke Galleries in the best second home markets where the wealthy and affluent visit and vacation. These Galleries are tailored to reflect the local culture and are sized to the potential of each market. Examples of indigenous Bespoke Galleries include the Hamptons, Palm Beach, Yountville and Aspen.
Fourth, we are developing a new Gallery model tailored to secondary markets. Targeted to be 10,000 to 18,000 square feet, we believe these smaller expressions of our brand will enable us to gain share in markets currently only served by smaller competitors. Examples of target secondary markets include Hartford, CT, Oklahoma City, OK and Milwaukee, WI, among others. We expect these Galleries to require a substantially smaller net investment than our larger Design Galleries and to pay back our capital investment within two years in most instances. Our plan is to test a few of these Galleries over the next several years, and if proven successful, this format could lead to an increase in our long-term Gallery targets.
2
We believe our multi-tier market approach to transforming our real estate will enable us to ramp our opening cadence from 3 to 5 new Galleries per year, to a pace of 5 to 7 new Galleries per year.
We continue to evaluate potential opportunities for standalone RH Baby & Child, RH Teen and RH Modern Galleries in select markets.
In 2015 we began to introduce an integrated hospitality experience, including cafés, wine vaults and barista bars, into a number of our new Gallery locations. We believe this has created a unique new retail experience that cannot be replicated online, and that the addition of hospitality is helping to drive incremental sales of home furnishings in these Galleries. As of February 2, 2019, 6 of our Design Galleries include an integrated RH Hospitality experience and we plan to incorporate hospitality, including cafés, wine vaults and barista bars in many of the new Galleries that we open in the future.
|
Retail Gallery Metrics (1) |
|
||||||||||||||
|
|
|
|
|
|
|
|
|
|
|
|
|
|
|
|
|
|
|
Year Ended |
|
|||||||||||||
|
|
February 2, 2019 |
|
|
February 3, 2018 |
|
||||||||||
|
|
Store Count |
|
|
Total Leased Selling Square Footage (2) |
|
|
Store Count |
|
|
Total Leased Selling Square Footage (2) |
|
||||
|
|
|
|
|
|
(in thousands) |
|
|
|
|
|
|
(in thousands) |
|
||
|
Beginning of period |
|
83 |
|
|
|
981 |
|
|
|
85 |
|
|
|
912 |
|
|
Design Galleries opened: |
|
|
|
|
|
|
|
|
|
|
|
|
|
|
|
|
Portland Design Gallery |
|
1 |
|
|
|
26.0 |
|
|
— |
|
|
— |
|
||
|
Nashville Design Gallery |
|
1 |
|
|
|
45.6 |
|
|
— |
|
|
— |
|
||
|
New York Design Gallery |
|
1 |
|
|
|
50.5 |
|
|
— |
|
|
— |
|
||
|
Yountville Design Gallery |
|
1 |
|
|
|
6.7 |
|
|
— |
|
|
— |
|
||
|
Toronto (Yorkdale) Design Gallery |
— |
|
|
— |
|
|
|
1 |
|
|
|
43.3 |
|
||
|
West Palm Design Gallery |
— |
|
|
— |
|
|
|
1 |
|
|
|
46.5 |
|
||
|
Modern Galleries opened: |
|
|
|
|
|
|
|
|
|
|
|
|
|
|
|
|
Dallas RH Modern Gallery |
|
1 |
|
|
|
8.2 |
|
|
— |
|
|
— |
|
||
|
Baby & Child Galleries opened: |
|
|
|
|
|
|
|
|
|
|
|
|
|
|
|
|
Portland RH Baby & Child Gallery |
|
1 |
|
|
|
4.7 |
|
|
— |
|
|
— |
|
||
|
Dallas RH Baby & Child Gallery |
|
1 |
|
|
|
3.7 |
|
|
— |
|
|
— |
|
||
|
Waterworks Showrooms opened: |
|
|
|
|
|
|
|
|
|
|
|
|
|
|
|
|
Waterworks Scottsdale Showroom |
|
1 |
|
|
|
2.2 |
|
|
— |
|
|
— |
|
||
|
Waterworks Boston Showroom |
— |
|
|
— |
|
|
|
1 |
|
|
|
5.0 |
|
||
|
Legacy Galleries closed: |
|
|
|
|
|
|
|
|
|
|
|
|
|
|
|
|
Portland legacy Gallery |
|
(1 |
) |
|
|
(4.7 |
) |
|
— |
|
|
— |
|
||
|
Nashville legacy Gallery |
|
(1 |
) |
|
|
(7.1 |
) |
|
— |
|
|
— |
|
||
|
Washington DC legacy Gallery |
|
(1 |
) |
|
|
(5.6 |
) |
|
— |
|
|
— |
|
||
|
NY Flatiron legacy Gallery |
|
(1 |
) |
|
|
(21.4 |
) |
|
— |
|
|
— |
|
||
|
Toronto (Bay View) legacy Gallery |
— |
|
|
— |
|
|
|
(1 |
) |
|
|
(6.0 |
) |
||
|
Toronto (Yonge Street) legacy Gallery |
— |
|
|
— |
|
|
|
(1 |
) |
|
|
(8.6 |
) |
||
|
West Palm legacy Gallery |
— |
|
|
— |
|
|
|
(1 |
) |
|
|
(7.1 |
) |
||
|
Baby & Child Galleries closed: |
|
|
|
|
|
|
|
|
|
|
|
|
|
|
|
|
West Palm Baby & Child Gallery |
— |
|
|
— |
|
|
|
(1 |
) |
|
|
(2.5 |
) |
||
|
Waterworks Showrooms closed: |
|
|
|
|
|
|
|
|
|
|
|
|
|
|
|
|
Waterworks Scottsdale Showroom |
|
(1 |
) |
|
|
(1.1 |
) |
|
— |
|
|
— |
|
||
|
Waterworks Boston Showroom |
— |
|
|
— |
|
|
|
(1 |
) |
|
|
(2.1 |
) |
||
|
End of period |
|
86 |
|
|
|
1,089 |
|
|
|
83 |
|
|
|
981 |
|
|
|
|
|
|
|
|
|
|
|
|
|
|
|
|
|
|
|
Total leased square footage at end of period (3) |
|
|
|
|
|
1,467 |
|
|
|
|
|
|
|
1,318 |
|
|
Weighted-average leased square footage (4) |
|
|
|
|
|
1,409 |
|
|
|
|
|
|
|
1,262 |
|
|
Weighted-average leased selling square footage (4) |
|
|
|
|
|
1,047 |
|
|
|
|
|
|
|
930 |
|
|
Retail sales per leased selling square foot (5) |
|
|
|
|
$ |
1,177 |
|
|
|
|
|
|
$ |
1,252 |
|
|
(1) |
Retail data excludes outlet stores. |
|
(2) |
Leased selling square footage is retail space at our stores used to sell our products. Leased selling square footage excludes backrooms at retail stores used for storage, office space, food preparation, kitchen space or similar purpose, as well as exterior sales space located outside a store, such as courtyards, gardens and rooftops. Leased selling square footage for fiscal 2018 includes approximately 11,600 square feet related to two owned store locations. Leased selling square footage for fiscal 2017 includes approximately 4,800 square feet related to one owned store location. |
3
|
(4) |
Weighted-average leased square footage and leased selling square footage are calculated based on the number of days a Gallery location was opened during the period divided by the total number of days in the period. |
|
(5) |
Retail sales per leased selling square foot is calculated by dividing total net revenues for all retail stores, comparable and non-comparable, by the weighted-average leased selling square footage for the period. |
The following list shows the number of retail Galleries and showrooms in each U.S. state, each Canadian province and in the U.K. where we operate as of February 2, 2019:
|
Location |
|
Store |
|
|
Location |
|
Store |
|
|
Location |
|
Store |
|
|||
|
Alabama |
|
|
1 |
|
|
Massachusetts |
|
|
2 |
|
|
Tennessee |
|
|
1 |
|
|
Arizona |
|
|
2 |
|
|
Michigan |
|
|
1 |
|
|
Texas |
|
|
9 |
|
|
California |
|
|
20 |
|
|
Minnesota |
|
|
1 |
|
|
Utah |
|
|
1 |
|
|
Colorado |
|
|
2 |
|
|
Missouri |
|
|
1 |
|
|
Virginia |
|
|
2 |
|
|
Connecticut |
|
|
4 |
|
|
Nevada |
|
|
1 |
|
|
Washington |
|
|
1 |
|
|
Florida |
|
|
5 |
|
|
New Jersey |
|
|
2 |
|
|
District of Columbia |
|
|
1 |
|
|
Georgia |
|
|
2 |
|
|
New York |
|
|
5 |
|
|
Alberta |
|
|
2 |
|
|
Illinois |
|
|
3 |
|
|
North Carolina |
|
|
2 |
|
|
British Columbia |
|
|
1 |
|
|
Indiana |
|
|
1 |
|
|
Ohio |
|
|
3 |
|
|
Ontario |
|
|
1 |
|
|
Kansas |
|
|
1 |
|
|
Oklahoma |
|
|
1 |
|
|
London (1) |
|
|
1 |
|
|
Louisiana |
|
|
1 |
|
|
Oregon |
|
|
2 |
|
|
|
|
|
|
|
|
Maryland |
|
|
1 |
|
|
Pennsylvania |
|
|
2 |
|
|
Total |
|
|
86 |
|
|
(1) |
The London location is a Waterworks showroom. |
We continually analyze opportunities to selectively consolidate stores in connection with openings of our Design Galleries or close stores that have been under-performing or are no longer consistent with our brand positioning. In many cases, we continue to operate a store until its lease has expired in order to effect the closure in a cost-efficient manner.
Outlet Stores
Our outlet stores are branded as Restoration Hardware Outlet or RH Outlet and are typically located in outlet malls. Our outlet stores serve as a key part of our reverse logistics platform and provide an efficient means to sell primarily returned merchandise and, to a lesser extent, discontinued and overstock merchandise outside of our core sales channels.
E-Commerce
Our primary RH websites, www.rh.com, www.restorationhardware.com, www.rhmodern.com, www.rhbabyandchild.com and www.rhteen.com, provide our customers with the ability to purchase our merchandise online. We sell Waterworks products online through www.waterworks.com.
Our e-commerce platform allows our customers to experience the unique lifestyle settings reflected in our catalogs and throughout our stores, and to shop substantially all of our current product assortment. We update our websites regularly to reflect new products, product availability and occasionally special offers.
The RH websites also offer room-based navigation, which allows the customer to envision and shop items by room or by product, expanding on the richness of the online experience. For example, customers can search our websites for products by size or color, browse through our extensive product categories and see detailed information about each item and collection, such as dimensions, materials and care instructions. Additionally, customers can select color swatches and view merchandise displayed with different color and fabric options.
4
We produce a series of catalogs, which we refer to as Source Books, to showcase our merchandise assortment. In fiscal 2018, our mailed Source Books included RH Interiors, RH Outdoor, RH Modern, RH Rugs, RH Teen, RH Baby & Child and RH Holiday. Our Source Books are one of our primary branding and advertising vehicles. We have found that merchandise assortments displayed in our Source Books contribute to increased sales of those products across all of our channels. As in our retail stores, our Source Books present our merchandise in lifestyle settings that reflect our unique design aesthetic. Our Source Books also feature profiles of select artisan vendors and other compelling editorial content regarding home décor. All creative work on our Source Books is coordinated in-house in our RH Center of Innovation & Product Leadership, providing us greater control over the brand image presented to our customers, while also reducing our Source Book production costs.
Our Source Book mailings serve as a key driver of sales through both our websites and retail stores. Our customers respond to the Source Books across all of our channels, with sales trends closely correlating to the assortments that we emphasize and feature prominently in our Source Books, websites and retail Galleries. We continue to evaluate and optimize our Source Book strategy based on our experience.
We maintain a database of customer information, including customer information from our RH Members Program, which includes sales patterns, detailed purchasing information, certain demographic information, as well as mailing and email addresses. We mail our Source Books to addresses within this database and to addresses provided to us by third parties. The database supports our ability to analyze our customers’ buying behaviors across sales channels and facilitates the development of targeted marketing strategies, and is maintained in accordance with our privacy policy disclosed on our website. We segment our customer files based on multiple variables, and we tailor our Source Book mailings and emails in response to the purchasing patterns and product needs of our customers. We focus on continually improving the segmentation of customer files and the expansion of our customer database.
Our Source Books, in concert with our e-commerce channel, are a cost-effective means of testing new products, and allow us to launch categories in a disciplined, expeditious and cost-effective manner.
Trade and Contract
In addition to our core channels, we continue to expand into B2B channels, including Trade and Contract. In the Trade channel, we work directly with independent interior designers and decorators purchasing products for their clients’ residential projects. We also sell directly to customers who make purchases with the assistance of their interior designers or decorators, which we refer to as “designer-assisted sales.” Our Contract business supplies products to large-scale hospitality, commercial and residential development projects, working with architecture and design firms, developers and their ecosystem of business partners. These channels offer additional avenues for reaching new customers, including both businesses and individuals.
Marketing and Advertising
Our retail Galleries and our Source Books are the primary branding and advertising vehicles for the RH brands. In addition, we employ a variety of marketing and advertising vehicles to drive customer traffic across all our channels, strengthen and reinforce our brand image and acquire new customers. These include targeted Source Book circulation, promotional mailings, email communications, online and print advertisements, and public relations activities and events. We maintain a database of customers, which includes sales patterns, detailed purchasing information, certain demographic information, as well as mailing and email addresses. We use our customer database to tailor our programs and increase productivity of our marketing and promotion initiatives. We leverage our marketing and advertising expenses across all our channels as we seek to optimize the efficiency of our investment.
The highly-differentiated design aesthetic and shopping environment of our stores drive customer traffic not only to our stores but also to our direct channels. Our Source Books and targeted emails further reinforce the RH brand image and drive sales across all of our sales channels. We also engage in a wide range of other marketing, promotional and public relations activities to promote our brands. These campaigns include media coverage in design, lifestyle, culture/society and specialty publications, as well as in-store events related to new store openings and product launches. We also engage print advertising in brand-relevant publications such as Architectural Digest, Elle Décor, Veranda, Town and Country, The New York Times, WSJ and others, and deliver marketing messages to customers via online advertising. We believe that these efforts will drive increased brand awareness, leading to higher sales in our stores and our direct businesses over time.
5
The RH Members Program is an exclusive membership program that reimagines and simplifies the shopping experience. For an annual fee, the RH Members Program provides a set discount every day across all RH brands, excluding Waterworks, in addition to other benefits including complimentary interior design services through the RH Interior Design program and eligibility for preferred financing plans on the RH Credit Card, among other benefits. We introduced the RH Members Program in March 2016 as an alternative to prior practices involving numerous event-driven promotions. The RH Members Program allows our customers to shop for what they want, when they want, and receive the greatest value, which has resulted in orders and sales being more evenly distributed throughout the year as opposed to the peaks and valleys of orders and sales we experienced prior to the introduction of the program. We believe that our shift from a promotional event model to a membership model has enhanced the customer experience, rendered our brand more valuable, improved operational execution and reduced costs.
Sourcing
We primarily contract with third-party vendors for the manufacture of our merchandise. Our sourcing strategy focuses on identifying and using vendors that can provide the quality materials and fine craftsmanship that our customers expect of our brand. To ensure that our high standards of quality and timely delivery of merchandise are met, we work closely with vendors and manufacturers. Our products are generally made from readily available raw materials. We seek to ensure the consistent quality of our manufacturers’ products by selectively inspecting pre-production samples, conducting periodic site visits to certain of our vendors’ production facilities and selectively inspecting inbound shipments at our distribution facilities. In fiscal 2018, we sourced approximately 75% of our purchase dollar volume from approximately 27 vendors. In fiscal 2018, one vendor accounted for approximately 11% of our purchase dollar volume. Based on total dollar volume of purchases for fiscal 2018, approximately 73% of our products were sourced in Asia, with approximately 41% sourced from China, 15% from the United States and the remainder from other countries and regions. In fiscal 2017, approximately 77% of our products were sourced in Asia, with approximately 46% sourced from China, 14% from the United States and the remainder from other countries and regions.
RH is committed to offering safe, legal, high quality products, made consistently with our values. RH has a Compliance and Social Responsibility team dedicated to ensuring we keep these commitments through product testing, audits and other verification methods. Product testing is a core process for our organization. RH Baby & Child offers an extensive selection of GREENGUARD Gold Certificated children’s furniture. GREENGUARD Gold Certified products aid in the creation of healthier indoor environments by emitting fewer airborne chemical compounds that can contribute to health issues, including asthma, allergies and other respiratory conditions. We are in the process of obtaining GREENGUARD Certification for all of our indoor furniture products.
While we currently do not have any long-term merchandise supply contracts, we believe that we generally have strong relationships with our product vendors. Although we transact business primarily on an order-by-order basis, we typically work with many of our vendors over extended periods of time, and many vendors are making long-term capacity investments to serve our increasing demands.
Distribution and Delivery
We manage the distribution and delivery of our products through our distribution centers. We currently operate two furniture fulfillment centers and one small parcel fulfillment center servicing RH products, which are located strategically in three markets throughout the United States. We have one fulfillment center in the United States servicing Waterworks products.
In fiscal 2017, we began architecting a new operating platform in order to simplify our business, enhance the customer experience, and amplify decision quality and speed. Our initial efforts focused on our distribution center network and the home delivery experience. As a result of our work to redesign our distribution network and optimize inventory, we were able to forego building a fifth furniture distribution center planned to open in fiscal 2017, and completed the closure of our furniture fulfillment centers in Mira Loma, CA and Dallas, TX. In fiscal 2018, we completed the closure of our furniture fulfillment center in Essex, MD. In total, we eliminated 2.3 million square feet of distribution center space, resulting in savings in excess of $25 million annually. We believe servicing our furniture business from two coastal distribution centers will result in improved in-stock availability and faster inventory turns, while reducing operating costs.
We operate portions of our home delivery services in 16 key markets to leverage operating costs and improve our customers’ delivery experience, while reducing returns and damage to our products. We plan to continue to in-source these services in additional markets over time. We offer a white glove home delivery service for our larger merchandise and furniture categories, where third-party personnel deliver fully assembled items to the location of our customers’ choice. We believe there is an opportunity to improve the customer experience by taking greater control of the home delivery experience over time. We believe that many third-party furniture delivery providers are designed to support mass and mid-market companies and that significant opportunity exists for developing improved solutions for the luxury market. We have achieved significant scale such that we can now explore and test alternative solutions in many markets, including the use of our own trucks and drivers, and believe we can dramatically enhance the customer experience while reducing return rates, damages and deliveries per order.
6
Through our distribution center network redesign, reverse logistics and outlet redesign, and the reconceptualization of home delivery, we have improved our supply chain and fulfillment capabilities, and have built a scalable infrastructure to support our future growth. We believe our enhanced supply chain and fulfillment operations allow us to manage customer orders and distribute merchandise to our customers in an efficient and cost-effective manner. We also believe that these upgrades have improved customer satisfaction by reducing delivery times, reducing damage to merchandise, and improving our customer’s overall buying experience.
Competition
The home furnishings industry is highly competitive. We primarily compete against a large number of independent retailers that provide unique items and custom-designed product offerings at high price points, including antique dealers and home furnishings retailers who market to the interior design community. We also compete with national and regional home furnishings retailers and department stores, as well as with mail order catalogs and online retailers focused on home furnishings.
We believe that we compete primarily on the basis of design, quality and value, and that our distinct combination of these elements, along with the strength of our brand and our fully integrated multi-channel business model, allows us to compete effectively and differentiate ourselves from competitors. We compete with the interior design trade and specialty merchants by providing a high quality, broad product assortment at an exceptional value. We compete against certain other home furnishings retailers primarily by offering what we believe are superior quality, highly distinctive design styles and a sophisticated lifestyle presentation in our product offering.
We also believe that our success depends in substantial part on our ability to originate and define product trends, as well as to timely anticipate, gauge and react to changing consumer demands. Certain competitors are larger and have greater financial, marketing and other resources than us. However, many smaller specialty retailers may lack the financial resources, infrastructure, scale and national brand identity necessary to compete effectively with us. We believe we are effectively positioned to gain market share from both of these segments and drive growth.
Employees
As of February 2, 2019, we had approximately 5,200 employees, of which approximately 800 were part-time employees. As of that date, approximately 2,300 of our employees were based in our stores. None of our employees are represented by a union, and we have had no labor-related work stoppages. We believe our relations with our employees are good.
Intellectual Property
The “RH,” “Restoration Hardware,” “RH Modern,” “RH Baby & Child,” “RH Teen,” “Waterworks,” and “Waterworks Studio” trademarks, among others, are registered or are the subject of pending trademark applications with the United States Patent and Trademark Office and with the trademark registries of several foreign countries. Each of our trademark registrations is perpetually renewable provided that we use or continue to use the trademarks in commerce in the particular geographic market and for the goods or services covered by the registration. In addition, we own many domain names, including “restorationhardware.com,” “rh.com,” “rhmodern.com,” “rhbabyandchild.com,” “rhteen.com,” and “waterworks.com” and others that include our trademarks. These domain names are perpetually renewable. We own design patents or pending applications to protect the ornamental appearance of several of our products. These design patents are valid for 14 years from the date of issuance. We own copyrights, including copyright registrations or pending applications, for our website and for several of our Source Books. We believe that our trademarks, design patents, and copyrights have significant value and we vigorously protect them against infringement.
Fluctuation in Quarterly Results
Our quarterly results vary depending upon a variety of factors, including our product offerings, store openings, shifts in the timing of holidays and the timing of Source Book releases, promotional events and the timing and extent of our realization of the costs and benefits of our numerous strategic initiatives, among other things. As a result of these factors, our working capital requirements and demands on our product distribution and delivery network may fluctuate during the year. Unique factors in any given quarter may affect period-to-period comparisons between the quarters being compared, and the results for any quarter are not necessarily indicative of the results that we may achieve for a full fiscal year.
Corporate Information
The Company was formed as a Delaware corporation on August 18, 2011. On November 7, 2012, the Company completed an initial public offering. On December 15, 2016, Restoration Hardware Holdings, Inc. filed a Certificate of Amendment to its Amended and Restated Certificate of Incorporation with the Secretary of State of the State of Delaware to change its name to “RH,” effective January 1, 2017.
7
We are subject to numerous regulations, including labor and employment laws, customs, laws governing truth-in-advertising, consumer protection, privacy, safety, real estate, environmental and zoning and occupancy laws, and other laws and regulations that regulate retailers and govern the promotion and sale of merchandise and the operation of our Galleries, outlets and warehouse facilities, in the United States, Canada and the U.K., as well as in jurisdictions from which we source our products. We believe we are in material compliance with laws applicable to our business.
Where You Can Find More Information
We are required to file annual, quarterly and current reports, proxy statements and other information required by the Securities Exchange Act of 1934, as amended, with the SEC. The SEC maintains a website that contains reports, proxy statements and other information about issuers, like us, who file electronically with the SEC. The address of that website is http://www.sec.gov.
We maintain public internet sites at www.restorationhardware.com and www.rh.com and make available, free of charge, through these sites our Annual Reports on Form 10-K, Quarterly Reports on Form 10-Q, Current Reports on Form 8-K, Proxy Statements and Forms 3, 4 and 5 filed on behalf of directors and executive officers, as well as any amendments to those reports filed or furnished pursuant to the Exchange Act as soon as reasonably practicable after we electronically file such material with, or furnish it to, the SEC. We also put on our websites the charters for our Board of Directors’ Audit Committee, Compensation Committee, and Nominating and Corporate Governance Committee, as well as our Code of Business Conduct, our Corporate Governance Guidelines and Code of Ethics governing our chief executive and senior financial officers and other related materials. The information on our websites is not part of this annual report.
Our Investor Relations Department can be contacted at RH, 15 Koch Road, Corte Madera, CA 94925, Attention: Investor Relations; telephone: 415-945-3500; e-mail: investorrelations@rh.com.
8
Certain factors may have a material adverse effect on our business, financial condition, and results of operations. You should consider carefully the risks and uncertainties described below, in addition to other information contained in this Annual Report on Form 10-K, including our consolidated financial statements and related notes. If any of the following risks actually occurs, our business, financial condition, results of operations, and future prospects could be materially and adversely affected. In that event, the trading price of our common stock could decline, and you could lose part or all of your investment. The risks and uncertainties described below are not the only ones we face. Additional risks and uncertainties that we are unaware of, or that we currently believe are not material, may also become important factors that adversely affect our business.
Risks Related to Our Business
We have experienced significant fluctuations in the growth rate of our business during the last several years, and high levels of growth may not be achieved in future periods and may not generate a corresponding improvement in our results of operations.
We have experienced significant fluctuations in the growth rate of our business during the last several years. We may continue to experience wide fluctuations in quarter-to-quarter performance, not only because the rate of sales growth in some quarters may be slower than in prior periods but also because we may experience some quarters that have growth rates that are higher than prior periods. We are currently engaged in a number of initiatives to support the growth and transformation of our business, including investments to elevate the customer experience, which includes architecting a new fully integrated back-end operating platform, inclusive of the supply chain network, the home delivery experience as well as a new metric-driven quality system and company-wide decision data, the transition from a promotional to a membership model, and a more aggressive approach to rationalizing our SKU count and optimizing inventory including through selling slower moving, discontinued and other inventory through markdowns and our outlet channel. While we anticipate that these initiatives will support the growth of our business, costs and timing issues associated with pursuing these initiatives can negatively affect our gross margins in the short term and may amplify fluctuations in our growth rate from quarter to quarter depending on the timing and extent of our realization of the costs and benefits of such initiatives.
There can be no assurance that these efforts will be successful or that we will not encounter other operational difficulties that may have a material negative impact on growth and profitability. In addition, these initiatives may have near-term material negative impacts on growth and profitability as we incur costs or pursue strategies that may not contribute to our profits and margins until future periods, if at all. For example, in fiscal 2017, net revenues increased 14%, of which 2.9 points of growth was related to higher outlet and warehouse sales stemming from our accelerated inventory optimization efforts. While our higher outlet revenues and inventory optimization efforts had a positive impact on revenues and working capital, they had a negative impact on margins and earnings.
Some factors affecting our business, including macroeconomic conditions and policies and changes in legislation, are not within our control. In prior periods, our results of operations have been adversely affected by weakness in the overall economic environment such as periods of economic recession as well as slowdowns in the housing market. Our business performance is also linked to the overall strength of luxury consumer spending in markets in which we operate. Economic conditions affecting selected markets in which we operate can have an impact on the strength of our business in those local markets. As an example, during periods in which the price for oil declined rapidly, we experienced a slowing in our business in some regions where the economy is linked to energy exploration and production, including Texas and Canada.
In addition, our rates of revenue growth and comparable brand revenue growth have sharply fluctuated from quarter to quarter over the last three years and we expect volatility in the rates of our growth to continue in future quarterly periods. Unique factors in any given quarter may affect period-to-period comparisons in our revenue and comparable brand revenue growth, including;
|
|
• |
the overall economic and general retail sales environment, including the effects of uncertainty or stock market volatility on consumer spending; |
|
|
• |
consumer preferences and demand; |
|
|
• |
the number, size and location of stores we open, close, remodel or expand in any period; |
|
|
• |
changes in Source Book circulation, and the number of pages in our Source Books and timing of mailing; |
|
|
• |
our ability to efficiently source and distribute products; |
|
|
• |
changes in our product offerings and the introduction, and timing thereof, of introduction of new products and new product categories; |
|
|
• |
promotional events; |
9
|
|
• |
the timing of various holidays, including holidays with potentially heavy retail impact; and |
|
|
• |
the success of our marketing programs. |
Due to these factors, our results for any quarter are not necessarily indicative of the results that we may achieve for a full fiscal year. Our results of operations may also vary relative to corresponding periods in prior years. We may take certain pricing, merchandising or marketing actions that could have a disproportionate effect on our business, financial condition and results of operations in a particular quarter or selling season, and as a result we believe that period-to-period comparisons of our results of operations are not necessarily meaningful and cannot be relied upon as indicators of future performance.
Other future developments in our business could also result in material changes in our operating costs, including increased merchandise inventory costs and costs for paper and postage associated with the mailing and shipping of Source Books and products. We cannot assure you that we will succeed in offsetting any such expenses with increased efficiency or that cost increases associated with our business will not have an adverse effect on our financial results.
We are undertaking a large number of business initiatives at the same time, including exploring opportunities to expand into new categories and complementary businesses. If these initiatives are not successful, they may have a negative impact on our results of operations.
We are undertaking a large number of new business initiatives at the same time in order to support our future growth. For example, we have developed and continue to refine and enhance our Gallery format, which involves larger store square footage. We also continue to add new product categories and to expand product assortments. For example, in fiscal 2015 we launched our new RH Modern and RH Teen categories. We are currently contemplating other new product lines and extensions. We introduced RH Hospitality in fiscal 2015 at RH Chicago, The Gallery at the Three Arts Club. Based on the success of our hospitality offering, we have integrated RH Hospitality into a number of our new Galleries under development incorporate an integrated RH Hospitality offering including restaurants, wine vaults, and pantries. We continue to refine and develop the RH Hospitality model as we seek to optimize this part of our business and its integration with the operation of our Gallery locations. The RH Hospitality business is different from our traditional home furnishings operations and involved evolving strategies that are untested and unproven and may expose us to operational risks. There can be no assurance that we will successfully scale RH Hospitality, that we will optimally balance the resources and square footage allocated to our hospitality offerings versus our product offerings at our Galleries, or that our hospitality offerings will be attractive to consumers in our market.
We have also embarked on an initiative to expand our product sales to international markets and are currently exploring opportunities for Design Galleries in several locations outside the United States, including the United Kingdom and Europe. International expansion would expose us to new risks, including, but not limited to, risks related to currency fluctuation, supply chain and product sourcing, international economic or political events including but not limited to the U.K.’s impending withdrawal from the European Union, commonly referred to as “Brexit,” that may negatively impact the luxury market, and new regulatory regimes applicable to our products, Galleries and employees. We may be unsuccessful in adapting our operations to address such risks. We also may be unsuccessful in accurately selecting which international markets would support demand for our products or sizing our Gallery openings to such markets. If we are not successful in managing the large number of new initiatives that are underway, we might experience an adverse impact on our financial condition and results of operations.
Furthermore, we can provide no assurances that customers will respond favorably to our new product offerings, Galleries or complementary businesses or that we will successfully execute on such business initiatives. Such new business opportunities may not achieve market acceptance or may only achieve market acceptance in limited geographic areas or at certain Design Galleries. In addition, developing and testing new and multiple business opportunities and strategies often requires knowledge in areas of expertise that may be new to our organization and may require significant time of our management and resources. For example, RH Hospitality extended our business into an area where we have had limited historical operating and management experience and where low margins and high customer expectations can put pressure on results and performance. Expanding our business internationally will also require that we develop management expertise in new markets and regulatory regimes, and an inability to adapt our business quickly and efficiently to support our international expansion could materially adversely affect our financial condition and results of operations. We can provide no assurances that we will be successful in expanding our operations into any new businesses and product lines.
Any new businesses we enter may also expose us to additional laws, regulations and risks, including the risk that we may incur ongoing operating expenses in such businesses in excess of revenues, which could harm our financial condition and results of operations. The financial profile of any such new businesses may be different than our current financial profile, which could affect our financial performance and the market price for our common stock. For example, RH Hospitality may expose us to new risks related to consumer litigation and longer lease terms.
10
We often have in the past, and may in the future, incur significant costs for any new initiative before we realize any corresponding revenue with respect to such initiative. In addition, we may incur costs as we revise, restructure or discontinue existing product categories or business offerings in favor of pursuing new initiatives or retail concepts. For example, as we continue to open larger format Design Galleries in select major metropolitan markets, we expect to close a number of legacy Galleries and replace them with our Design Gallery format. The introduction of an integrated hospitality experience, including roll out of an integrated food and beverage experience at a new Gallery location often requires significant investments by us before the location is open to customers and able to generate revenues, and we anticipate that a number of Galleries to be opened during the next several years will continue to require this form of upfront investment before they generate revenue from the food and beverage offerings. In addition, during the fourth quarter of fiscal 2016, we initiated and executed a plan to integrate the RH Contemporary Art (“RHCA”) product line into the broader RH platform and we no longer operate RHCA as a separate division, and as a result we incurred restructuring related costs. To the extent that these new business opportunities do not generate sufficient revenue to recoup the cost of developing and operating such new concepts, our results of operations could be materially adversely affected.
In addition, we are continuing a number of new initiatives to improve the operations of our business, including ongoing refinements to our management structure and organizational design. Some of the improvements we are pursuing include changing the ways we source and deliver our products to our customers, as well as streamlining and realigning the management structure in our home office operations. We have also focused on elevating the customer experience, which includes improving our distribution and delivery of products to our customers and architecting a new fully integrated back-end operating platform, inclusive of the supply chain network, the home delivery experience as well as a new metric-driven quality system and company-wide decision data. We have focused on rationalizing our SKU count and optimizing inventory, which includes selling slower moving, discontinued and other inventory through markdowns and our outlet channel, as well as enhancing and optimizing our product sourcing capabilities and adding new management information systems. We also transitioned from a promotional to a membership model, in the early part of fiscal 2016, by introducing the RH Members Program, which provides a range of benefits to our customers in return for payment of an annual membership fee. We introduced the RH Members Program as an alternative to prior practices involving numerous event-driven promotional programs. Although we are extremely satisfied with the results of the RH Members Program to date, this program is still new to our business, and there can be no certainty as to exactly how our customers may react to this program over time or how the RH Members Program will affect our financial results from quarter to quarter.
Given the large number of organizational initiatives we are pursuing, as well as the complexity and untested nature of many of these efforts, there can be no certainty that we will be successful in executing on these initiatives including changes to our organizational design and management structure. We may not experience the operational or financial benefits we expect these improvements to generate and we may face unanticipated costs related to pursuing these initiatives such as personnel turnover, management distraction, or compliance and quality control risks, any of which could have a material adverse effect on our financial condition or results of operations.
All of the foregoing risks may be compounded due to various factors including any economic downturn. If we fail to achieve the intended results of our current business initiatives, or if the implementation of these initiatives is delayed or abandoned, diverts management’s attention or resources from other aspects of our business or costs more than anticipated (including, as a result of personnel turnover or compliance and control risks), we may experience inadequate return on investment for some or all such business initiatives, which could have a material adverse effect on our financial condition or results of operations.
Changes in consumer spending and factors that influence spending of the specific categories of consumers that purchase from us, including the health of the high-end housing market, may significantly impact our revenue and results of operations.
We target consumers of high-end home furnishings as customers for our products. As a result, we believe that our sales are sensitive to a number of factors that influence consumer spending generally, but are particularly affected by the financial health of the higher end customer and demand levels from that customer demographic. In addition, not all macroeconomic factors are highly correlated in their impact on lower end housing versus the higher end customer. Demand for lower priced homes and first time home buying may be influenced by factors such as employment levels, interest rates, demographics of new household formation and the affordability of homes for the first time home buyer. The higher end of the housing market may be disproportionately influenced by other factors including the number of foreign buyers in higher end real estate markets in the U.S., the number of second and third homes being sold, stock market prices and volatility, decreased availability of income tax deductions for mortgage interest and state income and property taxes, and the perceived prospect for capital appreciation in higher end real estate. In recent periods the stock market has experienced significant volatility as well as periods of significant decline, and rising house prices and interest rates have dampened growth in the U.S. housing market and may depress consumer optimism about the U.S. housing market and home buying in the higher end of the housing market. There can be no assurance that some of the other macroeconomic factors described above will not adversely affect the higher end consumer that we believe makes up the bulk of our customer demand.
11
We believe that a number of these factors have in the past had, and may in the future have, an adverse impact on the high-end retail home furnishings sector and affect our business and results. These factors may make it difficult for us to accurately predict our operating and financial results for future periods and some of these factors could contribute to a material adverse effect on our business and results of operations.
If we are unable to maintain and enhance our brand or market our product offerings, we may be unable to attract a sufficient number of customers or sell sufficient quantities of our products.
Our business depends in part on a strong brand image, and we continue to invest in the development of our brand and the marketing of our business. We believe that the brand image we have developed, and the lifestyle image associated with our brand, have contributed significantly to the success of our business to date. We also believe that maintaining and enhancing our brand is integral to the future of our business and to the implementation of our strategies for expanding our business. This will require us to continue to make investments in areas such as marketing and advertising, as well as the day-to-day investments required for store operations, Source Book mailings, website operations and employee training. Our brand image may be diminished if new products, services or other businesses fail to maintain or enhance our distinctive brand image.
Additionally, our reputation could be jeopardized if we fail to maintain high standards for merchandise and service quality. With the growth in importance and the impact of social media over the last few years, any negative publicity from product defects, recalls or failures in service may be magnified and reach a large portion of our customer base in a very short period of time, which could harm the value of our brand and, consequently, our financial performance could suffer. We may also suffer reputational harm if we fail to maintain high ethical, social and environmental standards for all of our operations and activities, if we fail to comply with local laws and regulations or if we experience other negative events that affect our image or reputation. Any failure to maintain a strong brand image could have an adverse effect on our sales and results of operations.
Our failure to successfully manage the strategy and costs of our Source Book mailings or other promotional programs and costs could have a negative impact on our business.
Source Book mailings are an important component of our business. We continue to adjust and refine our Source Book mailing strategy and we expect to do so in the future. For example, in fiscal 2014 and fiscal 2015, we reduced the number of Source Books circulated, and in fiscal 2016, we decided to move the mailing of our annual Source Books to the Fall, whereas our Source Books were circulated in the Spring in the prior years. We intend to continue adjusting our Source Book circulation strategy based on a variety of factors, including the success of the various changes that we adopt. We can provide no assurances as to the success of any Source Book strategy we pursue. Increased expenditures on our catalog strategy may result in the production of too many Source Books, which could negatively affect our operating margins. Reducing expenditures on our catalog strategy, however, could overly restrict catalog circulation and have a negative effect on our revenues. Our efforts to optimize our Source Books and strategies for use of the Source Books to market our business may encounter difficulties. There can be no assurance that we will be successful as we make changes to our Source Book strategy including with respect to the cadence and timing of mailings, the format of the Source Books, the team we staff for optimizing our Source Book format and mailings, and the use of the Source Books as a marketing and promotional tool including with respect to prospecting for new customers. Additionally, due to the size of our Source Books we have in the past received negative publicity from environmental groups. If we fail to adequately adjust our catalog strategy to meet our goals, or if our catalog strategy is unsuccessful, our results of operations could be negatively impacted.
We also rely on customary discounts from the basic shipping rate structure that are available for our catalog mailings, which could be changed or discontinued at any time, and we are subject to fluctuations in the market price for paper, which has historically fluctuated significantly and may continue to fluctuate in the future. Future increases in shipping rates, paper costs or printing costs would have a negative impact on our results of operations to the extent that we are unable to offset such increases through increased sales or by raising prices, by implementing more efficient printing, mailing, delivery and order fulfillment systems, or by using alternative direct-mail formats.
We have historically experienced fluctuations in customer response to our Source Books. Customer response depends substantially on product assortment, product availability and creative presentation, the selection of customers to whom the catalogs are mailed, changes in mailing strategies, page size, page count, frequency and timing of delivery of catalogs, as well as the general retail sales environment and current domestic and global economic conditions. The failure to effectively produce or distribute our catalogs could affect the timing of catalog delivery. The timing of catalog delivery has in the past been, and in the future can be, affected by shipping service delays. Any delays in the timing of catalog delivery could cause customers to forgo or defer purchases. If the performance of our catalogs declines, if we misjudge the correlation between our catalog circulation and net revenues, or if our catalog circulation optimization strategy is not successful, our results of operations could be negatively impacted.
12
Competition in the home furnishings sector of the retail market may adversely affect our future financial performance.
The home furnishings sector within the retail market is highly competitive. We compete with the interior design trade and specialty stores, as well as antique dealers and other merchants that provide unique items and custom-designed product offerings at higher price points. We also compete with national and regional home furnishing retailers and department stores. In addition, we compete with mail order catalogs and online retailers focused on home furnishings.
We compete generally with these other retailers for customers, suitable retail locations, vendors, qualified employees and management personnel. As we have traditionally been a leader in the home furnishings sector, some of our competitors have also attempted to imitate our product offerings and business initiatives from time to time in the past. In addition, many of our competitors have significantly greater financial, marketing and other resources than we do and therefore may be able to devote greater resources to the marketing and sale of their products, generate greater national brand recognition or adopt more aggressive pricing policies than we can. Such competitors may also be able to adapt to changes in customer preferences more quickly than we can due to their greater financial or marketing resources, through new product launches or by adapting their business models and operations to new customer trends, which may in turn change how our customers acquire products or view our business and brand. Further, increased catalog mailings by our competitors may adversely affect response rates to our own Source Book mailings. There can be no assurance that such competitors will not be more successful than us, based on imitation or otherwise, or that we will be able to continue to maintain a leadership position in style and innovation in the future.
Increased competition also has resulted, and may in the future result, in potential or actual litigation between us and our competitors related to a variety of activities, including hiring practices. If we are not successful in such litigation, our business could be harmed.
If we fail to successfully anticipate consumer preferences and demand our results of operations may be adversely affected.
We are vulnerable to customer preferences and demand. Our success depends in large part on our ability to originate and define home product trends, as well as to anticipate, gauge and react to changing consumer demands in a timely manner. Our products must appeal to a range of consumers whose preferences cannot always be predicted with certainty. We cannot assure you that we will be able to continue to develop products that customers positively respond to or that we will successfully meet consumer demands in the future. Any failure on our part to anticipate, identify or respond effectively to consumer preferences and demand could adversely affect sales of our products, which could have a material adverse effect on our financial condition and results of operations.
If we fail to successfully and timely deliver merchandise to our customers and manage our supply chain commensurate with demand, our results of operations may be adversely affected.
We must successfully manage our supply chain and vendors in order to produce sufficient quantities of products that our customers wish to purchase in a timely manner. We must manage our supply chain and inventory levels, including predicting the appropriate levels and type of inventory to stock within each of our distribution centers, such that our “in stock” position in merchandise correlate well to consumer demand and expected delivery times. Because much of our merchandise requires that we provide vendors with significant ordering lead times, frequently before market factors are known, we may not be able to source sufficient inventory to meet demand if our products prove more popular than anticipated. In addition, our current initiatives to streamline and optimize our inventory levels may not be successful and implementing such initiatives may complicate our efforts to manage our supply chain. To the extent our business initiatives result in new product lines, new product or service offerings or expansion into new markets in the U.S. or abroad, we may need to establish new vendor relationships or new supply chain operations, which may expose us to new counterparty, regulatory, market or other risks and which may not be successful. From time to time, we have experienced periods in which some of our vendors were not able to meet customer demand levels for certain products resulting in significant back orders for goods, higher rates of cancellation on orders in process and, in some instances, the loss of customer sales when orders could not be completed in a timely manner. In addition, vulnerabilities in the information systems of our vendors could make our vendors the targets of cybersecurity breaches or cyber fraud, which could result in disruptions in our supply chain and product sourcing. Further, the seasonal nature of some of our products requires us to carry a significant amount of inventory prior to certain selling seasons. If we are unable to accurately predict and track demand, we may be required to mark down the price of certain products in order to sell excess inventory or we may be required to sell such inventory through our outlet stores or warehouse sales. For these reasons, our results of operations in any given quarterly period may be adversely affected. We expect these factors to continue from time to time as we add new product assortments and new merchandise categories into our business.
13
We are subject to risks associated with our dependence on foreign manufacturing and imports for our merchandise.
Based on total dollar volume of purchases, in fiscal 2018 we sourced approximately 85% of our merchandise from outside the United States, including 73% from Asia, with approximately 41% of our products sourced from China. In addition, some of the merchandise we purchase from vendors in the United States also depends, in whole or in part, on vendors located outside the United States. As a result, our business highly depends on global trade, as well as any trade and or other factors that impact the specific countries where our vendors’ production facilities are located. Our future success will depend in large part upon our ability to maintain our existing foreign vendor relationships and to develop new ones based on the requirements of our business and any changes in trade dynamics that might dictate changes in the locations for sourcing of products. In addition, we face risks related to the ability of our vendors to scale their operations whether in connection with new products we introduce or new production locations that may be introduced, which in some cases would require substantial ongoing investments to support additional capacity. In addition, we have previously encountered difficulties in the ability of our vendors to scale production commensurate with demand from our customers. While we rely on long-term relationships with many of our vendors, we have no long-term contracts with them and generally transact business with them on an order-by-order basis.
Many of our imported products are subject to existing duties, tariffs, anti-dumping duties, quotas and other similar trade restrictions that may limit the quantity or affect the price of some types of goods that we import into the United States. In addition, substantial regulatory uncertainty exists regarding international trade relations and trade policy, both in the United States and abroad. An introduction of new duties, tariffs, quotas or other similar trade restrictions, or increases in existing duties or tariff rates, on products imported into the United States, whether actual, pending or threatened, may have a negative impact on our results of operations. Additionally, such uncertainties, even if not directly applicable to our imported products, may have a negative influence on the domestic and international economy generally and indirectly reduce market demand for our products. For example, a significant subset of our furniture and lighting sourced from China has been affected by the tariffs on such products. While we have been working with our vendor partners on mitigation strategies to seek to address the impact of such tariffs on our product pricing and costs, such efforts may not be fully sufficient to remediate the impact of the 10 per cent ad valorem duty on a subset of products imported from China, which become effective as of September 24, 2018, or any other pending or future increases in tariffs, including the recently proposed increase in the 10 per cent ad valorem duty to the rate of 25 per cent. In particular, we may not be able to receive adequate pricing concessions from our vendors and pricing increases that we seek to pass through to our customers may not be successful in achieving our objectives. Our sales may fall in response to price increases and our vendors may not be able to support the level of pricing concessions that we seek and our mitigation strategy and arrangements may not have the intended effect on our business. In addition, we have moved some of our merchandise sourcing away from China which may or may not achieve the intended benefits. In the event that any tariffs applicable to our business become applicable on a longer term basis, there can be no assurance that our efforts to mitigate the impact of such longer term tariffs will be successful.
There can be no assurance that we will not experience disruption in our business related to tariffs or other changes in trade practices and applicable rules. Tariffs and other similar trade actions are inherently unpredictable and can change quickly based on political or economic pressures or policy changes. Any changes to tariffs or other rules and practices related to cross border trade, including the possible implementation of additional tariffs, could materially increase our cost of goods sold with respect to merchandise that we purchase from vendors who manufacture products in China or other countries outside the United States, which could in turn require us to increase our prices and, in the event consumer demand declines as a result, negatively impact our financial performance. While we may seek to adopt mitigation measures and changes to our business practices to seek to counteract the effect of such tariffs on our business and results of operations, due to multiple factors that can occur in the context of trade disputes and the inherent unpredictability of how customers and market participants may respond, any mitigation measures we adopt may be not achieve their intended purpose. Certain of our competitors may be better positioned than us to withstand or react to these kinds of changes including border taxes, tariffs or other restrictions on global trade and as a result we may lose market share to such competitors. In addition, to the extent that our competitors, our vendors or companies in other industries that manufacture products in China respond to the tariffs imposed to date or the possibility of future tariffs by shifting production to other countries in Asia or to other regions, the costs of production in such countries may increase, which may increase our costs or otherwise have an adverse impact on our product supply chain. Similarly, to the extent that we or our vendors respond to the tariffs imposed to date or the possibility of future tariffs by shifting merchandise purchases or production to other countries in Asia or to other regions, we may face delays or costs associated with developing new vendor relationships and our vendors may face delays or costs associated with bringing online new manufacturing facilities, which may increase the cost of our products or cause delays in the shipment of our merchandise that result in the cancellation of orders by our customers. An interruption or delay in supply from our foreign sources, or the imposition of additional duties, taxes or other charges on these imports, could have a material adverse effect on our business, financial condition and results of operations unless and until alternative supply arrangements are secured. Due to broad uncertainty regarding the timing, content and extent of any regulatory changes in the U.S. or abroad, we cannot predict the impact, if any, that these changes could have to our business, financial condition and results of operations.
14
Our dependence on foreign imports also makes us vulnerable to risks associated with products manufactured abroad, including, among other things, risks of damage, destruction or confiscation of products while in transit to our distribution centers located in the United States, product quality control charges on or assessment of additional import duties, tariffs, anti-dumping duties and quotas, loss of “most favored nation” trading status by the United States in relation to a particular foreign country, work stoppages, including without limitation as a result of events such as longshoremen strikes, transportation and other delays in shipments, including without limitation as a result of heightened security screening and inspection processes or other port-of-entry limitations or restrictions in the United States, freight cost increases, political unrest, economic uncertainties, including inflation, foreign government regulations, trade restrictions, increased labor costs and other similar factors that might affect the operations of our vendors in specific countries such as China.
In addition, there is a risk of compliance violations by our vendors, which could lead to adverse consequences related to the failure of our vendors to adhere to applicable manufacturing requirements or other applicable rules. Any such noncompliance could have an adverse impact on our business and may result in product recalls, regulatory action, product liabilities, investigation by governmental agencies and other similar adverse consequences. Any failure by our vendors outside the United States to adhere to applicable legal requirements or our global compliance standards such as fair labor standards, prohibitions on child labor and other product safety or manufacturing safety standards could give rise to a range of adverse consequences including the disruption of our supply chain as well as potential liability to us and harm our reputation and brand and could subject us to other adverse consequences including boycotts by our consumer or special interest groups including activists, any of which actions could negatively affect our business and results of operations.
Our growth strategy and performance depend on our ability to purchase quality merchandise in sufficient quantities at competitive prices, including products that are produced by artisans and specialty vendors. Any disruptions we experience in our ability to obtain quality products in a timely fashion or in the quantities required could have a material adverse effect on our business.
We purchase substantially all of our merchandise from a number of third party vendors. Many such vendors are the sole sources for particular products, and we generally transact business with such vendors on an order-by-order basis without any long-term or other contractual assurances of continued supply, pricing or access to new products with our vendors. Therefore, we may be dependent on particular vendors that produce popular items, and any vendor could discontinue selling to us at any time. In addition, the expansion of our business into new U.S. or international markets or new product categories could put pressure on our ability to source sufficient quantities of our products from such vendors. In the event that one or more of our vendors is unable or unwilling to meet the quantity or quality of our product requirements, we may not be able to develop relationships with new vendors in a manner that is sufficient to supply the shortfall. We also may be required to develop such new vendor relationships in response to changes in our supply chain, for example in response to new tariffs or competitive pressures. Even if we do identify such new vendors, we may experience product shortages and customer backorders as we transition our product requirements to incorporate alternative suppliers. Our relationship with any new vendor would be subject to the same or similar risks as those of our existing suppliers.
Furthermore, our growth strategy includes expanding our product assortment, and our performance depends on our ability to purchase our merchandise in sufficient quantities at competitive prices. However, many of our key products are produced by artisans, specialty vendors and other vendors that are small, undercapitalized or that may have limited production capacity, and we have from time to time in prior periods experienced supply constraints that have affected our ability to supply high demand items or new products due to such capacity and other limits in our vendor base.
A number of our vendors, particularly our artisan vendors, may have limited financial or other resources and operating histories and may receive various forms of credit from us, including with respect to payment terms or other arrangements. In some cases, we have advanced payments to vendors in order to assist a vendor in funding additional merchandise production to meet our orders. We may advance a portion of the payments to be made to some vendors under our purchase orders prior to the delivery of the ordered products. These advance payments are normally unsecured. Vendors may become insolvent and their failure to repay our advances, and any failure to deliver products to us, could have a material adverse impact on our results of operations. There can be no assurance that the capacity of any particular vendor will continue to be able to meet our supply requirements in the future, as our vendors may be susceptible to production difficulties or other factors that negatively affect the quantity or quality of their production during future periods. A disruption in the ability of our significant vendors to access liquidity could also cause serious disruptions or an overall deterioration of their businesses, which could lead to a significant reduction in their ability to manufacture or ship products to us. Any difficulties that we experience in our ability to obtain products in sufficient quality and quantity from our vendors could have a material adverse effect on our business.
15
Our vendors may sell similar or identical products to our competitors or on their own, which could harm our business.
Because the arrangements with our vendors are generally not exclusive, many of our vendors might be able to sell similar or identical products to our competitors. Our competitors may enter into arrangements with suppliers that could impair our ability to sell those suppliers’ products, including by requiring suppliers to enter into exclusive arrangements, which could limit our ability to enter into arrangements with such suppliers or otherwise access their products. Such competitors may also purchase products in significantly greater volume that we do, which may enable them to sell the products at reduced cost or flood the market with similar products.
Our vendors could also initiate or expand sales of their products through vendor-owned stores or through the Internet to the retail market and therefore directly compete with us or sell their products through outlet centers or discount stores, increasing the competitive pricing pressure we face.
Any of the above factors could negatively affect our business and results of operations.
Defective merchandise purchased from our vendors could damage our reputation and brand image and harm our business, and we may not have adequate remedies against our vendors for defective merchandise.
We have in recent periods, and may in the future, recall products from the market due to quality or other issues. Despite our ongoing efforts to improve customers’ satisfaction with their experience at RH, we may fail to maintain the necessary level of quality for some of our products in order to satisfy our customers. For example, our vendors may not be able to continuously adhere to our quality control standards, and we might not identify a quality deficiency before merchandise ships to our stores or customers. Our failure to supply high quality merchandise in a timely and effective manner to our customers, our announcement of additional product recalls, or any perception that we are not adequately maintaining our sourcing and quality control processes in order to anticipate product quality issues could damage our reputation and brand image, and could lead to an increase in product returns or exchanges or customer litigation against us and a corresponding increase in our routine and non-routine litigation costs. Further, any merchandise that does not meet our quality standards or applicable government requirements could trigger high rates of customer complaints or returns, become subject to a product recall and/or attract negative publicity, which could in turn damage our reputation and brand image, result in consumer litigation (including class-action lawsuits), and harm our business. With the growth in importance and the impact of social media over the last few years, the magnitude of such harm to our business, reputation and brand image may be significantly amplified. The number of business initiatives we are undertaking to enhance the quality of our customers’ experience and to improve our organizational design, which are expected to include increasingly significant operational and other changes in the near term, may complicate our supply chain and quality control management process, and any inability to invest sufficient resources in quality control and compliance processes or significant turnover in the personnel dedicated to such function may result in quality control issues or product recalls.
Even if we detect that merchandise is defective before such merchandise is shipped to our customers, we may not be able to return such products to the vendor, obtain a refund of our purchase price from the vendor or obtain other indemnification from the vendor. The limited capacities of certain of our vendors may constrain the ability of such vendors to replace any defective merchandise in a timely manner. Similarly, the limited capitalization and liquidity of certain of our vendors and their lack of insurance coverage for product recall claims may result in such vendors being unable to refund our purchase price or pay applicable penalties or damages associated with any such defects or resulting product recalls.
Our results may be adversely affected by fluctuations in raw materials, energy costs and currency exchange rates.
Increases in the prices of the components and raw materials used in our products could negatively affect the sales of our merchandise and our product margins. Alternatively, the strength of the U.S. dollar may negatively impact the ability of some of our customers to purchase our goods. We believe some portion of our business depends on non-U.S. consumers, including sales in our stores in Canada and Waterworks showrooms in the U.K., as well as sales in some of our U.S.-based stores which have a high number of visitors from other countries who purchase goods from us while visiting the United States. Declines in the purchasing power of the British pound sterling and volatility in the British pound sterling exchange rate as a result of Brexit, for example, may dampen demand for our products in the U.K. and may delay or negatively affect the success of our business initiative to expand internationally.
Changes in prices for raw materials and fluctuations in exchange rates are dependent on a number of factors beyond our control, including macroeconomic factors that may affect commodity prices (including prices for oil, lumber and cotton); changes in supply and demand; general economic conditions; significant political events; labor costs; competition; import duties, tariffs, anti-dumping duties and other similar costs; currency exchange rates and government regulation. In addition, energy costs have fluctuated dramatically in the past and, in recent periods, energy prices have been declining and could experience significant volatility in the near term. Depending on the nature of changes in these different factors that affect our business, we may experience an adverse impact on our business for different reasons including increased costs of operation or lower demand for our products. We may experience slower demand from customers in markets that depend upon energy prices for a portion of their economic activity.
16
Changes in the value of the U.S. dollar relative to foreign currencies, including the Chinese Yuan, may increase our vendors’ cost of business and ultimately our cost of goods sold and our selling, general and administrative costs. If we are unable to pass such cost increases on to our customers or the higher cost of the products results in decreased demand for our products, our results of operations could be harmed.
We are subject to risks associated with occupying substantial amounts of space, including future increases in occupancy costs. We are pursuing various alternatives to traditional leasing of our Gallery locations that may subject us to a range of risks related to real estate development including risks related to construction and development of locations, risks related to the financing of commercial real estate and the market for commercial real estate.
We lease nearly all of our retail store locations and we also lease our outlet stores, our corporate headquarters and other storage and office space, and our distribution and home delivery facilities. The initial lease term of our retail stores generally ranges from ten to fifteen years, and certain leases contain renewal options for anywhere from ten to twenty-five years. The initial lease term for one of our Design Galleries is forty-one years, and contains renewal options for five years. Most leases for our retail stores provide for a minimum rent, typically including escalating rent amounts, plus a percentage rent based upon sales after certain minimum thresholds are achieved, as well as common area maintenance charges, real property insurance and real estate taxes.
We are currently pursuing several other models for the transformation of our real estate beyond a traditional leasing approach including a real estate development model, a joint venture model and a capital light model. While these alternative models are designed to achieve superior financial returns to traditional real estate lease structures for a retail business, some of these new ways of operation will expose us to a range of different risks. Various aspects of our recently developed multi-tier real estate strategy may expose us to new forms of risk versus our traditional leasing model. Our new strategies include (1) our real estate development model where we expect either to do a sale-leaseback transaction or to pre-sell the property and structure the transaction such that the capital to build the project is advanced by the buyer during construction; (2) our hybrid or joint venture structure where we are working on joint venture projects in which we share the upside of development with the developer/landlord; and (3) our “capital light” leasing deals, where as much as 65% to 100% of the capital requirement would be funded by the landlord, versus 35% to 50% previously.
These new approaches might cause us to pursue complicated real estate transactions and may require additional capital investment and could present different risks related to the ownership and developments of real estate compared to those risks associated with a traditional store lease with a landlord, including greater financial exposure if our plans for the relevant real estate are not as successful as we originally anticipate or if the value of the real estate we acquire subsequently decreases. Pursuing multiple different paths for addressing our real estate needs may create various risks including increased complexity and risks related to the time and costs of real estate development as well as the need for additional capital and risks related to resale of real estate projects. These risks could distract management focus, strain our operational resources and personnel, or expose us to new regulatory or tax regimes in which we must develop expertise.
Several of our new real estate development strategies expose us to additional risks related to operating in commercial real estate from a development perspective. Such risks include the cost and financing of the acquisition of real estate interests, market risks related to real estate prices, the time and costs related to developing real estate projects including construction and development risks and other factors that affect the commercial real estate industry more generally. We have not historically operated directly in all phases of real estate development including managing all aspects of construction of large scale real estate projects. Although our strategy in assuming greater risk and responsibility for real estate development in certain projects is to achieve greater financial returns and a higher overall return on investment if our efforts our successful, we could face increased downside risks if we encounter difficulties in implementing these strategies such as cost overruns or delays in construction.
If we decide to close an existing or future store, we may nonetheless have continuing obligations with respect to that property pursuant to the applicable lease or ownership arrangements, including, among other things, paying the base rent for the balance of the lease term. Our ability to re-negotiate favorable terms on an expiring lease, to arrange for the sale of an owned property or to negotiate favorable terms for a suitable alternate location could depend on conditions in the real estate market, competition for desirable properties, our relationships with current and prospective landlords and other factors that are not within our control. Our inability to enter into new leases or renew existing leases on terms acceptable to us or be released from our obligations under leases or other obligations for stores that we close could materially adversely affect our business and results of operations.
17
A number of factors that affect our ability to successfully open new stores within the time frames we initially target or optimize our store footprint are beyond our control, and these factors may harm our ability to execute our strategy to transform our real estate, which may negatively affect our results of operations.
We are focused on sizing our assortments and our stores to the potential of the market by adjusting the square footage and number of stores on a geographic market-by-market basis. We plan to optimize our real estate by continuing to open larger square footage Galleries in key markets and relocating or closing selected stores in these or adjacent markets. In addition, we have developed a new RH model Design Gallery that is designed to enable us to more quickly place our product assortment and retail experience into the market and will range in size from 33,000 leased selling square feet inclusive of our integrated hospitality experience to 29,000 leased selling square feet without. We are also developing a Gallery tailored to secondary markets, targeted to be 10,000 to 18,000 leased selling square feet, which we expect will require a substantially smaller net investment than our larger Design Galleries and to pay back our capital investment within two years in most instances. We also intend to continue to open indigenous Bespoke Galleries in the second home markets where the wealthy and affluent visit and vacation, which will be tailored to reflect the local culture and be sized to the potential of each market. When we address the introduction of new stores in a particular market or changes to, or closure of, existing stores, we must make a series of decisions regarding the size and location of new stores (or the existing stores slated to undergo changes or closure) and the impact on our other existing stores in the area or being without presence or “out of the market.”
Our ability to maximize the productivity of our retail store base, depends on many factors, including, among others, our ability to:
|
|
• |
identify suitable locations, the availability of which is largely outside of our control; |
|
|
• |
size the store locations to the market opportunity; |
|
|
• |
retain customers in a certain geographic market when we close stores in such market or an adjacent market; |
|
|
• |
negotiate acceptable new lease terms or lease renewals, modifications or terminations; |
|
|
• |
efficiently build and equip new stores or remodel existing locations; |
|
|
• |
source sufficient levels of inventory to meet the needs of changes in our store footprint in a timely manner; |
|
|
• |
successfully integrate changes in our store base into our existing operations and information technology systems; |
|
|
• |
obtain or maintain adequate capital resources on acceptable terms; |
|
|
• |
avoid construction or local permit delays, construction accidents and injuries and cost overruns in connection with the opening of new stores or the expansion or remodeling of existing stores; |
|
|
• |
maintain adequate distribution facilities, information systems and other operational systems to serve our new stores and remodeled stores; and |
|
|
• |
address competitive, merchandising, marketing, distribution and other challenges encountered in connection with expansion into new geographic areas and markets. |
We have experienced delays in opening some new stores within the time frames we initially targeted, and may experience such delays again in the future. We have also incurred higher levels of capital and other expenditures associated with the opening of some of our new Gallery locations. While we are investing in strategies to address these challenges in the future, we may not be successful in deploying such strategies or they may not have the effect that we anticipate. Any of the above challenges or other similar challenges could delay or prevent us from completing store openings or the additional remodeling of existing stores or hinder the operations of stores we open or remodel. If any of these challenges delays the opening of a store, our results of operations will be negatively affected as we will incur various costs during the delay without associated store revenue at such location and our overall return on investment and profit goals for some locations could be adversely affected. Unfavorable economic and business conditions and other events could also interfere with our plans to expand or modify store footprints. Changes in regulation or increases in building or construction costs including with respect to the cost of building materials could result in unanticipated increases in real estate development costs or delays in the completion of our real estate projects. Our failure to effectively address challenges such as those listed above could adversely affect our ability to successfully open new stores or change our store footprint in a timely and cost-effective manner and could have a material adverse effect on our business, results of operations and financial condition.
18
Reductions in the volume of mall and other in-store traffic or the closing of shopping malls as a result of changing demographic patterns could significantly reduce our sales.
Although many of the new Design Galleries that we have opened are being developed outside of the shopping mall setting, a significant portion of our existing footprint of legacy Galleries is currently located in shopping malls. Sales at stores located in malls are derived, in part, from the volume of traffic in those malls. These stores benefit from the ability of the malls to generate consumer traffic in the vicinity of our stores and the continuing popularity of the malls as shopping destinations and positive experiences.
However, in recent years there has been a shift in consumer preferences to purchasing certain products online rather than in stores. This shift, particularly when coupled with past unfavorable economic conditions in certain regions, has adversely affected mall traffic in some regions and has threatened the viability of certain commercial real estate firms that operate major shopping malls. A continuation of such trend could adversely impact the sales generated by our stores currently located in shopping malls.
If we are unable to successfully optimize and operate our distribution centers, furniture home delivery hubs and other aspects of our supply chain and customer delivery network, or if we are not able to fulfill orders and deliver our merchandise to our customers in an effective manner, our business and results of operations will be harmed.
Our business depends upon the successful operation of our distribution centers, furniture home delivery hubs and other aspects of our supply chain and customer delivery network, as well as upon our order management and fulfillment services and the re-stocking of certain inventories within our stores. The efficient flow of our merchandise requires that our facilities have adequate capacity to support our current level of operations and any anticipated increased levels that may follow from any growth of our business.
We are currently engaged in efforts to improve the quality of our customer experience, which includes making changes to the way in which we operate our distributions centers, furniture home delivery hubs and other aspects of our supply chain and customer delivery network. Additionally, we plan to invest significant time architecting a new fully integrated back-end operating platform, inclusive of the supply chain network, the home delivery experience as well as a new metric driven quality system and company-wide decision data. Some of these efforts may require us to make significant expenditures in periods in the near term, which may also have a negative effect on our results of operations if there is no associated increase in revenues or decrease in returns or if any such effect is less than anticipated. There can be no assurance however that any of these efforts will be successful or that we will not encounter additional difficulties in achieving higher levels of customer satisfaction.
We are also engaged in initiatives to rationalize our SKU count, and in order to realize the anticipated benefits of such initiatives, including through lower inventories and reduced working capital, we have focused on optimizing the use of our distribution centers, furniture home delivery hubs and outlets. For example, we have consolidated our distribution center network and we are in the process of opening new outlet and home delivery locations and reconfiguring our furniture home delivery hubs and outlets in order to streamline our operations. While we believe that optimizing and consolidating our distribution centers and other aspects of our supply chain and customer delivery network will allow us to more efficiently manage our inventory and optimize our uses of capital, in the short term such strategy may result in additional costs, including increased freight costs and lease early termination fees. Furthermore, in the past, during periods of significant customer growth and demand, we have found that our distribution centers often run at capacity. If we fail to accurately anticipate the future capacity requirements of our distribution centers, we may experience delays and difficulties in fulfilling orders and delivering merchandise to customers in a timely manner. Furthermore, we may be unable to remedy such issues quickly as opening additional distribution and home delivery facilities can face operational difficulties, such as disruptions in transitioning fulfillment orders to the new distribution facilities, competition for distribution facility space and problems associated with operating new facilities or reducing the size and changing functions of existing facilities. These difficulties can result in a negative experience for our customers. Any delays in fulfilling orders and delivering merchandise to customers, or related negative experience of our customers, could harm our results of operations.
We currently rely upon independent third-party transportation providers for the majority of our product shipments, which subjects us to certain risks.
We currently rely upon independent third-party transportation providers for product shipments from our vendors to our stores and to our customers outside of certain areas. Our utilization of third-party delivery services for shipments is subject to risks, including increases in fuel prices, which would increase our shipping costs, as well as strikes, work stoppages and inclement weather, which may impact shipping companies’ abilities to provide delivery services that adequately meet our shipping needs. For example, strikes or even threat of strikes involving longshoreman and clerical workers at ports in the past have completely shut down such ports for periods of time, impacting retail and other industries. If we change shipping companies, we could face logistical difficulties that could adversely affect deliveries and we would incur costs and expend resources in connection with such change. Moreover, we may not be able to obtain terms as favorable as those received from the third-party transportation providers we currently use, which in turn would increase our costs.
19
Our operations have significant liquidity and capital requirements and depend on the availability of adequate financing and sources of capital on reasonable terms. If we fail to use our financial resources effectively, or if we are unable to obtain sufficient capital when needed, it could have a significant negative effect on our ability to grow our business.
We have historically relied on the availability of some amount of debt financing to fund our operations. We have also incurred indebtedness to finance other strategic initiatives, including our share repurchase programs, such as (i) the aggregate $1 billion in share repurchase programs authorized by our Board of Directors, which program was fully completed during fiscal 2017, and (ii) the share repurchase program authorized by our Board of Directors in October 2018 in an aggregate amount of $700 million of which (x) $250.0 million in share repurchases were completed in fiscal 2018, and (y) the $700 million authorization amount was replenished by the Board of Directors in March, 2019. We completed debt financings in fiscal 2014, fiscal 2015 and fiscal 2018 through the issuance of three series of convertible senior notes for an aggregate principal amount of $985 million. As of February 2, 2019, we had $57.5 million in outstanding borrowings and $378.9 million of availability under our revolving line of credit, net of $13.6 million in outstanding letters of credit. Our revolving line of credit contains various restrictive covenants, including, among others, limitations on the ability to incur liens, make loans or other investments, incur additional debt, issue additional equity, merge or consolidate with or into another person, sell assets, pay dividends or make other distributions, or enter into transactions with affiliates. These restrictive covenants may limit our operational and financial flexibility, and we may face financial and contractual consequences to the extent we are not able to maintain our compliance with such covenants, which could have a materially adverse effect on our business, financial condition and results of operations.
While we believe that we currently have sufficient capital for the operation of our business in the near term, we may expend some significant portion of our capital on investments in our business, our real estate strategy, the purchase of our equity securities, our international expansion, the acquisition of new businesses and our significant number of concurrent initiatives. In addition, our capital needs may change in the future due to changes in our business or new opportunities that we choose to pursue. We have invested significant capital expenditures in remodeling and opening new Galleries, and these capital expenditures have increased in the past and may continue to increase in future periods as we open additional Design Galleries, which may require us to undertake upgrades to historical buildings or construction of new buildings. During fiscal 2018, we spent $136.7 million for capital expenditures. The exact level of our net capital expenditures in future fiscal years, including fiscal 2019, will depend both on the level of gross capital expenditures that we undertake in our business as well as the amount of any proceeds from the sale of assets including sales of real estate. We plan to continue pursuing our real estate strategy by opening Design Galleries in select major metropolitan markets, developing new RH model Design Galleries and Galleries tailored to secondary markets, and opening indigenous Bespoke Galleries in the second home markets where the wealthy and affluent visit and vacation, as well as pursuing category extensions of our brand and exploring new business areas. We have principally relied upon leases with landlords for most of our Gallery locations to date. We have begun to pursue a real estate development model strategy for some of our new Gallery developments in which we invest in ownership of real estate such as we did in the case of our current Gallery location in San Francisco where we own both the building and the land. The real estate development model may require us to pursue additional capital expenditures than a traditional leasing model, but we may be able to recoup substantial amounts of capital and may also achieve gains on our capital investments if we are successful with this model and are able to sell the real estate interests to a real estate investor in a sale leaseback transaction. As we develop new Galleries, as well as potentially other strategic initiatives in the future like our integrated hospitality experience, we may explore other models for our real estate, which could include longer lease terms or further purchases of, or joint ventures or other forms of equity ownership in, real estate interests associated with new sites and buildings. These approaches might require greater capital investment than a traditional store lease with a landlord. In the event that such capital and other expenditures require us to pursue additional funding sources, we can provide no assurances that we will be successful in securing additional funding on attractive terms or at all.
While we seek to target capital toward investments that we believe will achieve favorable returns for our shareholders, these decisions involve a significant amount of judgment regarding the availability of capital and the anticipated growth of the business in both revenue and earnings in future periods. For example, while the use of capital to repurchase shares may reduce the number of our outstanding shares which could in turn yield financial benefits to our investors including the potential for increased earnings per share, such share repurchases may increase our aggregate levels of indebtedness, increase our costs for cash and/or non-cash interest expense and divert capital from other purposes including other investments that we might undertake with respect to the business. We can provide no assurances of the exact financial and operational impact of share repurchases on our business and results of operation. Although our share repurchase programs are intended to enhance long-term stockholder value, depending on the exact financial and operational impact of these programs on our business, there can be no assurance that share repurchases will have the benefits that we expect.
When we purchase shares in the market as part of one of our share repurchase programs, we generally undertake such transactions out of a belief that the shares represent a good investment and that the market price for the shares may be undervalued. There can be no assurance that these decisions will prove to be correct as valuation of common stock is subject to a range of factors and is subject to inherent degrees of uncertainty. Over time it may turn out that the value of our common stock will be substantially higher or lower than some of the prices that we pay to undertake repurchase transactions. For example, the market price of our common stock may subsequently decline below the levels at which repurchases were made or it may appreciate to prices substantially above the amounts we pay for the buyback.
20
Pursuit of share repurchases may expose us to other risks in connection with our business including legal and financial constraints, risks related to capital allocation, the level of indebtedness that we carry, increases costs for borrowing, risks related to legal claims and litigation and increased dependency on capital markets and sources of financing to fund the requirements of our business including the costs of any share repurchases. To the extent that we incur indebtedness in connection with our business in connection with or as a result of our share repurchases, the requirements of such debt may include terms and conditions that could have an adverse effect upon our business including as a result of restrictive financial or operational covenants, burdensome rates of interest, cross defaults and other terms that may reduce our operational or financial flexibility or cause us to incur substantial costs including restructuring or refinancing such indebtedness.
In addition, while we anticipate that we will be able to repay our debt maturities as they come due, there can be no assurance that we will have sufficient financial resources or be able to arrange financing to repay these obligations, or that we will be able to extend their maturities or otherwise refinance our obligations as needed. For example, in certain circumstances, we may be required to repay the three series of convertible senior notes that we issued in fiscal 2014, fiscal 2015 and fiscal 2018 with cash payments. See Item 2—Management’s Discussion and Analysis of Financial Condition and Results of Operations—Liquidity and Capital Resources—Convertible Senior Notes. The $350 million principal amount of convertible senior notes that we issued in fiscal 2014 matures on June 15, 2019 and becomes convertible by the holders on and after March 15, 2019 through the close of business on the second schedule trading day immediately preceding June 15, 2019. At the time the notes become due, and prior to maturity to the extent the notes become convertible and a holder exercises such conversion right, the trading price of our common stock may be such that we may find it necessary to settle the notes in cash. There can be no assurance that we will be able to pay the amount of cash due if holders surrender their notes for conversion. In addition, agreements governing any debt may restrict our ability to make each of the required cash payments even if we have sufficient funds to make them. Furthermore, our ability to purchase the notes or to pay cash upon the conversion of the notes may be limited by law or regulatory authority. In addition, if we fail to purchase the notes, to pay special interest, if any, due on the notes, or to pay the amount of cash due upon conversion, we will be in default under the respective indentures governing the notes, which in turn may result in the acceleration of other indebtedness we may then have. If the repayment of the other indebtedness were to be accelerated, we may not have sufficient funds to repay that indebtedness and to purchase the notes or to pay the amount of cash due upon conversion.
The need to repay our convertible senior notes or other debt obligations could cause us to incur additional borrowings or sell additional notes to investors. We may also experience cash flow shortfalls in the future, and we may otherwise require additional external funding, or we may need to raise funds to take advantage of unanticipated opportunities, to make acquisitions of other businesses or companies or to respond to changing business conditions or unanticipated competitive pressures. Any weakening of, or other adverse developments in, U.S. or global market conditions, including as a result of volatility in the stock market, risks related to Brexit, declines in energy prices or the housing market or other U.S. or global political or economic trends, could affect our ability to access future debt and to manage our debt obligations. We cannot assure you that we will be able to raise necessary funds on favorable terms, if at all, or that future financing requirements would not be dilutive to holders of our capital stock. If we fail to raise sufficient additional funds, we may be required to delay or abandon some of our planned future expenditures or aspects of our current operations.
Our business is dependent on certain key personnel; if we lose key personnel or are unable to hire additional qualified personnel, our business may be harmed.
The success of our business depends upon our ability to retain continued service of certain key personnel, particularly our Chairman and Chief Executive Officer, Gary Friedman, and to attract and retain additional qualified key personnel in the future. We face risks related to loss of any key personnel and we also face risks related to any changes that may occur in key senior leadership executive positions. Any disruption in the services of our key personnel could make it more difficult to successfully operate our business and achieve our business goals and could adversely affect our results of operation and financial condition. These changes could also increase the volatility of our stock price.
Many of our key personnel periodically travel together while on company business. We do not have a policy that prohibits key officers and directors from flying together, whether flying commercially or in our corporate aircraft. We face risks related to any loss of key personnel that might arise as a result of such travel arrangements. In addition, we do not maintain key man life insurance policies on any of our key personnel. As a result, we may not be able to cover the financial loss we may incur in losing the services of any of our key personnel.
In August 2018, we appointed a new President, Chief Financial and Administrative Officer in connection with the departure of our previous President, Chief Financial and Administrative Officer. In March 2019, we appointed a new Chief Financial Officer as a result of the new President, Chief Financial and Administrative Officer’s decision to step down due to health considerations. We may face risks related to these and other transitions in our leadership team.
21
Competition for qualified employees and personnel in the retail industry is intense, particularly in the San Francisco Bay Area where our headquarters are located, and we may be unable to retain personnel that are important to our business or hire additional qualified personnel. The process of identifying personnel with the combination of skills and attributes required to carry out our goals is often lengthy. Our success depends to a significant degree upon our ability to attract, retain and motivate qualified management, marketing and sales personnel, and store managers, and upon the continued contributions of these people. In addition, our complex operations require the services of qualified and experience management personnel, with expertise in the areas including information technology and supply chain management. We cannot assure you that we will be successful in attracting and retaining qualified executives and personnel. In addition, we are pursuing a dynamic business model which is subject to a number of new business initiatives as we seek to optimize our business and financial performance. As a result of the ongoing evolution of our business, we frequently implement changes to our organizational design in order to more closely align our management structure with the needs of the business. In connection with such changes to our management structure, we also implement changes in personnel and reductions in force as a result of which we may incur severance costs and other reorganization charges and expenses. Changes in our organizational structure may also have an impact on retention of personnel.
Inasmuch as our success depends in part upon our ability to attract, motivate and retain a sufficient number of store and other employees who understand and appreciate our corporate culture and customers. Turnover in the retail industry and food and beverage industry is generally high. Excessive employee turnover will result in higher employee costs associated with finding, hiring and training new store employees. If we are unable to hire and retain store and other personnel capable of consistently providing a high level of customer service, our ability to open new stores, service the needs of our customers and expand our food and beverage business may be impaired, the performance of our existing and new stores and operations could be materially adversely affected and our brand image may be negatively impacted.
Material damage to, or interruptions in, our information systems as a result of external factors, staffing shortages, cybersecurity breaches or cyber fraud, or difficulties in updating our existing software or developing or implementing new software could have a material adverse effect on our business or results of operations, and we may be exposed to risks and costs associated with protecting the integrity and security of our customers’ information.
We depend largely upon our information technology systems in the conduct of all aspects of our operations, many of which we have only adopted and implemented within the past several years or are in the midst of implementing in connection with rebuilding our supply chain and infrastructure. These systems can be complex to develop, maintain, upgrade and protect against emerging threats, and we may fail to adequately hire or retain adequate personnel to manage our information systems, we may fail to accurately gauge the level of financial and managerial resources to invest in our information systems, or we may fail to realize the anticipated benefits of resources invested in our information systems particularly as our business changes as a result of the many initiatives that we are pursuing. Such systems are subject to damage or interruption from power outages, computer and telecommunications failures, computer viruses, security breaches and natural disasters. In addition, damage or interruption can also occur as a result of non-technical issues, including vandalism, catastrophic events, and human error. Damage or interruption to our information systems may require a significant investment to fix or replace the affected system, and we may suffer interruptions in our operations in the interim. Any material interruptions or failures in our systems or the systems of our third party vendors may have a material adverse effect on our business or results of operations.
We may be the target of cyber fraud, hacking or theft. Because techniques used to obtain unauthorized access or to sabotage systems change frequently and often are not recognized until launched against a target, we may be unable to anticipate these techniques or to implement adequate preventative measures. Our operations are also dependent on the information technology systems and cybersecurity measures of our third party vendors. Attempted cyber intrusions into our information systems through compromised vendor networks, if successful, could compromise our information systems. In addition, our information systems can face risks to the extent we acquire new businesses but are not able to quickly or comprehensively integrate such acquired businesses into our policies and procedures for addressing cybersecurity risks or identify and address weaknesses in such acquired entity’s information systems, which risks may be compounded to the extent the information systems of an acquired entity are integrated with ours, thus providing access to a broader set of sensitive customer information through a compromised network at the acquired entity level. If a computer hacker or other third party is able to circumvent our security measures, he or she could destroy or steal valuable information or disrupt our operations. Any successful breaches or attempted intrusions could result in increased information systems costs and potential reputational damage, which could materially adversely affect our business and results of operations.
Additionally, in order for our business to function successfully, we and other market participants must be able to handle and transmit confidential and personal information securely, including in customer orders placed through our website. That information may include data about our customers, including personally identifiable information and credit card information, as well as sensitive information about our vendors and workforce, including social security numbers and bank account information. If our systems are damaged, interrupted or subject to unauthorized access, information about our customers, vendors or workforce could be stolen or misused. Any security breach could expose us to risks of data loss, fines, litigation and liability and could seriously disrupt our
22
operations and harm our reputation, any of which could adversely affect our business. We may be subject to one or more claims or lawsuits related to the intentional or unintentional release of confidential or personal information, including personally identifiable information about our customers, vendors or workforce. In addition to the possibility of fines, lawsuits and other claims, we could be required to expend significant resources to change our business practices or modify our service offerings in connection with the protection of personally identifiable information, which could have a material adverse effect on our business. Any breach could also cause consumers to lose confidence in the security of our website and choose not to purchase from us.
We are also subject to payment card association rules and network operating rules, including data security rules, certification requirements and rules governing electronic funds transfers, which could change over time. For example, we are subject to Payment Card Industry Data Security Standards (“PCI DSS”), which contain compliance guidelines and standards with regard to our security surrounding the physical and electronic storage, processing and transmission of individual cardholder data. As of October 1, 2015, the payment card industry shifted the liability of certain credit card transactions to retailers who are not able to process Europay, MasterCard, Visa (“EMV”) chip enabled card transactions. As a result, before our implementation of the EVM technology is complete, we may be liable for costs incurred by payment card issuing banks or other third parties for fraudulent transactions initiated through EMV chip enabled cards before our implementation of EMV chip technology. In addition, if our internal systems are breached or compromised, we may be liable for card re-issuance costs, subject to fines and higher transaction fees and lose our ability to accept credit and/or debit card payments from our members, and our business and operating results could be adversely affected.
States and the federal government have enacted additional laws and regulations to protect consumers against identity theft, including laws governing treatment of personally identifiable information. These laws have increased the costs of doing business and, if we fail to implement appropriate safeguards or we fail to detect and provide prompt notice of unauthorized access as required by some of these laws, we could be subject to potential claims for damages and other remedies. If we were required to pay any significant amount in satisfaction of claims under these laws, or if we were forced to cease our business operations for any length of time as a result of our inability to comply fully with any such law, our business, results of operations and financial condition could be adversely affected. We may also incur legal costs if we are required to defend our methods of collection, processing and storage of personal data. Investigations, lawsuits, or adverse publicity relating to our methods of handling personal data could result in increased costs and negative market reaction.
Furthermore, data security breaches suffered by well-known companies and institutions have attracted a substantial amount of media attention, prompting additional state and federal proposals addressing data privacy and security. As the data privacy and security laws and regulations evolve, we may be subject to more extensive requirements to protect the customer information that we process in connection with the purchases of our products. Our failure to successfully respond to these risks and uncertainties could reduce website sales and have a material adverse effect on our business or results of operations.
We currently maintain insurance to protect against cybersecurity risks and incidents. However, there can be no assurance that such insurance coverage will be available in the future on commercially reasonable terms or at commercially reasonable rates. In addition, insurance coverage may be insufficient or may not cover certain cybersecurity losses and liability.
We face product liability risks and certain of our products may be subject to recalls or other actions by regulatory authorities, and any such recalls or similar actions could have a material adverse effect on our business.
We face product liability, product safety and product compliance risks relating to the design, manufacturing, raw material sourcing, testing, contents, importation, sale, use and performance of some of our products. The products we sell must be designed and manufactured to be safe for their intended purposes. Some of our products must comply with certain federal and state laws and regulations. For example, some of our products are subject to the Consumer Product Safety Act, the Federal Hazardous Substances Act and the Consumer Product Safety Improvement Act (the “CPSIA”), which empower the Consumer Product Safety Commission (the “CPSC”) to establish product bans, substance bans, substance limits, performance requirements, test methods and other compliance verification processes. The CPSC is empowered to take action against hazards presented by consumer products, up to and including product recalls. We are required to report certain incidents related to the safety and compliance of our products to the CPSC, and failure to do so could result in a civil penalty. The CPSC is particularly active in regulation and enforcement activities related to the kinds of children’s products sold in our RH Baby & Child division. Certain of the products we sell are subject to the Lacey Act, prohibiting the importation and sale of products containing illegally harvested wood, among other things. Likewise, many of our products are subject to the regulations of the California Air Resources Board (the “CARB”) and the Environmental Protection Agency regarding formaldehyde emissions from composite wood products (e.g., plywood and medium density fiberboard).
If we experience negative publicity, regardless of any factual basis, customer complaints or litigation alleging illness or injury, related to our products, or if there are allegations of failure to comply with applicable regulations, our brand reputation would be harmed.
23
We maintain a product safety and compliance program to help ensure our products are safe, legal and made consistently in compliance with our values. Nevertheless, our products have in the past (including during fiscal 2018) been, and may in the future be, subject to recall for product safety and compliance reasons. Our efforts to address the sources of these product recalls, including those due to products sourced from our vendors, may not be successful and we may continue to face additional product recalls. Concerns of product safety and compliance could result in future voluntary or involuntary removal of products, product recalls, other actions by applicable government authorities or product liability, personal injury or property damage claims. To the extent future product recalls create a negative public perception of our business, we could face reputational harm or could be subject to elevated levels of legal claims. There can be no assurance that we will have the benefit of adequate insurance or payments from third parties including our product vendors in order to address losses and expenses that we may incur in connection with product recalls. Not all of the costs and expenses that we have previously incurred in connection with product recalls have been covered by insurance or reimbursement from third parties including our product vendors. We and our product vendors may be unable to obtain such insurance or the insurance may be prohibitively expensive and any coverage that is available may be inadequate to cover costs we incur in connection with product recalls.
Federal, state, provincial and local legislators and regulators in the United States, Canada and the U.K., where our products are sold, continue to adopt new product laws and regulations. These new laws and regulations have increased or likely will significantly increase the regulatory requirements governing the manufacture and sale of certain of our products as well as the potential penalties for noncompliance with applicable regulations. In addition, product recalls, removal of products, product compliance enforcement actions and defending product liability claims can result in, among other things, lost sales, diverted resources, potential harm to our reputation and increased customer service costs, any of which could have a material adverse effect on our business and results of operations.
There are claims made against us and/or our management from time to time that can result in litigation or regulatory proceedings, which could distract management from our business activities and result in significant liability.
From time to time, we and/or our management are involved in litigation, claims and other proceedings relating to the conduct of our business, including purported class action litigation. Such legal proceedings may include claims related to our employment practices, claims of intellectual property infringement, including with respect to copyright, trademarks, patents and trade dress, claims asserting unfair competition and unfair business practices, claims with respect to our collection and sale of reproduction products, consumer class action claims relating to our consumer practices including the collection of zip code or other information from customers, and claims alleging securities fraud. In addition, from time to time, we are subject to product liability and personal injury claims for the products that we sell and the stores we operate. Subject to certain exceptions, our purchase orders generally require the vendor to indemnify us against any product liability claims; however, if the vendor does not have insurance or becomes insolvent, we may not be indemnified. In addition, we could face a wide variety of employee claims against us, including general discrimination, privacy, labor and employment, ERISA and disability claims. Any claims could result in litigation against us and could also result in regulatory proceedings being brought against us by various federal and state agencies that regulate our business, including the United States Equal Employment Opportunity Commission. Often these cases raise complex factual and legal issues, which are subject to risks and uncertainties and which could require significant management time. Litigation against us, depending on the outcome of such claims, could lead to further claims and proceedings including on new and otherwise unrelated matters, for example by attracting the attention of plaintiff’s firms or of regulators. Litigation and other claims and regulatory proceedings against our management or us could result in unexpected expenses and liability and could also materially adversely affect our operations and our reputation.
Intellectual property claims by third parties or our failure or inability to protect our intellectual property rights could diminish the value of our brand and weaken our competitive position.
Third parties have in the past asserted, and may in the future assert, intellectual property claims against us, particularly as we expand our business to include new products and product categories and move into other geographic markets. Our defense of any claim, regardless of its merit, could be expensive and time consuming and could divert management resources. Successful infringement claims against us could result in significant monetary liability and prevent us from selling some of our products. In addition, resolution of claims may require us to redesign our products, license rights from third parties or cease using those rights altogether, which could have a material adverse impact on our business, financial condition or results of operations.
We currently rely on a combination of copyright, trademark, patent, trade dress and unfair competition laws, as well as confidentiality procedures and licensing arrangements, to establish and protect our intellectual property rights. We believe that our photographs, trademarks and other proprietary rights have significant value and are important to identifying and differentiating certain of our products and brand from those of our competitors and creating and sustaining demand for certain of our products. We have from time to time encountered other retailers selling products substantially similar to our products or misrepresenting that the products such retailers were selling were our products. We cannot assure you that the steps taken by us to protect our intellectual property rights will be adequate to prevent infringement of our rights by others (especially with respect to infringement by non-U.S. entities with no physical U.S. presence), including imitation of our products and misappropriation of our images and brand. The costs of defending and enforcing our intellectual property assets may incur significant time and legal expense, and we may not be entirely successful in protecting our assets, enforcing our rights or collecting on judgments as a prevailing party. If we are unable to protect and maintain our intellectual property rights, the value of our brand could be diminished and our competitive position could suffer.
24
Compliance with laws, including laws relating to our business activities outside of the United States, may be costly, and changes in laws could make conducting our business more expensive or otherwise change the way we do business.
We are subject to numerous regulations, including labor and employment, customs, truth-in-advertising, consumer protection, e-commerce, privacy, safety, real estate, environmental and zoning and occupancy laws, and other laws and regulations that regulate retailers, food and beverage providers or otherwise govern our business. In addition, to the extent we expand our operations as a result of engaging in new business initiatives or product lines, pursuing our multi-tier real estate strategy or expanding into new international markets, we may become subject to new regulations and regulatory regimes. We may need to continually reassess our compliance procedures, personnel levels and regulatory framework in order to keep pace with the numerous business initiatives that we are pursuing, and there can be no assurance that we will be successful in doing so. If the regulations applicable to our business operations were to change or were violated by us or our vendors or buying agents, the costs of certain goods could increase, or we could experience delays in shipments of our goods, be subject to fines or penalties, or suffer reputational harm, which could reduce demand for our products and harm our business and results of operations.
In addition to increased regulatory compliance requirements, changes in laws could make ordinary conduct of our business more expensive or require us to change the way we do business. For example, as a retail business, changes in laws related to employee benefits and treatment of employees, including laws related to limitations on employee hours, supervisory status, leaves of absence, mandated health benefits or overtime pay, could negatively impact us by increasing compensation and benefits costs for overtime and medical expenses. In addition, changes to United States health care laws, or potential global and domestic greenhouse gas emission requirements and other environmental legislation and regulations, could result in increased direct compliance costs for us (or may cause our vendors to raise the prices they charge us in order to maintain profitable operations because of increased compliance costs), increased transportation costs or reduced availability of raw materials.
In fiscal 2018, we sourced 85% of our products from outside the United States, and we are increasing the level of our international sourcing activities in an effort to obtain more of our products directly from vendors located outside the United States. Additionally, we have expanded our business-to-business sales. The foreign and U.S. laws and regulations that are applicable to our operations are complex and may increase the costs of regulatory compliance, or limit or restrict the products or services we sell or subject our business to the possibility of regulatory actions or proceedings. The United States Foreign Corrupt Practices Act, and other similar laws and regulations, generally prohibit companies and their intermediaries from making improper payments to foreign governmental officials for the purpose of obtaining or retaining business. While our policies mandate compliance with applicable laws and regulations, including anti-bribery laws and other anti-corruption laws, we cannot assure you that we will be successful in preventing our employees or other agents from taking actions in violation of these laws or regulations. Such violations, or allegations of such violations, could disrupt our business and result in a material adverse effect on our financial condition, results of operations and cash flows.
Labor organizing and other activities could negatively impact us.
Currently, none of our employees are represented by a union. However, our employees have the right at any time to form or affiliate with a union, and union organizational activities have occurred from time to time. We cannot predict the negative effects that any future organizing activities will have on our business and operations. If we were to become subject to work stoppages, we could experience disruption in our operations and increases in our labor costs, either of which could materially adversely affect our business, financial condition or results of operations.
In addition, one of our key value driving strategies involves the development and introduction of new Gallery locations. We pursue a range of different real estate development models for these projects. In a number of these projects, we perform a significant role in various aspects of the design and construction of the Gallery location. Both we and third party contractors that we use in these construction projects may be subject to efforts and activities by organized labor to drive the hiring of union labor on these projects. To the extent that union workers are not involved in these projects, we and our third party contractors may be subject to picketing and other labor actions that could affect our business including protests in front of our Gallery locations in order to discourage our customers from entering our stores, which could adversely affect our business at those locations and our results of operations, including our same-store sales metrics. In addition, to the extent that we become more directly involved in additional aspects of the construction work at our Gallery locations, we could be subject to additional pressure from organized labor including union organizing efforts.
25
Fluctuations in our tax obligations and effective tax rate and realization of our deferred tax assets, including net operating loss carryforwards, may result in volatility of our results of operations.
We are subject to income taxes in the United States and certain foreign jurisdictions. We record income tax expense based on our estimates of future payments, which include reserves for uncertain tax positions in multiple tax jurisdictions, and valuation allowances related to certain net deferred tax assets, including net operating loss carryforwards. At any one time, many tax years are subject to audit by various taxing jurisdictions. The results of these audits and negotiations with taxing authorities may affect the ultimate settlement of these issues. We expect that throughout the year there could be ongoing variability in our quarterly tax rates as events occur and exposures are evaluated.
In addition, our effective tax rate in a given financial statement period may be materially impacted by changes in the mix and level of earnings, timing of the utilization of net operating loss carryforwards, changes in the valuation allowance for deferred taxes or by changes to existing accounting rules or regulations.
The United States enacted the Tax Cuts and Jobs Act (the “Tax Act”) on December 22, 2017, which had a significant impact to our provision for income taxes as of February 2, 2019 and February 3, 2018. The Tax Act includes a number of changes to existing U.S. tax laws that impact us, including the reduction of the U.S. corporate income tax rate from 35% to 21% effective January 1, 2018. The Tax Act also provides for a one-time transition tax on accumulated foreign earnings and the acceleration of depreciation for certain assets, as well as prospective changes beginning in 2018, including limitations on the deductibility of executive compensation and interest, the elimination of certain domestic deductions and credits, the elimination of the Alternative Minimum Tax regime, and modifications to the deductibility and carryforward period of net operating losses. The Tax Act transitions U.S. international taxation from a worldwide system to a modified territorial system and includes base erosion prevention measures on non-U.S. earnings, which may have the effect of subjecting certain earnings of our foreign subsidiaries to U.S. taxation.
The Tax Act requires complex computations to be performed that were not previously required under U.S. tax law, significant judgments to be made in interpretation of the provisions of the Tax Act and significant estimates in calculations, and the preparation and analysis of information not previously relevant or regularly produced. The U.S. Treasury Department, the Internal Revenue Service, and other standard-setting bodies could interpret or issue guidance on how provisions of the Tax Act will be applied or otherwise administered that is different from our interpretation. We have completed our analysis of the Tax Act, and have not made material adjustments to the provisional amounts that we previously recorded.
Provisions of the Tax Act may also impact our customers and the high end housing market. For example, the Tax Act changes the availability of deductions for mortgage interest and state income and property taxes. The reduction of such deductions may adversely impact the high-end housing market or consumption patterns by our customers. The full impact of the Tax Act on us as a taxpayer, our customers, the housing market, the luxury retail market and the U.S. economy in general is unknown and may not become fully clear for some time. Our business and results of operations may be adversely impacted by changes in consumer and market behavior in response to the Tax Act and its evolving interpretation.
Changes to accounting rules or regulations may adversely affect our results of operations.
New accounting rules or regulations and varying interpretations of existing accounting rules or regulations have occurred and may occur in the future. It is difficult to predict the impact of future changes to accounting principles or current accounting practice and the exact impact of such changes may not be what we anticipate. A change in accounting rules or regulations may even affect our reporting of transactions completed before the change is effective and future changes to accounting rules or regulations or the questioning of current accounting practices may adversely affect our results of operations. For example, we adopted Accounting Standards Update 2014-09—Revenue from Contracts with Customers (Topic 606) in the first quarter of fiscal 2018, the adoption of which materially impacted the timing of recognizing advertising expense related to direct response advertising, including costs associated with our Source Books. In addition, we adopted Accounting Standards Update 2016-02—Leases (Topic 842) in the first quarter of fiscal 2019, the adoption of which will have a material impact on our consolidated balance sheets due to the initial recognition of right of use assets and lease liabilities for our operating and finance lease arrangements. In addition, the adoption of Topic 842 will have a material impact on our consolidated statements of income, specifically cost of goods sold and interest expense—net, primarily due to the change from the build-to-suit lease transactions under the previous accounting guidance to the new finance lease classification treatment. For information regarding recently issued accounting pronouncements, refer to Note 3—Significant Accounting Polices in our consolidated financial statements within Part II of this Annual Report on Form 10-K.
Further, to the extent we experience any increases in costs or diversions in managerial or personnel resources in order to adopt new accounting rules or regulations, our results of operations could be materially adversely affected.
26
We may be unsuccessful in identifying attractive acquisition opportunities or, to the extent that we pursue attractive acquisition opportunities, we may be unsuccessful in completing or realizing the expected benefits of such acquisitions.
As part of exploring growth opportunities, we may from time to time seek to acquire value-creating, add-on businesses that we believe will broaden our existing position and market reach. For example, in fiscal 2016, we acquired a controlling interest in Waterworks. In the fourth quarters of fiscal 2018 and fiscal 2017, we recorded a goodwill impairment charge of $17.4 million and $33.7 million, respectively, with respect to Waterworks due to indicators identified in the fourth quarters of fiscal 2018 and fiscal 2017 that there could be an impairment of the Waterworks reporting unit. In addition, in the fourth quarter of fiscal 2018, we recorded a tradename impairment charge of $14.6 million with respect to Waterworks due to indicators identified in the fourth quarter of fiscal 2018 that there could be an impairment of the Waterworks reporting unit. Refer to Note 3—Significant Accounting Polices in our consolidated financial statements within Part II of this Annual Report on Form 10-K. There can be no assurance that the Waterworks business will meet its future operating or financial objectives and if its results do not improve we may recognize additional charges related to this business and our financial results of operation may be adversely affected.
Furthermore, there can be no assurance that in the future we will be able to find suitable businesses to purchase if we choose to acquire additional businesses, that we will be able to acquire such businesses on acceptable terms, or that we will be successful in realizing the benefits of any acquisition we pursue. If we are unsuccessful in any such acquisition efforts, then our ability to continue to grow at rates we anticipate could be adversely affected.
In addition, we face the risk that an acquired business may not be successful on the RH platform and may underperform relative to expectations. We may be unable to achieve synergies originally anticipated, we may be exposed to unexpected liabilities or we may be unable to sufficiently integrate completed acquisitions into our current business model and platform. The success of any completed acquisition will depend on our ability to effectively manage the business after the acquisition. The process of maintaining the right incentives for management of acquired businesses and integrating the acquired businesses may involve unforeseen difficulties and may require a disproportionate amount of our managerial and financial resources. Our failure to incorporate acquired businesses into our existing operations successfully or to minimize any unforeseen operational difficulties could have a material adverse effect on our financial condition and results of operations. Further, if we fail to allocate our capital appropriately, in respect of either our acquisitions or organic growth in our operations, we could be overexposed in certain markets and geographies and unable to expand into adjacent products or markets.
Any efforts that we undertake to improve the operations of an acquired business or to improve the integration of such business with our larger business operations may not be successful and may create additional operational challenges, in particular at a time when we are also engaged in numerous initiatives to re-conceptualize our own organizational design and elevate the customer experience. To the extent we are unsuccessful in such efforts, and our acquired business does not perform in line with our expectations or does not contribute to the overall performance of our business, our gross margins, results of operations and business could be materially adversely affected.
Our total assets include intangible assets with an indefinite life, goodwill, tradename and trademarks, and substantial amounts of long-lived assets, principally property and equipment. Changes to estimates or projections used to assess the fair value of these assets, or results of operations that are lower than our current estimates at certain store locations, may cause us to incur impairment charges that could adversely affect our results of operations.
Our total assets include intangible assets with an indefinite life, goodwill, tradename and trademarks, and substantial amounts of property and equipment. We evaluate these long-lived assets for possible impairment annually or earlier if impairment indicators exist and make certain estimates and projections in connection with the impairment analyses for these long-lived assets. We also review the carrying value of these assets for impairment whenever events or changes in circumstances indicate that the carrying value of the asset may not be recoverable. We will record an impairment loss when the carrying value of the underlying asset, asset group or reporting unit exceeds its fair value. These calculations require us to make a number of estimates and projections of future results. If these estimates or projections change, we may be required to record additional impairment charges on certain of these assets. If these impairment charges were significant, our results of operations would be adversely affected.
In fiscal 2018 and fiscal 2017, we recorded goodwill impairment related to the Waterworks reporting unit of $17.4 million and $33.7 million, respectively. In fiscal 2018, we recorded tradename impairment related to the Waterworks reporting unit of $14.6 million. Additionally, in fiscal 2018 and fiscal 2017, we recorded impairment charges on long-lived assets of $0.2 million and $4.5 million, respectively, due to the closure of three distribution centers. In fiscal 2016, we recorded impairment charges on long-lived assets of $5.5 million due to the decisions made to integrate the RHCA product line into the broader RH platform and of $4.8 million due to the decision to sell an aircraft. There can be no assurance that we will not experience further impairment charges with respect to the Waterworks reporting unit or impairment charges with respect to other assets in future periods.
27
If we are unable to implement and maintain effective internal control over financial reporting in the future, the accuracy and timeliness of our financial reporting may be adversely affected.
We are subject to Section 404 of the Sarbanes-Oxley Act of 2002, as amended (the “Sarbanes-Oxley Act”), which requires us to maintain internal control over financial reporting and to report any material weaknesses in such internal control. We have in the past periodically experienced deficiencies in our internal controls that have been identified during the audit process or at other times. Management has concluded that our internal control over financial reporting was effective as of February 2, 2019. However, if we identify in the future one or more material weaknesses in our internal control over financial reporting, we will be unable to assert that our internal control over financial reporting is effective. In addition, our independent registered public accounting firm is required to attest to the effectiveness of our internal control over financial reporting. Therefore, even if our management concludes in the future that our internal control over financial reporting is effective, our independent registered public accounting firm may issue a report that is qualified if they are not satisfied with our controls or the level at which our controls are documented, designed, operated, or reviewed. Material weaknesses and significant deficiencies may be identified during the audit process or at other times.
Our reporting obligations as a public company place a significant strain on our management and our operational and financial resources and systems and will continue to do so for the foreseeable future. In addition, we have experienced changes in personnel who are involved in our financial reporting. Although we believe that we have invested adequate resources in developing and maintaining the procedures, personnel and systems necessary to support our reporting obligations, there can be no assurance that these efforts have been or will be successful. Changes in personnel, systems or procedures, as well as other events might have an adverse impact on our internal controls. Deficiencies in our internal controls or other challenges in the financial reporting aspects of our business may have an adverse impact on our ability to provide financial statements in accordance with generally accepted accounting procedures and may give rise to errors in our financial statement. There can be no assurance that our internal controls and financial reporting infrastructure and personnel have in the past complied, or will continue in the future to comply, with our financial reporting obligations. If we fail to timely achieve and maintain the adequacy of our internal control over financial reporting, we may not be able to produce reliable financial reports. Our failure to achieve and maintain effective internal control over financial reporting could prevent us from filing our periodic reports on a timely basis, which could result in the loss of investor confidence in the reliability of our financial statements, harm our business, and negatively impact the trading price of our common stock.
Our operations are subject to risks of natural or man-made disasters, acts of war, terrorism or widespread illness, any one of which could result in a business stoppage and negatively affect our results of operations.
Our business operations depend on our ability to maintain and protect our facilities, computer systems and personnel. Our operations and consumer spending may be affected by natural or man-made disasters or other similar events, including floods, hurricanes, earthquakes, widespread illness, fires, loss of power, interruption of other utilities, industrial accidents, social unrest and riots. In particular, our corporate headquarters is located in Northern California and other parts of our operations are located in Northern and Southern California, each of which is vulnerable to the effects of disasters, including fires and earthquakes that could disrupt our operations and affect our results of operations, and there is evidence that extreme weather, extended drought and shifting climate patterns have intensified the frequency and severity of wildfires in California. Many of our vendors are also located in areas that may be affected by such events. Moreover, geopolitical or public safety conditions which affect consumer behavior and spending may impact our business. Terrorist attacks or other hostilities, or threats thereof, in the United States or in other countries around the world, as well as future events occurring in response to or in connection with them, could again result in reduced levels of consumer spending. Any of these occurrences could have a significant impact on our results of operations, revenue and costs.
If we encounter difficulties associated with any of our facilities or if any of our facilities were to shut down for any reason, including as a result of a natural disaster, we could face shortages of inventory resulting in backorders, significantly higher costs and longer lead times associated with distributing our products to both our stores and online customers and the inability to process orders in a timely manner or ship goods to our customers. Further, any significant interruption in the operation of our customer service centers could also reduce our ability to receive and process orders and provide products and services to our stores and customers, which could result in lost sales, cancelled sales and a loss of loyalty to our brand and have a material adverse effect on our business, financial condition and results of operations.
28
Risks Related to Ownership of Our Common Stock
Our common stock price may be volatile or may decline regardless of our operating performance.
The market price for our common stock has in the past been, and may in the future be volatile. As a retailer, our results are significantly affected by factors outside our control, particularly consumer spending and consumer confidence, which can significantly affect our stock price. In addition, the market price of our common stock may fluctuate significantly in response to a number of other factors, including those described elsewhere in this “Risk Factors” section, as well as the following:
|
|
• |
quarterly variations in our results of operations compared to market expectations; |
|
|
• |
changes in preferences of our customers; |
|
|
• |
announcements of new products or significant price reductions by us or our competitors; |
|
|
• |
size of our public float; |
|
|
• |
stock price performance of our competitors; |
|
|
• |
fluctuations in stock market prices and volumes; |
|
|
• |
default on our indebtedness; |
|
|
• |
actions by competitors or other shopping center tenants; |
|
|
• |
changes in senior management or key personnel; |
|
|
• |
changes in financial estimates by securities analysts or failure to meet their expectations; |
|
|
• |
actual or anticipated negative earnings or other announcements by us or other retail companies; |
|
|
• |
downgrades in our credit ratings or the credit ratings of our competitors; |
|
|
• |
natural or man-made disasters or other similar events; |
|
|
• |
issuances or expected issuances of capital stock; and |
|
|
• |
global economic, legal and regulatory changes unrelated to our performance. |
In addition, stock markets have experienced extreme price and volume fluctuations that have affected and continue to affect the market prices of equity securities of many retail companies. Stockholders can institute securities class action litigation following periods of market volatility. We have been subject to such class action securities litigation and may experience further claims of this kind. Any such securities litigation can result in substantial costs and expenses and the attention of management could be diverted from our business.
Substantial future sales of our common stock, or the perception in the public markets that these sales may occur, may depress our stock price.
In the future, we may issue our securities in connection with a capital raise or acquisitions. The amount of shares of our common stock issued in connection with a capital raise or acquisition could constitute a material portion of our then-outstanding shares of our common stock, which would result in dilution.
In addition, sales of substantial amounts of our common stock in the public market, or the perception that these sales could occur, could adversely affect the price of our common stock and could impair our ability to raise capital through the sale of additional shares.
Anti-takeover provisions in our charter documents and Delaware law might discourage or delay acquisition attempts for us that you might consider favorable.
Our certificate of incorporation and bylaws contain provisions that may make the acquisition of our Company more difficult without the approval of our board of directors. These provisions:
|
|
• |
establish a classified board of directors so that not all members of our board of directors are elected at one time; |
|
|
• |
authorize the issuance of undesignated preferred stock, the terms of which may be established and the shares of which may be issued without stockholder approval, and which may include super voting, special approval, dividend or other rights or preferences superior to the rights of the holders of common stock; |
29
|
|
• |
prohibit stockholder action by written consent, which requires all stockholder actions to be taken at a meeting of our stockholders; |
|
|
• |
provide that our board of directors is expressly authorized to make, alter or repeal our bylaws; and |
|
|
• |
establish advance notice requirements for nominations for elections to our board of directors or for proposing matters that can be acted upon by stockholders at stockholder meetings. |
Our certificate of incorporation also contains a provision that provides us with protections similar to Section 203 of the Delaware General Corporation Law (“DGCL”), and prevents us from engaging in a business combination with a person who acquires at least 15% of our common stock for a period of three years from the date such person acquired such common stock unless board or stockholder approval is obtained prior to the acquisition, subject to certain exceptions. These anti-takeover provisions and other provisions under Delaware law could discourage, delay or prevent a transaction involving a change in control of our Company, even if doing so would benefit our stockholders. These provisions could also discourage proxy contests and make it more difficult for you and other stockholders to elect directors of your choosing and to cause us to take other corporate actions you desire.
We do not expect to pay any cash dividends for the foreseeable future.
We do not anticipate that we will pay any cash dividends on shares of our common stock for the foreseeable future. Any determination to pay dividends in the future will be at the discretion of our board of directors and will depend upon results of operations, financial condition, contractual restrictions, restrictions imposed by applicable law and other factors our board of directors deems relevant. Accordingly, realization of a gain on your investment will depend on the appreciation of the price of our common stock, which may never occur. Investors seeking cash dividends in the foreseeable future should not purchase our common stock.
We expect that our common stock may experience increased trading volatility in connection with our Convertible Notes Financings.
In June 2018, we issued $300 million of 0.00% convertible senior notes due 2023 and, on June 26, 2018, we issued an additional $35 million pursuant to the exercise of an overallotment option granted to the initial purchasers as part of the June 2018 offering (the “2023 Notes”). In June 2015, we issued $250 million of 0.00% convertible senior notes due 2020 and, on July 2, 2015, we issued an additional $50 million pursuant to the exercise of the overallotment option granted to the initial purchasers as part of the June 2015 offering (collectively, the “2020 Notes”). In June 2014, we issued $300 million of 0.00% convertible senior notes due 2019 and, on June 24, 2014, we issued an additional $50 million pursuant to the exercise of an overallotment option granted to the initial purchasers as part of the June 2014 offering (the “2019 Notes” and, together with the 2023 Notes and the 2020 Notes, the “Notes”). In connection with each offering of the Notes, we entered into convertible note hedge transactions with certain counterparties (the “Bond Hedge”) and warrant transactions (the “Warrants” and together with the Notes and the Bond Hedge, the “Convertible Notes Financings”) with the same counterparties (the “hedge counterparties”).
We have been advised that, in connection with establishing their initial hedge positions with respect to the Bond Hedge and Warrants, the hedge counterparties and/or their affiliates would likely purchase shares of our common stock or enter into various derivative transactions with respect to our common stock concurrently with, or shortly after, the pricing of the Notes, including with certain investors in the Notes. These hedging activities could increase (or reduce the size of any decrease in) the market price of our common stock or the Notes.
In addition, we expect that many investors in, including future purchasers of, the Notes may employ, or seek to employ, a convertible arbitrage strategy with respect to the Notes. Investors would typically implement such a strategy by selling short the common stock underlying the Notes and dynamically adjusting their short position while continuing to hold the Notes. Investors may also implement this type of strategy by entering into swaps on our common stock in lieu of or in addition to short selling the common stock.
Further, investors in the Notes may periodically modify their arbitrage strategies with respect to the Notes or modify their hedge positions with respect to the Notes from time to time. The hedge counterparties and/or their respective affiliates also may periodically modify their hedge positions from time to time (and are likely to do so during the conversion period relating to any conversion of the Notes or following any repurchase of Notes by us on any fundamental repurchase date or otherwise). Such modifications may be implemented by entering into or unwinding various derivatives with respect to our common stock, and/or by purchasing or selling shares of our common stock or other securities of the Company in secondary market transactions and/or open market transactions. The effect, if any, of these transactions and activities on the market price of our common stock or the trading prices of the Notes (which could affect a noteholder’s ability to convert the Notes or the amount and value of the consideration received upon conversion of the Notes) will depend in part on market conditions and cannot be ascertained at this time. Any of these activities, however, could adversely affect the market price of our common stock.
30
It is not possible to predict the effect that these hedging or arbitrage strategies adopted by holders of the Notes or counterparties to the Bond Hedge and Warrants will have on the market price of our common stock. For example, the SEC and other regulatory and self-regulatory authorities have implemented various rules and taken certain actions, and may in the future adopt additional rules and take other actions, that may impact those engaging in short selling activity involving equity securities (including our common stock). Such rules and actions include Rule 201 of SEC Regulation SHO, the adoption by the Financial Industry Regulatory Authority, Inc. of a “Limit Up-Limit Down” program, the imposition of market-wide circuit breakers that halt trading of securities for certain periods following specific market declines, and the implementation of certain regulatory reforms required by the Dodd-Frank Wall Street Reform and Consumer Protection Act of 2010. Any changes in government regulations or other factors that affect the manner in which third parties can engage in hedging strategies, including entering into short sales or swaps on our common stock, could adversely affect the trading prices and the liquidity of the Notes and/or our common stock.
Taken together, the Bond Hedge and Warrants are intended, but not guaranteed, to offset any actual earnings dilution that could occur upon delivery of shares of common stock to satisfy to our conversion obligation under the Notes. For the 2023 Notes, the corresponding Bond Hedge and Warrants are intended to limit the earnings dilution that our stockholders would experience until the Company’s common stock is above approximately $309.84 per share, the strike price of the 2023 Notes warrant transactions, which represented a 100% premium over the closing price of our common stock at the time we entered into the Bond Hedge and Warrants related to the 2023 Notes. For the 2020 Notes, the corresponding Bond Hedge and Warrants are intended to limit the earnings dilution that our stockholders would experience until the Company’s common stock is above approximately $189.00 per share, the strike price of the 2020 Notes warrant transactions, which represented a 100% premium over the closing price of our common stock at the time we entered into the Bond Hedge and Warrants related to the 2020 Notes. For the 2019 Notes, the corresponding Bond Hedge and Warrants are intended to limit the earnings dilution that our stockholders would experience until the Company’s common stock is above approximately $171.98 per share, the strike price of the 2019 Notes warrant transactions, which represented a 100% premium over the closing price of our common stock at the time we entered into the Bond Hedge and Warrants related to the 2019 Notes. However, these transactions are complex, and there can be no assurance that they will operate as planned.
We do not make any representation or prediction as to the direction or magnitude of any potential effect that the transactions described above may have on the price of our common stock. In addition, we do not make any representation that the counterparties to those transactions will engage in these transactions or activities or that these transactions and activities, once commenced, will not be discontinued without notice; the counterparties or their affiliates may choose to engage in, or discontinue engaging in, any of these transactions or activities with or without notice at any time, and their decisions will be in their sole discretion and not within our control.
We may issue additional shares of our common stock or instruments convertible into shares of our common stock, including in connection with the conversion of the Notes, and thereby materially and adversely affect the market price of our common stock and the trading prices of the Notes.
We are not restricted from issuing additional shares of our common stock or other instruments convertible into, or exchangeable or exercisable for, shares of our common stock during the life of each of the Notes. If we issue additional shares of our common stock or instruments convertible into shares of our common stock, it may materially and adversely affect the market price of our common stock and, in turn, the trading prices of the Notes. In addition, the conversion of some or all of the Notes may dilute the ownership interests of existing holders of our common stock, and any sales in the public market of any shares of our common stock issuable upon such conversion of the Notes could adversely affect prevailing market prices of our common stock. In addition, the anticipated conversion of the Notes could depress the market price of our common stock.
The fundamental change provisions of the Notes and the terms of the Bond Hedge and Warrants may delay or hinder an otherwise beneficial takeover attempt of us.
The fundamental change purchase rights allow holders of Notes to require us to purchase all or a portion of their Notes upon the occurrence of a fundamental change. The provisions of the indenture governing the Notes requiring an increase to the conversion rate for conversions in connection with a make-whole fundamental change, including certain corporate transactions such as a change in control, may result in a change in the value of the Notes. Additionally, upon certain change of control transactions, the offsetting Bond Hedge and Warrants that we entered into at the time we issued the Notes may be exercised and/or terminated early. As a result of these provisions, we may be required to make payments to, or renegotiate terms with, holders of the Notes and/or the hedge counterparties.
These features of the Notes and the Bond Hedge and Warrants, including the financial implications of any renegotiation of the above-mentioned provisions, could have the effect of delaying or preventing a change of control, whether or not it is desired by, or beneficial to, our stockholders, and may result in the acquisition of us being on terms less favorable to our stockholders than it would otherwise be, or could require us to pay a portion of the consideration available in such a transaction to holders of the Notes or Warrants or the counterparties to the Bond Hedge.
31
None.
As of February 2, 2019, we have approximately 1,467,000 leased gross square feet for 20 Design Galleries, 43 legacy Galleries, 2 RH Modern Galleries, 6 RH Baby & Child Galleries and 15 Waterworks showrooms throughout the United States and in the U.K. The initial lease term of our retail Galleries generally ranges from 10 to 15 years, and certain leases contain renewal options for up to an additional 25 years. We have approximately 1,213,000 leased gross square feet for 39 outlet stores that were open as of February 2, 2019.
Most leases for our retail Galleries and outlets provide for a minimum rent, typically including annual escalating rent increases. In addition, certain leases have a percentage rent based upon sales after minimum thresholds are achieved. Leases generally require us to pay insurance, utilities, real estate taxes, repair and maintenance expenses, and common area maintenance.
Leased Properties
The following table summarizes the location and size of our leased fulfillment centers and corporate facilities, as well as the size of our home delivery hubs, occupied as of February 2, 2019:
|
Location |
|
Leased Square Footage (Approximate) |
|
|
|
RH Furniture Fulfillment Centers |
|
|
|
|
|
Patterson, California |
|
|
1,501,000 |
|
|
Baltimore (North East), Maryland |
|
|
1,195,000 |
|
|
|
|
|
|
|
|
RH Small Parcel Fulfillment Center |
|
|
|
|
|
West Jefferson, Ohio (1) |
|
|
1,224,000 |
|
|
|
|
|
|
|
|
Waterworks Fulfillment Center |
|
|
|
|
|
Brookfield, Connecticut |
|
|
160,000 |
|
|
|
|
|
|
|
|
Home Delivery Hub Locations (2) |
|
|
1,455,000 |
|
|
|
|
|
|
|
|
Corporate Facilities |
|
|
|
|
|
Corte Madera, California (1) (3) |
|
|
257,000 |
|
|
Pinole, California (4) |
|
|
200,000 |
|
|
Danbury, Connecticut (5) |
|
|
41,000 |
|
|
Other |
|
|
18,000 |
|
|
(1) |
Customer service center operations are also performed at this location. |
|
(2) |
Includes total approximate leased square footage for 16 separate home delivery hub locations. |
|
(3) |
Location of RH Headquarters. Includes approximately 8,000 square feet of warehouse space. |
|
(4) |
Represents warehouse space. |
|
(5) |
Location of Waterworks Headquarters. |
Owned Properties
We currently own two properties, a 9,000 square foot property that is the location of our Gallery in San Francisco’s Design District, and a 18,000 square foot property that is the location of our Yountville Design Gallery. Both owned properties are part of our RH Segment. In addition, we currently own land in Edina, MN which we are developing for a future Design Gallery.
We believe that our current offices and facilities are in good condition, are being used productively and are adequate to meet our requirements for the foreseeable future.
32
From time to time, we and/or our management are involved in litigation, claims and other proceedings relating to the conduct of our business, including purported class action litigation, as well as securities class action litigation. Such legal proceedings may include claims related to our employment practices, wage and hour claims, claims of intellectual property infringement, including with respect to trademarks and trade dress, claims asserting unfair competition and unfair business practices, claims with respect to our collection and sale of reproduction products, and consumer class action claims relating to our consumer practices including the collection of zip code or other information from customers. In addition, from time to time, we are subject to product liability and personal injury claims for the products that we sell and the stores we operate. Subject to certain exceptions, our purchase orders generally require the vendor to indemnify us against any product liability claims; however, if the vendor does not have insurance or becomes insolvent, we may not be indemnified. In addition, we could face a wide variety of employee claims against us, including general discrimination, privacy, labor and employment, ERISA and disability claims. Any claims could result in litigation against us and could also result in regulatory proceedings being brought against us by various federal and state agencies that regulate our business, including the U.S. Equal Employment Opportunity Commission. Often these cases raise complex factual and legal issues, which are subject to risks and uncertainties and which could require significant management time. Litigation and other claims and regulatory proceedings against us could result in unexpected expenses and liability and could also materially adversely affect our operations and our reputation.
For additional information regarding certain securities litigation, refer to Note 19—Commitments and Contingencies in our consolidated financial statements within Part II of this Annual Report on Form 10-K.
Not applicable.
33
|
Item 5. |
Market For Registrant’s Common Equity, Related Stockholder Matters and Issuer Purchases of Equity Securities |
Market Information and Dividend Policy
Our common stock trades under the symbol “RH” on the NYSE.
The number of stockholders of record of our common stock as of February 2, 2019 was 21. This number excludes stockholders whose stock is held in nominee or street name by brokers.
No dividends have been declared or paid on our common stock. We do not currently anticipate that we will pay any cash dividends on our common stock in the foreseeable future.
34
This performance graph shall not be deemed “soliciting material” or to be “filed” with the SEC for purposes of Section 18 of the Securities Exchange Act of 1934, as amended (the “Exchange Act”), or otherwise subject to the liabilities under that Section, and shall not be deemed to be incorporated by reference into any filing of RH under the Securities Act of 1933, as amended, or the Exchange Act.
The following graph and table compare the cumulative total stockholder return for our common stock during the five-year period ended February 2, 2019 in comparison to the NYSE Composite Index and the S&P Retailing Select Index, our peer group index. The graph and the table below assume that $100 was invested at the market close on January 31, 2014 in the common stock of RH, the NYSE Composite Index and the S&P Retailing Select Index. Data for the NYSE Composite Index and the S&P Retailing Select Index assumes reinvestments of dividends. The comparisons in the graph and table are required by the SEC and are not intended to be indicative of possible future performance of our common stock.
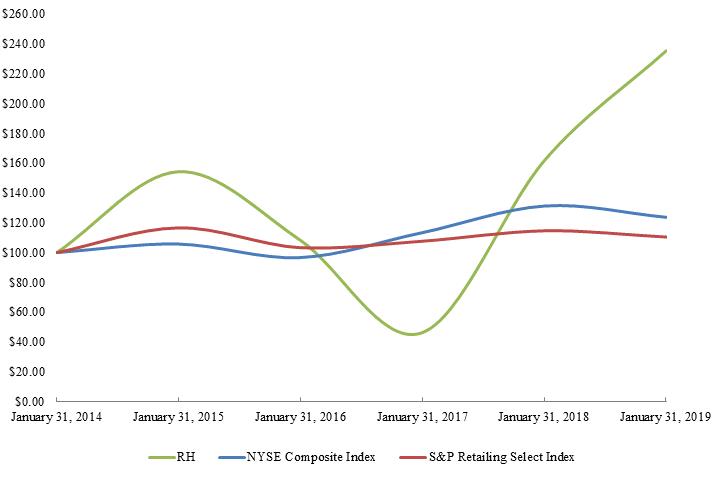
|
|
|
01/31/2014 |
|
|
1/30/2015 |
|
|
1/29/2016 |
|
|
01/27/2017 |
|
|
02/02/2018 |
|
|
02/01/2019 |
|
||||||
|
RH |
|
|
100.00 |
|
|
|
154.27 |
|
|
|
108.60 |
|
|
|
45.98 |
|
|
|
162.21 |
|
|
|
235.53 |
|
|
NYSE Composite Index |
|
|
100.00 |
|
|
|
105.71 |
|
|
|
96.64 |
|
|
|
113.20 |
|
|
|
131.28 |
|
|
|
123.70 |
|
|
S&P Retailing Select Index |
|
|
100.00 |
|
|
|
116.62 |
|
|
|
103.36 |
|
|
|
107.60 |
|
|
|
114.63 |
|
|
|
110.42 |
|
35
During the three months ended February 2, 2019, we repurchased the following shares of our common stock:
|
|
|
Number of Shares (1) |
|
|
Average Purchase Price Per Share |
|
|
Total Number of Shares Repurchased as Part of Publicly Announced Plans or Programs (2) |
|
|
Approximate Dollar Value of Shares That May Yet Be Purchased Under the Plans or Programs |
|
||||
|
|
|
|
|
|
|
|
|
|
|
|
|
|
|
(in millions) |
|
|
|
November 4, 2018 to December 1, 2018 |
|
|
— |
|
|
$ |
— |
|
|
|
— |
|
|
$ |
555 |
|
|
December 2, 2018 to January 5, 2019 |
|
|
891,129 |
|
|
$ |
118.25 |
|
|
|
886,700 |
|
|
$ |
450 |
|
|
January 6, 2019 to February 2, 2019 |
|
|
— |
|
|
$ |
— |
|
|
|
— |
|
|
$ |
450 |
|
|
Total |
|
|
891,129 |
|
|
|
|
|
|
|
886,700 |
|
|
|
|
|
|
(1) |
Includes shares withheld from delivery to satisfy exercise price and tax withholding obligations of employee recipients that occur upon the exercise of stock options and vesting of restricted stock units granted under the Company’s 2012 Stock Incentive Plan. There were 4,429 shares surrendered for this purpose during the three months ended February 2, 2019. |
|
(2) |
Reflects shares repurchased as part of the Fiscal 2018 $700 Million Repurchase Program authorized by the Board of Directors on October 10, 2018. |
The following tables present RH’s consolidated financial and operating data as of the dates and for the periods indicated. The selected consolidated financial data as of February 2, 2019 and February 3, 2018 and for the fiscal years ended February 2, 2019, February 3, 2018 and January 28, 2017 were derived from consolidated financial statements included in Item 8—Financial Statements and Supplementary Data. The selected consolidated financial data as of January 28, 2017 and as of and for the periods ended January 30, 2016 and January 31, 2015 were derived from consolidated financial statements for such years not included herein.
The fiscal years ended February 2, 2019, January 28, 2017, January 30, 2016 and January 31, 2015 each consisted of 52 weeks. The fiscal year ended February 3, 2018 consisted of 53 weeks.
36
The selected historical consolidated data presented below should be read in conjunction with Item 1A—Risk Factors, Item 7—Management’s Discussion and Analysis of Financial Condition and Results of Operations, our consolidated financial statements and the notes to our consolidated financial statements.
|
|
|
Year Ended |
|
|||||||||||||||||
|
|
|
February 2, |
|
|
February 3, |
|
|
January 28, |
|
|
January 30, |
|
|
January 31, |
|
|||||
|
|
|
2019 |
|
|
2018 |
|
|
2017 |
|
|
2016 |
|
|
2015 |
|
|||||
|
|
|
(dollars in thousands, except per share amounts) |
|
|||||||||||||||||
|
Consolidated Statements of Income: |
|
|
|
|
|
|
|
|
|
|
|
|
|
|
|
|
|
|
|
|
|
Net revenues |
|
$ |
2,505,653 |
|
|
$ |
2,440,174 |
|
|
$ |
2,134,871 |
|
|
$ |
2,109,006 |
|
|
$ |
1,867,422 |
|
|
Cost of goods sold |
|
|
1,504,806 |
|
|
|
1,591,107 |
|
|
|
1,455,084 |
|
|
|
1,356,314 |
|
|
|
1,176,648 |
|
|
Gross profit |
|
|
1,000,847 |
|
|
|
849,067 |
|
|
|
679,787 |
|
|
|
752,692 |
|
|
|
690,774 |
|
|
Selling, general and administrative expenses |
|
|
711,617 |
|
|
|
717,766 |
|
|
|
626,751 |
|
|
|
567,131 |
|
|
|
525,048 |
|
|
Income from operations |
|
|
289,230 |
|
|
|
131,301 |
|
|
|
53,036 |
|
|
|
185,561 |
|
|
|
165,726 |
|
|
Other expenses |
|
|
|
|
|
|
|
|
|
|
|
|
|
|
|
|
|
|
|
|
|
Interest expense—net |
|
|
75,074 |
|
|
|
62,570 |
|
|
|
44,482 |
|
|
|
35,677 |
|
|
|
17,551 |
|
|
Goodwill and tradename impairment |
|
|
32,086 |
|
|
|
33,700 |
|
|
|
— |
|
|
|
— |
|
|
|
— |
|
|
Loss on extinguishment of debt |
|
|
917 |
|
|
|
4,880 |
|
|
|
— |
|
|
|
— |
|
|
|
— |
|
|
Total other expenses |
|
|
108,077 |
|
|
|
101,150 |
|
|
|
44,482 |
|
|
|
35,677 |
|
|
|
17,551 |
|
|
Income before income taxes |
|
|
181,153 |
|
|
|
30,151 |
|
|
|
8,554 |
|
|
|
149,884 |
|
|
|
148,175 |
|
|
Income tax expense |
|
|
30,514 |
|
|
|
27,971 |
|
|
|
3,153 |
|
|
|
58,781 |
|
|
|
57,173 |
|
|
Net income |
|
$ |
150,639 |
|
|
$ |
2,180 |
|
|
$ |
5,401 |
|
|
$ |
91,103 |
|
|
$ |
91,002 |
|
|
Weighted-average shares used in computing basic net income per share |
|
|
21,613,678 |
|
|
|
27,053,616 |
|
|
|
40,691,483 |
|
|
|
40,190,448 |
|
|
|
39,457,491 |
|
|
Basic net income per share |
|
$ |
6.97 |
|
|
$ |
0.08 |
|
|
$ |
0.13 |
|
|
$ |
2.27 |
|
|
$ |
2.31 |
|
|
Weighted-average shares used in computing diluted net income per share |
|
|
26,533,225 |
|
|
|
29,253,208 |
|
|
|
40,926,840 |
|
|
|
42,256,559 |
|
|
|
41,378,210 |
|
|
Diluted net income per share |
|
$ |
5.68 |
|
|
$ |
0.07 |
|
|
$ |
0.13 |
|
|
$ |
2.16 |
|
|
$ |
2.20 |
|
|
Other Financial and Operating Data: |
|
|
|
|
|
|
|
|
|
|
|
|
|
|
|
|
|
|
|
|
|
Direct as a percentage of net revenues (1) |
|
|
44 |
% |
|
|
44 |
% |
|
|
45 |
% |
|
|
49 |
% |
|
|
50 |
% |
|
Growth in net revenues: |
|
|
|
|
|
|
|
|
|
|
|
|
|
|
|
|
|
|
|
|
|
Stores (2) |
|
|
3 |
% |
|
|
16 |
% |
|
|
9 |
% |
|
|
16 |
% |
|
|
14 |
% |
|
Direct (1) |
|
|
2 |
% |
|
|
12 |
% |
|
|
(7 |
)% |
|
|
10 |
% |
|
|
28 |
% |
|
Total |
|
|
3 |
% |
|
|
14 |
% |
|
|
1 |
% |
|
|
13 |
% |
|
|
20 |
% |
|
Comparable brand revenue growth (3) |
|
|
4 |
% |
|
|
6 |
% |
|
|
(7 |
)% |
|
|
11 |
% |
|
|
20 |
% |
|
Adjusted net income (4) |
|
$ |
223,694 |
|
|
$ |
89,200 |
|
|
$ |
51,789 |
|
|
$ |
114,772 |
|
|
$ |
97,636 |
|
|
Adjusted EBITDA (5) |
|
$ |
400,770 |
|
|
$ |
268,270 |
|
|
$ |
186,225 |
|
|
$ |
273,425 |
|
|
$ |
224,961 |
|
|
Capital expenditures (6) |
|
$ |
136,736 |
|
|
$ |
146,194 |
|
|
$ |
170,031 |
|
|
$ |
127,902 |
|
|
$ |
110,359 |
|
37
|
|
|
February 2, |
|
|
February 3, |
|
|
January 28, |
|
|
January 30, |
|
|
January 31, |
|
|||||
|
|
|
2019 |
|
|
2018 |
|
|
2017 |
|
|
2016 |
|
|
2015 |
|
|||||
|
|
|
(in thousands) |
|
|||||||||||||||||
|
Balance Sheet Data: |
|
|
|
|
|
|
|
|
|
|
|
|
|
|
|
|
|
|
|
|
|
Cash and cash equivalents |
|
$ |
5,803 |
|
|
$ |
17,907 |
|
|
$ |
87,023 |
|
|
$ |
331,467 |
|
|
$ |
145,686 |
|
|
Short-term and long-term investments (7) |
|
|
— |
|
|
|
— |
|
|
|
175,889 |
|
|
|
152,855 |
|
|
|
80,506 |
|
|
Working capital (8) |
|
|
110,276 |
|
|
|
132,098 |
|
|
|
722,355 |
|
|
|
861,304 |
|
|
|
540,299 |
|
|
Total assets |
|
|
1,806,034 |
|
|
|
1,732,866 |
|
|
|
2,192,520 |
|
|
|
2,067,944 |
|
|
|
1,522,036 |
|
|
Financing obligations under build-to-suit lease transactions |
|
|
228,928 |
|
|
|
229,323 |
|
|
|
203,015 |
|
|
|
146,621 |
|
|
|
124,770 |
|
|
Convertible senior notes due 2019—net (9) |
|
|
344,146 |
|
|
|
329,012 |
|
|
|
314,543 |
|
|
|
300,711 |
|
|
|
287,487 |
|
|
Convertible senior notes due 2020—net (9) |
|
|
272,919 |
|
|
|
255,865 |
|
|
|
239,876 |
|
|
|
224,887 |
|
|
|
— |
|
|
Convertible senior notes due 2023—net (9) |
|
|
253,689 |
|
|
|
— |
|
|
|
— |
|
|
|
— |
|
|
|
— |
|
|
Asset based credit facility |
|
|
57,500 |
|
|
|
199,970 |
|
|
|
— |
|
|
|
— |
|
|
|
— |
|
|
Term loan |
|
|
— |
|
|
|
80,000 |
|
|
|
— |
|
|
|
— |
|
|
|
— |
|
|
Equipment security notes |
|
|
— |
|
|
|
18,497 |
|
|
|
— |
|
|
|
— |
|
|
|
— |
|
|
Promissory note |
|
|
— |
|
|
|
13,183 |
|
|
|
— |
|
|
|
— |
|
|
|
— |
|
|
Notes payable for share repurchases |
|
|
19,633 |
|
|
|
19,390 |
|
|
|
19,390 |
|
|
|
19,523 |
|
|
|
19,523 |
|
|
Total debt (including current portion) (10) |
|
|
956,681 |
|
|
|
923,896 |
|
|
|
581,318 |
|
|
|
552,702 |
|
|
|
314,514 |
|
|
Total stockholders’ equity (deficit) |
|
|
(22,962 |
) |
|
|
(7,336 |
) |
|
|
919,869 |
|
|
|
886,160 |
|
|
|
702,916 |
|
|
(1) |
Direct net revenues include sales originating from our Source Books, websites, and phone orders, including our Contract business and a portion of our Trade business. |
|
(2) |
Stores data represents sales originating in retail stores, including Waterworks showrooms, and outlet stores. Net revenues for outlet stores, which include warehouse sales, were $179.0 million, $205.7 million, $144.6 million, $142.8 million and $121.6 million, for fiscal 2018, fiscal 2017, fiscal 2016, fiscal 2015 and fiscal 2014, respectively. |
|
(3) |
Comparable brand revenue growth includes direct net revenues and retail comparable store sales, including RH Baby & Child, RH Modern Galleries and RH Hospitality. Comparable brand revenue growth excludes retail non-comparable store sales, closed store sales and outlet net revenues. Comparable store sales have been calculated based upon retail stores, excluding outlet stores, that were open at least fourteen full months as of the end of the reporting period and did not change square footage by more than 20% between periods. If a store is closed for seven days during a month, that month will be excluded from comparable store sales. Membership revenue was included in comparable brand revenue growth beginning April 2017, which is the first full month following the one-year anniversary of the program launch. Waterworks revenue was included in comparable brand revenue growth beginning June 2017, which is the first full month following the one-year anniversary of the acquisition. The impact on net revenues related to the product recalls in fiscal 2018, fiscal 2017 and fiscal 2016 has been excluded from comparable brand revenue growth. Because fiscal 2017 was a 53-week year, comparable brand revenue growth percentage for fiscal 2017 excludes the extra week of revenue. |
|
(4) |
Adjusted net income is a supplemental measure of financial performance that is not required by, or presented in accordance with, generally accepted accounting principles (“GAAP”). We define adjusted net income as net income, adjusted for the impact of certain non-recurring and other items that we do not consider representative of our underlying operating performance. Adjusted net income is included in this filing because management believes that adjusted net income provides meaningful supplemental information for investors regarding the performance of our business and facilitates a meaningful evaluation of actual results on a comparable basis with historical results. Our management uses this non-GAAP financial measure in order to have comparable financial results to analyze changes in our underlying business from quarter to quarter. The following table presents a reconciliation of net income, the most directly comparable GAAP financial measure, to adjusted net income for the periods indicated below. |
38
|
|
|
Year Ended |
|
|||||||||||||||||
|
|
|
February 2, |
|
|
February 3, |
|
|
January 28, |
|
|
January 30, |
|
|
January 31, |
|
|||||
|
|
|
2019 |
|
|
2018 |
|
|
2017 |
|
|
2016 |
|
|
2015 |
|
|||||
|
|
|
(in thousands) |
|
|||||||||||||||||
|
Net income |
|
$ |
150,639 |
|
|
$ |
2,180 |
|
|
$ |
5,401 |
|
|
$ |
91,103 |
|
|
$ |
91,002 |
|
|
Adjustments pre-tax: |
|
|
|
|
|
|
|
|
|
|
|
|
|
|
|
|
|
|
|
|
|
Amortization of debt discount (a) |
|
|
39,216 |
|
|
|
27,926 |
|
|
|
26,404 |
|
|
|
19,803 |
|
|
|
6,852 |
|
|
Goodwill and tradename impairment (b) |
|
|
32,086 |
|
|
|
33,700 |
|
|
|
— |
|
|
|
— |
|
|
|
— |
|
|
Reorganization related costs (c) |
|
|
9,977 |
|
|
|
949 |
|
|
|
5,698 |
|
|
|
— |
|
|
|
— |
|
|
Asset impairment and lease losses (d) |
|
|
7,218 |
|
|
|
4,417 |
|
|
|
12,743 |
|
|
|
— |
|
|
|
— |
|
|
Distribution center closures (e) |
|
|
1,778 |
|
|
|
4,846 |
|
|
|
— |
|
|
|
— |
|
|
|
— |
|
|
Recall accrual (f) |
|
|
1,619 |
|
|
|
7,707 |
|
|
|
4,615 |
|
|
|
— |
|
|
|
— |
|
|
Loss on extinguishment of debt (g) |
|
|
917 |
|
|
|
4,880 |
|
|
|
— |
|
|
|
— |
|
|
|
— |
|
|
Impact of inventory step-up (h) |
|
|
380 |
|
|
|
2,527 |
|
|
|
6,835 |
|
|
|
— |
|
|
|
— |
|
|
Legal settlement (i) |
|
|
(5,289 |
) |
|
|
— |
|
|
|
— |
|
|
|
— |
|
|
|
— |
|
|
Non-cash compensation (j) |
|
|
— |
|
|
|
23,872 |
|
|
|
3,672 |
|
|
|
— |
|
|
|
— |
|
|
Anti-dumping exposure (k) |
|
|
— |
|
|
|
(2,202 |
) |
|
|
— |
|
|
|
— |
|
|
|
— |
|
|
Gain on sale of building and land (l) |
|
|
— |
|
|
|
(2,119 |
) |
|
|
— |
|
|
|
— |
|
|
|
— |
|
|
Legal claim (m) |
|
|
— |
|
|
|
— |
|
|
|
8,701 |
|
|
|
19,046 |
|
|
|
7,700 |
|
|
Aircraft impairment (n) |
|
|
— |
|
|
|
— |
|
|
|
4,767 |
|
|
|
— |
|
|
|
— |
|
|
Acquisition related costs (o) |
|
|
— |
|
|
|
— |
|
|
|
2,847 |
|
|
|
— |
|
|
|
— |
|
|
Subtotal adjusted items |
|
|
87,902 |
|
|
|
106,503 |
|
|
|
76,282 |
|
|
|
38,849 |
|
|
|
14,552 |
|
|
Impact of income tax items (p) |
|
|
(14,847 |
) |
|
|
(19,483 |
) |
|
|
(29,894 |
) |
|
|
(15,180 |
) |
|
|
(7,918 |
) |
|
Adjusted net income |
|
$ |
223,694 |
|
|
$ |
89,200 |
|
|
$ |
51,789 |
|
|
$ |
114,772 |
|
|
$ |
97,636 |
|
|
|
(a) |
Under GAAP, certain convertible debt instruments that may be settled in cash on conversion are required to be separately accounted for as liability and equity components of the instrument in a manner that reflects the issuer’s non-convertible debt borrowing rate. Accordingly, in accounting for GAAP purposes for the $350 million aggregate principal amount of convertible senior notes that were issued in June 2014 (the “2019 Notes”), for the $300 million aggregate principal amount of convertible senior notes that were issued in June and July 2015 (the “2020 Notes”) and for the $335 million aggregate principal amount of convertible senior notes that were issued in June 2018 (the “2023 Notes”), we separated the 2019 Notes, 2020 Notes and 2023 Notes into liability (debt) and equity (conversion option) components and we are amortizing as debt discount an amount equal to the fair value of the equity components as interest expense on the 2019 Notes, 2020 Notes and 2023 Notes over their expected lives. The equity components represent the difference between the proceeds from the issuance of the 2019 Notes, 2020 Notes and 2023 Notes and the fair value of the liability components of the 2019 Notes, 2020 Notes and 2023 Notes, respectively. Amounts are presented net of interest capitalized for capital projects of $2.7 million, $2.5 million, $2.4 million, $2.3 million and $1.1 million during fiscal 2018, fiscal 2017, fiscal 2016, fiscal 2015 and fiscal 2014, respectively. |
|
|
(b) |
Represents goodwill and tradename impairment related to the Waterworks reporting unit. Refer to “Impairment” within Note 3—Significant Accounting Policies in our consolidated financial statements. |
|
|
(c) |
Fiscal 2018 represents severance costs and related taxes associated with reorganizations, including severance related to the closure of the Essex, MD distribution center. Fiscal 2017 represents severance costs and related taxes related to the closure of the Mira Loma, CA and Dallas, TX distribution centers, as well as the closure of the Dallas customer call center. Fiscal 2016 represents severance costs and related taxes associated with a reorganization. The fiscal 2017 and fiscal 2016 expense is partially offset by a reversal of stock-based compensation expense related to unvested equity awards. |
|
|
(d) |
Fiscal 2016 represents the impairment associated with RH Contemporary Art, which was integrated into the broader RH platform and no longer operates as a separate division. In fiscal 2016, this resulted in cost of goods sold of $1.1 million which represented impairment of inventory, and selling, general and administrative expenses of $10.6 million which represented lease related charges, property and equipment disposals, and donations. In fiscal 2017 and fiscal 2018, additional lease related charges of $4.4 million and $3.4 million, respectively, were recorded to selling, general and administrative expenses due to the remeasurement of the lease loss liability for RH Contemporary Art resulting from an update to both the timing and the amount of future estimated lease related cash inflows. The fiscal 2018 adjustment also includes accelerated depreciation expense of $2.6 million due to a change in the estimated useful life of certain assets and a $1.2 million inventory impairment charge related to holiday merchandise, both of which were recorded in cost of goods sold. Fiscal 2016 also includes a $1.0 million inventory impairment charge recorded to cost of goods sold associated with RH Kitchen due to the alignment with the Waterworks Kitchen product line strategy. |
39
|
|
(e) |
Represents disposals of inventory and property and equipment, lease related charges, inventory transfer costs and other costs associated with distribution center closures. |
|
|
(f) |
Represents a reduction in net revenues, impact on cost of goods sold, as well as accrual adjustments and insurance recoveries related to certain product recalls. Product recalls had the following effect on our income before income taxes: |
|
|
|
Year Ended |
|
|||||||||
|
|
|
February 2, |
|
|
February 3, |
|
|
January 28, |
|
|||
|
|
|
2019 |
|
|
2018 |
|
|
2017 |
|
|||
|
|
|
(in thousands) |
|
|||||||||
|
Reduction of net revenues |
|
$ |
4,733 |
|
|
$ |
3,207 |
|
|
$ |
3,441 |
|
|
Impact on cost of goods sold |
|
|
(4,139 |
) |
|
|
4,315 |
|
|
|
535 |
|
|
Impact on gross profit |
|
|
594 |
|
|
|
7,522 |
|
|
|
3,976 |
|
|
Incremental selling, general and administrative expenses |
|
|
1,025 |
|
|
|
185 |
|
|
|
639 |
|
|
Impact on income before income taxes |
|
$ |
1,619 |
|
|
$ |
7,707 |
|
|
$ |
4,615 |
|
|
|
(g) |
Represents the loss on extinguishment of debt related to the LILO term loan, the promissory note secured by our aircraft and the equipment security notes, all of which were repaid in full in June 2018, as well as the second lien term loan which was repaid in full in October 2017. |
|
|
(h) |
Represents the non-cash amortization of the inventory fair value adjustment recorded in connection with our acquisition of Waterworks. |
|
|
(i) |
Represents a favorable legal settlement, net of related legal expenses. |
|
|
(j) |
The adjustment for fiscal 2017 represents a non-cash compensation charge related to a fully vested option grant made to Mr. Friedman in May 2017. The adjustment for fiscal 2016 represents a non-cash compensation charge related to the fully vested option grants made in connection with our acquisition of Waterworks. |
|
|
(k) |
Represents the release of the remaining reserve for potential claims regarding anti-dumping duties which we believe have lapsed. The reserve related to potential tariff obligations of one of our foreign suppliers following the U.S. Department of Commerce’s review on the anti-dumping duty order on wooden bedroom furniture from China for the period from January 1, 2011 through December 31, 2011. |
|
|
(l) |
Represents the gain on the sale of building and land of one of our previously owned retail Galleries. |
|
|
(m) |
Represents charges incurred or the estimated cumulative impact of coupons redeemed in connection with a legal claim alleging that the Company violated California’s Song-Beverly Credit Card Act of 1971 by requesting and recording ZIP codes from customers paying with credit cards. |
|
|
(n) |
Represents the impairment recorded upon reclassification of aircraft as asset held for sale. |
|
|
(o) |
Represents costs incurred in connection with our acquisition of Waterworks including professional fees. |
|
|
(p) |
The adjustment for fiscal 2018 is based on an adjusted tax rate of 16.9%, which is calculated based on the weighted-average fiscal 2018 quarterly adjusted pro forma tax rates and excludes a $3.6 million tax impact associated with the Waterworks reporting unit goodwill impairment. The adjustment for fiscal 2017 is based on an adjusted tax rate of 34.7%, which is calculated based on the weighted-average fiscal 2017 quarterly adjusted pro forma tax rates and excludes the impact of tax reform, including the $6.0 million revaluation of the net deferred tax assets and $1.0 million transitional tax, as well as the $5.9 million tax impact associated with the Waterworks reporting unit goodwill impairment. Fiscal 2016 assumes a normalized tax rate of 39%. The adjustment for fiscal 2015 represents the tax effect of the adjusted items based on our effective tax rate of 39.2%. Fiscal 2014 assumes a normalized tax rate of 40%. |
|
(5) |
EBITDA and Adjusted EBITDA are supplemental measures of financial performance that are not required by, or presented in accordance with, GAAP. We define EBITDA as consolidated net income before depreciation and amortization, interest expense, goodwill and tradename impairment, loss on extinguishment of debt and provision for income taxes. Adjusted EBITDA reflects further adjustments to EBITDA to eliminate the impact of non-cash compensation, as well as certain non-recurring and other items that we do not consider representative of our underlying operating performance. EBITDA and Adjusted EBITDA are included in this filing because management believes that these metrics provide meaningful supplemental information for investors regarding the performance of our business and facilitate a meaningful evaluation of operating results on a comparable basis with historical results. Our management uses this non-GAAP financial measure in order to have comparable financial results to analyze changes in our underlying business from quarter to quarter. Our measures of EBITDA and Adjusted EBITDA are not necessarily comparable to other similarly titled captions for other companies due to different methods of calculation. The following table presents a reconciliation of net income, the most directly comparable GAAP financial measure, to EBITDA and Adjusted EBITDA for the periods indicated below. |
40
|
|
|
Year Ended |
|
|||||||||||||||||
|
|
|
February 2, |
|
|
February 3, |
|
|
January 28, |
|
|
January 30, |
|
|
January 31, |
|
|||||
|
|
|
2019 |
|
|
2018 |
|
|
2017 |
|
|
2016 |
|
|
2015 |
|
|||||
|
|
|
(in thousands) |
|
|||||||||||||||||
|
Net income |
|
$ |
150,639 |
|
|
$ |
2,180 |
|
|
$ |
5,401 |
|
|
$ |
91,103 |
|
|
$ |
91,002 |
|
|
Depreciation and amortization |
|
|
74,346 |
|
|
|
70,135 |
|
|
|
56,995 |
|
|
|
44,595 |
|
|
|
34,463 |
|
|
Interest expense—net |
|
|
75,074 |
|
|
|
62,570 |
|
|
|
44,482 |
|
|
|
35,677 |
|
|
|
17,551 |
|
|
Goodwill and tradename impairment (a) |
|
|
32,086 |
|
|
|
33,700 |
|
|
|
— |
|
|
|
— |
|
|
|
— |
|
|
Loss on extinguishment of debt (a) |
|
|
917 |
|
|
|
4,880 |
|
|
|
— |
|
|
|
— |
|
|
|
— |
|
|
Income tax expense |
|
|
30,514 |
|
|
|
27,971 |
|
|
|
3,153 |
|
|
|
58,781 |
|
|
|
57,173 |
|
|
EBITDA |
|
|
363,576 |
|
|
|
201,436 |
|
|
|
110,031 |
|
|
|
230,156 |
|
|
|
200,189 |
|
|
Non-cash compensation (b) |
|
|
24,122 |
|
|
|
50,709 |
|
|
|
29,988 |
|
|
|
24,223 |
|
|
|
17,072 |
|
|
Reorganization related costs (a) |
|
|
9,977 |
|
|
|
949 |
|
|
|
5,698 |
|
|
|
— |
|
|
|
— |
|
|
Asset impairment and lease losses (a) |
|
|
4,607 |
|
|
|
4,417 |
|
|
|
12,743 |
|
|
|
— |
|
|
|
— |
|
|
Distribution center closures (a) |
|
|
1,778 |
|
|
|
4,846 |
|
|
|
— |
|
|
|
— |
|
|
|
— |
|
|
Recall accrual (a) |
|
|
1,619 |
|
|
|
7,707 |
|
|
|
4,615 |
|
|
|
— |
|
|
|
— |
|
|
Impact of inventory step-up (a) |
|
|
380 |
|
|
|
2,527 |
|
|
|
6,835 |
|
|
|
— |
|
|
|
— |
|
|
Legal settlement (a) |
|
|
(5,289 |
) |
|
|
— |
|
|
|
— |
|
|
|
— |
|
|
|
— |
|
|
Anti-dumping exposure (a) |
|
|
— |
|
|
|
(2,202 |
) |
|
|
— |
|
|
|
— |
|
|
|
— |
|
|
Gain on sale of building and land (a) |
|
|
— |
|
|
|
(2,119 |
) |
|
|
— |
|
|
|
— |
|
|
|
— |
|
|
Legal claim (a) |
|
|
— |
|
|
|
— |
|
|
|
8,701 |
|
|
|
19,046 |
|
|
|
7,700 |
|
|
Aircraft impairment (a) |
|
|
— |
|
|
|
— |
|
|
|
4,767 |
|
|
|
— |
|
|
|
— |
|
|
Acquisition related costs (a) |
|
|
— |
|
|
|
— |
|
|
|
2,847 |
|
|
|
— |
|
|
|
— |
|
|
Adjusted EBITDA |
|
$ |
400,770 |
|
|
$ |
268,270 |
|
|
$ |
186,225 |
|
|
$ |
273,425 |
|
|
$ |
224,961 |
|
|
|
(a) |
Refer to the reconciliation of net income to adjusted net income table above and the related footnotes for additional information. |
|
|
(b) |
Represents non-cash compensation related to equity awards granted to employees, including the non-cash compensation charge related to a fully vested option grant made to Mr. Friedman in May 2017 and a non-cash compensation charge related to the fully vested option grants made in connection with our acquisition of Waterworks in fiscal 2016. |
|
(6) |
Capital expenditures include the acquisition of buildings and land of $14.0 million in fiscal 2015. |
|
(7) |
As of the year ended fiscal 2016, fiscal 2015 and fiscal 2014, $142.7 million, $130.8 million and $62.2 million, respectively, of our investments were due within one year. As of the year ended fiscal 2016, fiscal 2015 and fiscal 2014, $33.2 million, $22.1 million and $18.3 million, respectively, of our investments were due within two years. We held no investments as of fiscal 2018 or fiscal 2017. |
|
(8) |
Working capital is defined as current assets, less current liabilities, excluding the current portion of long-term debt. |
|
(9) |
Represents our obligations, net of debt discount, related to the 2019 Notes, 2020 Notes and 2023 Notes. The aggregate principal amounts due under the 2019 Notes, 2020 Notes and 2023 Notes are $350 million, $300 million and $335 million, respectively. |
|
(10) |
Total debt (including current portion) includes the 2019 Notes, 2020 Notes and 2023 Notes, net of debt discount, asset based credit facility, term loan, equipment security notes, aircraft promissory note, notes payable for share repurchases and capital lease obligations, and excludes financing obligations under build-to-suit lease transactions. |
41
Overview
We are a leading luxury retailer in the home furnishings marketplace. Our curated and fully-integrated assortments are presented consistently across our sales channels in sophisticated and unique lifestyle settings that we believe are on par with world-class interior designers. We offer dominant merchandise assortments across a growing number of categories, including furniture, lighting, textiles, bathware, décor, outdoor and garden, and child and teen furnishings. We position our Galleries as showrooms for our brand, while our Source Books and websites act as virtual extensions of our stores. In 2015 we began to introduce an integrated hospitality experience, including cafés, wine vaults and barista bars, into a number of our new Gallery locations. We believe this has created a unique new retail experience that cannot be replicated online, and that the addition of hospitality is helping to drive incremental sales of home furnishings in these Galleries.
Our business is fully integrated across our multiple channels of distribution, consisting of our stores, Source Books and websites. As of February 2, 2019, we operated a total of 86 retail Galleries, consisting of 20 Design Galleries, 43 legacy Galleries, 2 RH Modern Galleries and 6 RH Baby & Child Galleries throughout the United States and Canada, and 15 Waterworks showrooms throughout the United States and in the U.K. As of February 2, 2019, 6 of our Design Galleries include an integrated RH Hospitality experience and we plan to incorporate hospitality, including cafés, wine vaults and barista bars in many of the new Galleries that we open in the future. As of February 2, 2019, we operated 39 outlet stores throughout the United States and Canada.
Key Value Driving Strategies
In order to drive growth across our business, we are focused on the following long-term key strategies:
|
|
• |
Transform Our Real Estate Platform. We believe we have an opportunity to significantly increase our sales by transforming our real estate platform from our existing legacy retail footprint to a portfolio of Design Galleries that are sized to the potential of each market and the size of our assortment. |
New Design Gallery sites are identified based on a variety of factors, such as the availability of suitable new site locations based on several store specific aspects including geographic location, demographics, and proximity to affluent consumers, and the negotiation of favorable economic terms to us for the new location, as well as satisfactory and timely completion of real estate development including procurement of permits and completion of construction. Based on our analysis, we believe we have the opportunity to operate Design Galleries in 60 to 70 locations in the United States and Canada. The number of Design Galleries we open in any fiscal year is highly dependent upon these variables and individual new Design Galleries may be subject to delay or postponement depending on the circumstances of specific projects.
We opened our Portland Design Gallery in March 2018, our Nashville Design Gallery in June 2018, as well as our New York Design Gallery and our Design Gallery in Yountville, California in the Napa Valley, in September 2018. Our Galleries in Nashville, New York and Yountville include integrated cafés, wine vaults and barista bars.
We have identified key learnings from our real estate transformation that have supported the development of a new multi-tier market approach that we believe will optimize both market share and return on invested capital.
First, we have developed a new RH prototype Design Gallery that is an innovative and flexible blueprint which we believe will enable us to more quickly place our disruptive product assortment and immersive retail experience into the market. The new model is a standard we will utilize in the future that is based on key learnings from our recent Gallery openings and will range in size from 33,000 leased selling square feet inclusive of our integrated hospitality experience to 29,000 leased selling square feet without. These new Galleries will represent our assortments from RH Interiors, Modern, Baby & Child, Teen and Outdoor and contain interior design offices and presentation rooms where design professionals can work with clients on their projects. Due to the reduced square footage compared to our recent Design Gallery openings and efficient design, this new model will be more capital efficient with less time and cost risk, but yield similar productivity. We anticipate the new prototype Design Galleries will represent approximately two thirds of our target markets. Future prototype location examples include Edina, MN, Corte Madera, CA, Columbus, OH and Charlotte, NC.
Second, we will continue to develop and open larger Bespoke Design Galleries in the top metropolitan markets, similar to those we opened in New York and Chicago. These iconic locations are highly profitable statements for our brand, and we believe they create a long-term competitive advantage that will be difficult to duplicate.
Third, we will continue to open indigenous Bespoke Galleries in the best second home markets where the wealthy and affluent visit and vacation. These Galleries are tailored to reflect the local culture and are sized to the potential of each market. Examples of indigenous Bespoke Galleries include the Hamptons, Palm Beach, Yountville and Aspen.
42
Fourth, we are developing a new Gallery model tailored to secondary markets. Targeted to be 10,000 to 18,000 square feet, we believe these smaller expressions of our brand will enable us to gain share in markets currently only served by smaller competitors. Examples of target secondary markets include Hartford, CT, Oklahoma City, OK and Milwaukee, WI, among others. We expect these Galleries to require a substantially smaller net investment than our larger Design Galleries and to pay back our capital investment within two years in most instances. Our plan is to test a few of these Galleries over the next several years, and if proven successful, this format could lead to an increase in our long-term Gallery targets.
We believe our multi-tier market approach to transforming our real estate will enable us to ramp our opening cadence from 3 to 5 new Galleries per year, to a pace of 5 to 7 new Galleries per year.
We continue to evaluate potential opportunities for standalone RH Baby & Child, RH Teen and RH Modern Galleries in select markets.
Like our evolving multi-tier Gallery strategy, we have developed a multi-tier real estate strategy that is designed to significantly increase our unit level profitability and return on invested capital. Our three primary deal constructs are outlined below:
|
|
• |
First, due to the productivity and proof of concept of our recent new Galleries, and the addition of a powerful, traffic-generating hospitality experience, we are able to negotiate “capital light” leasing deals, where as much as 65% to 100% of the capital requirement would be funded by the landlord, versus 35% to 50% previously. We currently have 15 potential capital light deals in the development pipeline that would be scheduled to open in fiscal 2019 and beyond. |
|
|
• |
Second, in several of our current projects, we are migrating from a leasing to a development model. We currently have two Galleries, Yountville and Edina, using this new model, and have an additional four potential development projects in the pipeline. In the case of Yountville and Edina, we expect to complete a sale-leaseback that should allow us to recoup all or a large portion of our capital. In some cases we believe we may be able to pre-sell the property and structure the transaction where the capital to build the project is advanced by the buyer during construction, which could require zero upfront capital from us. |
|
|
• |
Third, we are working on joint venture projects, where we share the upside of a development with the developer/landlord. An example of this new model would be our future Gallery and Guesthouse in Aspen, where we are contributing the value of our lease to the development in exchange for a profits interest in the project. The developer will deliver to RH a substantially turnkey Gallery and Guesthouse, while we continue to retain a 20% and 25% profits interest in the properties, respectively. We would expect to monetize the profits interest at the time of sale of the properties during the first five years. The net result should be a minimal capital investment to operationalize the business, with the expectation for a net positive capital benefit at time of monetization of the profits interest. |
We anticipate that all of the above deal structures should lead to lower capital requirements, higher unit profitability, and significantly higher return on invested capital versus our prior Gallery development strategies.
|
|
• |
Expand Our Offering and Increase Our Market Share. We believe we have a significant opportunity to increase our market share by: |
|
|
• |
transforming our real estate platform; |
|
|
• |
growing our merchandise assortment and introducing new products and categories; |
|
|
• |
expanding our service offerings, including design services and cafes, wine vaults and coffee bars at our Design Galleries; |
43
|
|
• |
increasing our brand awareness and customer loyalty through our Source Book circulation strategy, membership program, our digital marketing initiatives, advertising, and public relations activities and events. |
During fiscal 2017 and fiscal 2018 we deferred the introduction of major new product category expansions other than the ongoing development of RH Hospitality in conjunction with new Design Galleries. We plan a return to our product and business expansion strategy in fiscal 2019, which has been on hold as we focus on the architecture of a new operating platform.
We also plan to increase our investment in RH Interior Design in fiscal 2019 with a goal of building the leading interior design firm in North America. We believe there is a significant revenue opportunity by offering world class design and installation services as we move the brand beyond creating and selling products, to conceptualizing and selling spaces.
|
|
• |
Architect New Operating Platform. We have spent the last three years architecting a new operating platform, inclusive of transitioning from a promotional to membership model, our distribution center network redesign, the redesign of our reverse logistics and outlet business, and the reconceptualization of our home delivery and customer experience, enable us to drive lower costs and inventory levels, and higher earnings and inventory turns. Looking forward, we expect this multi-year effort to result in a dramatically improved customer experience, continued margin enhancement and significant cost savings over the next several years. |
|
|
• |
Maximize Cash Flow and Optimize the Allocation of Capital in the Business. In fiscal 2017 and 2018, we have focused on maximizing cash flow in our business and the allocation of capital. We believe that our operations and current initiatives are providing a significant opportunity to optimize the allocation of capital in our business, including generating free cash flow and optimizing our balance sheet, as well as deploying capital to repay debt and repurchase shares of our common stock, which we believe creates a long term benefit to our shareholders. |
In October 2018, our Board of Directors approved a share repurchase program, in an aggregate amount of $700 million of which (x) $250.0 million in share repurchases were completed in fiscal 2018, and (y) the $700 million authorization amount was replenished by the Board of Directors in March, 2019. During fiscal 2018 we repurchased approximately 2.0 million shares of our common stock pursuant to this repurchase program which represented 10% of the shares outstanding as of the end of fiscal 2017. During fiscal 2017, we repurchased approximately 20.2 million shares of our common stock under two separate repurchase programs for an aggregate repurchase amount of approximately $1 billion. This represented 50% of the shares outstanding as of the end of fiscal 2016. Our focus on cash also resulted in our generating $163 million and $415 million in free cash flow in fiscal 2018 and fiscal 2017, respectively (refer to “Share Repurchase Programs” below for our free cash flow calculation).
|
|
• |
Increase Operating Margins. During the period from fiscal 2016 through fiscal 2018, we have substantially increased the operating margins in our business. We anticipate continued improvements in operating margins as a result of our focus on a number of our strategic initiatives including (i) the occupancy leverage we expect to gain from our real estate transformation, (ii) product margin expansion as we continue to drive higher full price selling in our core business, and (iii) the continued cost savings of improvements to our operating platform and organizational structure. |
Business Initiatives
We are undertaking a large number of new business initiatives in support of our key value driving strategies. In particular, during fiscal 2016 through fiscal 2018, we have pursued a range of strategic efforts to improve our business and operations including the following:
|
|
• |
Introduction of Membership Model. In March 2016, we introduced the RH Members Program, an exclusive membership model that reimagines and simplifies the shopping experience. For an annual fee, the RH Members Program provides a set discount every day across all RH brands in addition to other benefits including complimentary interior design services through the RH Interior Design program and eligibility for preferred financing plans on the RH Credit Card, among others. We believe that transitioning our business from a promotional to membership model has enhanced our brand, simplified and streamlined our business as well as allowed us to develop deeper connections with our customers. |
|
|
• |
For the year ended February 2, 2019, our members drove approximately 95% of sales in our core RH business, and we had approximately 418,000 members at year end. Our core RH business reflects the product categories that the membership discount can be applied to, and as a result sales generated via Outlet, Contract, Hospitality or Waterworks are excluded. |
|
|
• |
We believe that the shift to a membership model has positively affected the financial results of our business. Specifically, we believe some of the benefits include: |
44
Improved customer experience. Our interior design professionals can now work with customers based on their timeline and project deadlines, as opposed to our prior promotional calendar. We believe this will lead to larger overall sales transactions for individual customer design projects.
Lower cancellations and returns. As a result of the elimination of time-limited promotional events and the associated pressure of placing an order before a promotion expires, we believe the shift to a membership model has also resulted lower rates of cancelled orders and returns.
Improved operational costs. The volume of sales, orders and shipments in our business under the prior promotional model was characterized by large spikes in customer orders based upon promotional events followed by lower orders and sales after the end of an event. This buying pattern also affected numerous other aspects of our business, including staffing and costs as we required elevated staffing levels to service the increased number of customers during peak sales events. Likewise, significant fluctuations in sales had downstream implications for our supply chain related to merchandise orders, manufacturing and production, shipment to our distribution centers and final delivery to our customers. All of these aspects of our operations are experiencing improved efficiencies as a result of the membership model whereby sales are more evenly distributed throughout the year as opposed to the peaks and valleys of orders and sales under the prior model.
|
|
• |
Distribution Center Network Redesign. As a result of our work to redesign our distribution network and optimize inventory, in fiscal 2017 we were able to forego building a fifth furniture distribution center planned to open and consolidate our current furniture distribution center network from four primary locations to two primary locations (Northern California and Baltimore, Maryland area). In fiscal 2017, we completed the closure of our furniture distribution centers in Los Angeles and Dallas, eliminating 1.75 million square feet of distribution center space, resulting in savings in excess of $20 million annually. In fiscal 2018, we completed the closure of a smaller furniture distribution center in Essex, Maryland, eliminating 500,000 square feet of distribution center space, resulting in savings in excess of $5 million annually. We believe managing our business in fewer facilities while decreasing our on-hand inventory will reduce fulfillment complexity, lower inventory transfer costs, increase inventory turns, improve working capital and should result in higher gross margins over time. |
|
|
• |
Reconceptualize Reverse Logistics Business. In fiscal 2017, we implemented initiatives to re-conceptualize our Outlet and reverse logistics business. Previously, returns of furniture would be transferred via our home delivery hubs back to a furniture distribution center, then eventually to one of our Outlet locations. Now, returns of furniture are transferred directly from our home delivery hubs to Outlets, which has reduced transportation and handling costs, and improved selling margins across our Outlet network. We believe this initiative yielded substantial savings and margin enhancement of approximately $20 million annually. |
|
|
• |
Luxury In-Home Furniture Delivery Experience. We believe there is an opportunity to improve the customer experience by taking greater control of the final mile in-home delivery. While we have in-sourced the majority of our home delivery hub facilities, we continue to use third-party providers for furniture delivery into our customer’s home. We believe that many third-party furniture delivery providers are designed to support mass and mid-market companies and that significant opportunity exists for developing improved solutions for the luxury market. We have achieved significant scale such that we can now explore and test alternative solutions in certain markets, including the use of our own trucks and drivers, and believe we can dramatically enhance the customer experience while driving down return rates, damages and deliveries per order. |
|
|
• |
Development and Refinement of Hospitality Experience. In 2015 we began to introduce an integrated hospitality experience, including cafés, wine vaults and barista bars, into a number of our new Gallery locations. The success of our initial hospitality offering in Chicago led us to broaden this initiative by adding hospitality to a number of our other new Gallery locations. We believe this has created a unique new retail experience that cannot be replicated online, and that the addition of hospitality is helping to drive incremental sales of home furnishings in these Galleries. |
45
|
|
currently exploring opportunities for Design Galleries in several locations outside the United States, including the United Kingdom and Europe. |
We continue to pursue and test numerous initiatives to improve many aspects of our business including through efforts to optimize inventory, elevate the home delivery experience, simplify our distribution network and improve our organizational design including by streamlining and realigning our home office operations, as well as to expand our product offering and transform our real estate using a range of different models for specific real estate development projects. There can be no assurance as to the timing and extent of the operational benefits and financial contributions of these strategic efforts. In addition, our pursuit of multiple initiatives with respect to our business in any given period may result in period-to-period changes in, and increased fluctuation in, our results of operations. For example, our efforts to optimize our distribution network could cause us to incur costs and expenses in the short term with respect to changes in the way in which we operate our business. Delays in completion of our real estate development projects or costs overruns could also negatively affect our results of operation. Further, macroeconomic or political events outside of our control could impact our ability to pursue our initiatives or the success of such initiatives. For example, in recent periods the stock market has experienced significant volatility as well as periods of significant decline, which may negatively affect the financial health and demand levels of high-end consumers. The housing market is affected by a range of factors including home prices and interest rates and slowdowns in the housing market can have a negative impact on demand for our products. Factors that affect the higher end housing market in particular may have an outsized influence on our levels of consumer demand since our business is geared toward the higher end of the home furnishings market. The above factors and other current and future operational initiatives may create additional uncertainty with respect to our consolidated net revenues and profit in the near term.
Factors Affecting Our Results of Operations
Various factors affected our results for the periods presented in this “Management’s Discussion and Analysis of Financial Condition and Results of Operations,” and such discussion generally lists the factors in order of magnitude based on their impact. The below are certain factors that affect our results of operations:
Our Strategic Initiatives. We are in the process of implementing a number of significant business initiatives that have had and will continue to have an impact on our results of operations, including:
|
|
• |
the introduction and expansion of new product categories and services; |
|
|
• |
the timing and progress of the opening of new Design Galleries that are under development; |
|
|
• |
the pursuit of our multi-tier market approach to our real estate transformation; |
|
|
• |
the redesign of our distribution center network; |
|
|
• |
the introduction of an integrated hospitality experience, including the roll out of an integrated food and beverage experience in a number of our new Design Galleries; |
|
|
• |
changes in our Source Book circulation strategy including the depth, frequency and timing of mailings as well as the scope of product offerings displayed in our Source Books; |
|
|
• |
changes in the overall opening cadence for new Galleries; |
|
|
• |
changes in our reverse logistics model resulting in transferring customer returns direct from our home delivery hubs to Outlets; |
|
|
• |
efforts to elevate the customer experience including architecting a new fully integrated back-end operating platform, inclusive of the supply chain network, the home delivery experience as well as a new metric driven quality system and company-wide decision data, vendor product initiatives and changes to the way we operate our distribution centers, home delivery hubs and customer service centers; and |
|
|
• |
leveraging the above strategic initiatives across both our RH Segment and Waterworks to drive the performance of each business. |
As a result of the number of current business initiatives we are pursuing, we have experienced in the past and may experience in the future significant period-to-period variability in our financial performance and results of operations. While we anticipate that these initiatives will support the growth of our business, costs and timing issues associated with pursuing these initiatives can negatively affect our growth rates in the short term and may amplify fluctuations in our growth rates from quarter to quarter. In addition, we anticipate that our net revenues, adjusted net income and other performance metrics will remain variable as our business model continues to emphasize high growth and numerous, concurrent and evolving business initiatives.
46
Our Ability to Source and Distribute Products Effectively. Our net revenues and gross profit are affected by our ability to purchase our merchandise in sufficient quantities at competitive prices. Our current and anticipated demand, and our level of net revenues have been adversely affected in prior periods by constraints in our supply chain, including the inability of our vendors to produce sufficient quantities of some merchandise in a manner that was able to match market demand from our customers, leading to higher levels of customer back orders and lost sales. For example, some of our vendors experienced difficulty in producing goods in sufficient quantity to meet initial customer demand for RH Modern when it was launched in October 2015.
Consumer Preferences and Demand. Our ability to maintain our appeal to existing customers and attract new customers depends on our ability to originate, develop and offer a compelling product assortment responsive to customer preferences and design trends. We have successfully introduced a large number of new products in past periods, which we believe has been a contributing factor in our sales growth and results of operations. Periods in which our products have achieved strong customer acceptance generally have had more favorable results. If we misjudge the market for our products or the product lines that we acquire, we may be faced with excess inventories for some products and may be required to become more promotional in our selling activities, which would impact our net revenues and gross profit.
Overall Economic Trends. The industry in which we operate is cyclical, and consequently our net revenues are affected by general economic conditions including conditions that affect the housing market. We target consumers of high-end home furnishings. As a result, we believe that our sales are sensitive to a number of macroeconomic factors that influence consumer spending generally, but that our sales are particularly affected by the health of the higher end customer and demand levels from that customer demographic. While the overall home furnishings market may be influenced by factors such as employment levels, interest rates, demographics of new household formation and the affordability of homes for the first time home buyer, the higher end of the housing market may be disproportionately influenced by other factors, including stock market prices, the number of second and third homes being bought and sold, the number of foreign buyers in higher end real estate markets in the U.S., tax policies and interest rates, and the perceived prospect for capital appreciation in higher end real estate. We have in the past experienced volatility in our sales trends related to many of these factors and believe our sales may be impacted by these economic factors in future periods. Additionally, we have seen a weakness in consumer spending at the luxury end of the retail market. These headwinds tied to macroeconomic factors may continue in future quarters. For more information, refer to Item 1A—Risk Factors—Changes in consumer spending and factors that influence spending of the specific consumers we target, including the health of the high-end housing market, may significantly impact our revenue and results of operations.
Fluctuation in Quarterly Results. Our quarterly results vary depending upon a variety of factors, including our product offerings, store openings, shifts in the timing of holidays and the timing of Source Book releases, promotional events and the timing and extent of our realization of the costs and benefits of our numerous strategic initiatives, among other things. As a result of these factors, our working capital requirements and demands on our product distribution and delivery network may fluctuate during the year. Unique factors in any given quarter may affect period-to-period comparisons between the quarters being compared, and the results for any quarter are not necessarily indicative of the results that we may achieve for a full fiscal year.
How We Assess the Performance of Our Business
In assessing the performance of our business, we consider a variety of financial and operating measures that affect our results of operations, including:
Net Revenues. Net revenues reflect our sale of merchandise plus shipping and handling revenue collected from our customers, less returns and discounts. Revenues are recognized when a customer obtains control of the merchandise. We collect annual membership fees related to the RH Members Program, which are recorded as deferred revenue when collected from customers and recognized as revenue based on expected product revenues over the annual membership period.
Gross Profit. Gross profit is equal to our net revenues less cost of goods sold. Gross profit as a percentage of our net revenues is referred to as gross margin. Cost of goods sold include the direct cost of purchased merchandise; inventory shrinkage, inventory adjustments due to obsolescence, including excess and slow-moving inventory and lower of cost or net realizable value reserves; inbound freight; all freight costs to get merchandise to our stores; design, buying and allocation costs; occupancy costs related to store operations and our supply chain, such as rent and common area maintenance for our leases; depreciation and amortization of leasehold improvements, equipment and other assets in our stores and distribution centers. In addition, cost of goods sold include all logistics costs associated with shipping product to our customers, which are partially offset by shipping income collected from customers (recorded in net revenues). We expect gross profit to increase to the extent that we successfully grow our net revenues and leverage the fixed portion of cost of goods sold.
47
Our gross profit can be favorably impacted by sales volume increases, as occupancy and certain other costs that are largely fixed do not necessarily increase proportionally with volume increases. Changes in the mix of our products may also impact our gross profit. We review our inventory levels on an ongoing basis in order to identify slow-moving merchandise and use product markdowns and our outlet stores to efficiently sell these products. The timing and level of markdowns are driven primarily by customer acceptance of our merchandise. The primary drivers of the costs of individual goods are raw materials costs, which fluctuate based on a number of factors beyond our control, including commodity prices, changes in supply and demand, general economic conditions, competition, import duties, tariffs and government regulation, logistics costs (which may increase in the event of, for example, expansions of or interruptions in the operation of our distribution centers, furniture home delivery hubs and customer service center or damage or interruption to our information systems) and labor costs in the countries where we source our merchandise. We place orders with merchandise vendors primarily in United States dollars and, as a result, are not exposed to significant foreign currency exchange risk.
Our gross profit may not be comparable to other specialty retailers, as some companies may not include all or a portion of the costs related to their distribution network and store occupancy in calculating gross profit as we and many other retailers do, but instead may include them in selling, general and administrative expenses. In addition, certain of our store leases are accounted for as build-to-suit lease transactions which result in our recording a portion of our rent payments under these agreements in interest expense on the consolidated statements of income.
Selling, General and Administrative Expenses. Selling, general and administrative expenses include all operating costs not included in cost of goods sold. These expenses include payroll and payroll related expenses, store expenses other than occupancy and expenses related to many of our operations at our corporate headquarters, including utilities, depreciation and amortization, credit card fees and marketing expense, which primarily includes Source Book production, mailing and print advertising costs. All store pre-opening costs are included in selling, general and administrative expenses and are expensed as incurred. We expect certain of these expenses to continue to increase as we continue to open new stores, develop new product categories and otherwise pursue our current business initiatives. Selling, general and administrative expenses as a percentage of net revenues are usually higher in lower-volume quarters and lower in higher-volume quarters because a significant portion of the costs are relatively fixed.
In addition, in recent periods we have experienced increased selling, general and administrative expenses, including certain non-cash compensation and costs associated with reorganizations and distribution center closures, product recalls, and asset impairments and lease losses, as discussed in “Basis of Presentation and Results of Operations” below.
Adjusted EBITDA and Adjusted Net Income. We believe that adjusted EBITDA and adjusted net income are useful measures of operating performance, as the adjustments eliminate non-recurring and other items that are not reflective of underlying business performance, facilitate a comparison of our operating performance on a consistent basis from period-to-period and provide for a more complete understanding of factors and trends affecting our business. We also use adjusted EBITDA and adjusted net income as methods for planning and forecasting overall expected performance and for evaluating on a quarterly and annual basis actual results against such expectations.
We define adjusted EBITDA as consolidated net income before depreciation and amortization, interest expense, provision for income taxes and non-cash compensation, adjusted for the impact of certain non-recurring and other items that we do not consider representative of our underlying operating performance. Because adjusted EBITDA omits non-cash items, we feel that it is less susceptible to variances in actual performance resulting from depreciation, amortization and other non-cash charges and can be more reflective of our operating performance.
We define adjusted net income as consolidated net income, adjusted for the impact of certain non-recurring and other items that we do not consider representative of our underlying operating performance. Refer to Item 6—Selected Consolidated Financial Data for further information.
Comparable Brand Revenue. We believe that comparable brand revenue is a meaningful metric to evaluate period-to-period changes in net revenue performance given the integrated multi-channel nature of our business, the synergies between our retail stores, websites and Source Books, and the fact that customers shop across all of these channels.
Comparable brand revenue growth includes direct net revenues and retail comparable store sales, including RH Baby & Child, RH Modern Galleries and RH Hospitality. Comparable brand revenue growth excludes retail non-comparable store sales, closed store sales and outlet net revenues. Comparable store sales have been calculated based upon retail stores, excluding outlet stores, that were open at least fourteen full months as of the end of the reporting period and did not change square footage by more than 20% between periods. If a store is closed for seven days during a month, that month will be excluded from comparable store sales. Membership revenue was included in comparable brand revenue growth beginning April 2017, which is the first full month following the one-year anniversary of the program launch. Waterworks revenue was included in comparable brand revenue growth beginning June 2017, which is the first full month following the one-year anniversary of the acquisition. The impact on net revenues related to the product recalls in fiscal 2018, fiscal 2017 and fiscal 2016 has been excluded from comparable brand revenue growth. Because fiscal 2017 was a 53-week year, comparable brand revenue growth percentage for fiscal 2017 excludes the extra week of revenue.
48
As the comparable brand revenue metric includes changes in retail store net revenues (i.e. comparable store sales) on a period-to-period basis and also incorporates changes in net revenues resulting from Source Book and websites sales, we believe this metric provides better information to investors in terms of evaluating our business performance and a better basis to compare performance to that of key competitors.
Basis of Presentation and Results of Operations
The following table sets forth our consolidated statements of income and other financial and operating data.
|
|
|
Year Ended |
|
|||||||||
|
|
|
February 2, |
|
|
February 3, |
|
|
January 28, |
|
|||
|
|
|
2019 |
|
|
2018 |
|
|
2017 |
|
|||
|
Consolidated Statements of Income: |
|
|
|
|
|
|
|
|
|
|
|
|
|
Net revenues |
|
$ |
2,505,653 |
|
|
$ |
2,440,174 |
|
|
$ |
2,134,871 |
|
|
Cost of goods sold |
|
|
1,504,806 |
|
|
|
1,591,107 |
|
|
|
1,455,084 |
|
|
Gross profit |
|
|
1,000,847 |
|
|
|
849,067 |
|
|
|
679,787 |
|
|
Selling, general and administrative expenses |
|
|
711,617 |
|
|
|
717,766 |
|
|
|
626,751 |
|
|
Income from operations |
|
|
289,230 |
|
|
|
131,301 |
|
|
|
53,036 |
|
|
Other expenses |
|
|
|
|
|
|
|
|
|
|
|
|
|
Interest expense—net |
|
|
75,074 |
|
|
|
62,570 |
|
|
|
44,482 |
|
|
Goodwill and tradename impairment |
|
|
32,086 |
|
|
|
33,700 |
|
|
|
— |
|
|
Loss on extinguishment of debt |
|
|
917 |
|
|
|
4,880 |
|
|
|
— |
|
|
Total other expenses |
|
|
108,077 |
|
|
|
101,150 |
|
|
|
44,482 |
|
|
Income before income taxes |
|
|
181,153 |
|
|
|
30,151 |
|
|
|
8,554 |
|
|
Income tax expense |
|
|
30,514 |
|
|
|
27,971 |
|
|
|
3,153 |
|
|
Net income |
|
$ |
150,639 |
|
|
$ |
2,180 |
|
|
$ |
5,401 |
|
|
Other Financial and Operating Data: |
|
|
|
|
|
|
|
|
|
|
|
|
|
Net revenues: |
|
|
|
|
|
|
|
|
|
|
|
|
|
Stores (1) |
|
$ |
1,412,105 |
|
|
$ |
1,371,342 |
|
|
$ |
1,178,860 |
|
|
Direct (2) |
|
$ |
1,093,548 |
|
|
$ |
1,068,832 |
|
|
$ |
956,011 |
|
|
Direct as a percentage of net revenues (2) |
|
|
44 |
% |
|
|
44 |
% |
|
|
45 |
% |
|
Growth in net revenues: |
|
|
|
|
|
|
|
|
|
|
|
|
|
Stores (1) |
|
|
3 |
% |
|
|
16 |
% |
|
|
9 |
% |
|
Direct (2) |
|
|
2 |
% |
|
|
12 |
% |
|
|
(7 |
)% |
|
Total |
|
|
3 |
% |
|
|
14 |
% |
|
|
1 |
% |
|
Comparable brand revenue growth (3) |
|
|
4 |
% |
|
|
6 |
% |
|
|
(7 |
)% |
|
(1) |
Stores data represents sales originating in retail stores, including Waterworks showrooms, and outlet stores. Net revenues for outlet stores, which include warehouse sales, were $179.0 million, $205.7 million and $144.6 million, for fiscal 2018, fiscal 2017 and fiscal 2016, respectively. |
|
(2) |
Direct net revenues include sales originating from our Source Books, websites, and phone orders, including our Contract business and a portion of our Trade business. |
|
(3) |
Comparable brand revenue growth includes direct net revenues and retail comparable store sales, including RH Baby & Child, RH Modern Galleries and RH Hospitality. Comparable brand revenue growth excludes retail non-comparable store sales, closed store sales and outlet net revenues. Comparable store sales have been calculated based upon retail stores, excluding outlet stores, that were open at least fourteen full months as of the end of the reporting period and did not change square footage by more than 20% between periods. If a store is closed for seven days during a month, that month will be excluded from comparable store sales. Membership revenue was included in comparable brand revenue growth beginning April 2017, which is the first full month following the one-year anniversary of the program launch. Waterworks revenue was included in comparable brand revenue growth beginning June 2017, which is the first full month following the one-year anniversary of the acquisition. The impact on net revenues related to the product recalls in fiscal 2018, fiscal 2017 and fiscal 2016 has been excluded from comparable brand revenue growth. Because fiscal 2017 was a 53-week year, comparable brand revenue growth percentage for fiscal 2017 excludes the extra week of revenue. |
49
The following table sets forth our consolidated statements of income as a percentage of total net revenues.
|
|
|
Year Ended |
|
|||||||||
|
|
|
February 2, |
|
|
February 3, |
|
|
January 28, |
|
|||
|
|
|
2019 |
|
|
2018 |
|
|
2017 |
|
|||
|
Consolidated Statements of Income: |
|
|
|
|
|
|
|
|
|
|
|
|
|
Net revenues |
|
|
100.0 |
% |
|
|
100.0 |
% |
|
|
100.0 |
% |
|
Cost of goods sold |
|
|
60.1 |
|
|
|
65.2 |
|
|
|
68.2 |
|
|
Gross profit |
|
|
39.9 |
|
|
|
34.8 |
|
|
|
31.8 |
|
|
Selling, general and administrative expenses |
|
|
28.4 |
|
|
|
29.4 |
|
|
|
29.3 |
|
|
Income from operations |
|
|
11.5 |
|
|
|
5.4 |
|
|
|
2.5 |
|
|
Other expenses |
|
|
|
|
|
|
|
|
|
|
|
|
|
Interest expense—net |
|
|
3.0 |
|
|
|
2.6 |
|
|
|
2.1 |
|
|
Goodwill and tradename impairment |
|
|
1.3 |
|
|
|
1.4 |
|
|
|
— |
|
|
Loss on extinguishment of debt |
|
|
— |
|
|
|
0.2 |
|
|
|
— |
|
|
Total other expenses |
|
|
4.3 |
|
|
|
4.2 |
|
|
|
2.1 |
|
|
Income before income taxes |
|
|
7.2 |
|
|
|
1.2 |
|
|
|
0.4 |
|
|
Income tax expense |
|
|
1.2 |
|
|
|
1.1 |
|
|
|
0.1 |
|
|
Net income |
|
|
6.0 |
% |
|
|
0.1 |
% |
|
|
0.3 |
% |
Fiscal 2018 Compared to Fiscal 2017
Fiscal 2018 includes results for fifty-two weeks and fiscal 2017 includes results for fifty-three weeks for both the RH Segment and Waterworks.
|
|
|
Year Ended |
|
|||||||||||||||||||||
|
|
|
February 2, |
|
|
February 3, |
|
||||||||||||||||||
|
|
|
2019 |
|
|
2018 |
|
||||||||||||||||||
|
|
|
RH Segment |
|
|
Waterworks (1) |
|
|
Total |
|
|
RH Segment |
|
|
Waterworks (1) |
|
|
Total |
|
||||||
|
|
|
(in thousands) |
|
|||||||||||||||||||||
|
Net revenues |
|
$ |
2,375,472 |
|
|
$ |
130,181 |
|
|
$ |
2,505,653 |
|
|
$ |
2,319,332 |
|
|
$ |
120,842 |
|
|
$ |
2,440,174 |
|
|
Cost of goods sold |
|
|
1,426,165 |
|
|
|
78,641 |
|
|
|
1,504,806 |
|
|
|
1,517,333 |
|
|
|
73,774 |
|
|
|
1,591,107 |
|
|
Gross profit |
|
|
949,307 |
|
|
|
51,540 |
|
|
|
1,000,847 |
|
|
|
801,999 |
|
|
|
47,068 |
|
|
|
849,067 |
|
|
Selling, general and administrative expenses |
|
|
658,542 |
|
|
|
53,075 |
|
|
|
711,617 |
|
|
|
666,055 |
|
|
|
51,711 |
|
|
|
717,766 |
|
|
Income (loss) from operations |
|
$ |
290,765 |
|
|
$ |
(1,535 |
) |
|
$ |
289,230 |
|
|
$ |
135,944 |
|
|
$ |
(4,643 |
) |
|
$ |
131,301 |
|
|
(1) |
Waterworks results include non-cash amortization of $0.4 million and $2.5 million related to the inventory fair value adjustment recorded in connection with our acquisition of Waterworks during fiscal 2018 and fiscal 2017, respectively. |
Net revenues
Consolidated net revenues increased $65.5 million, or 2.7%, to $2,505.7 million in fiscal 2018 compared to $2,440.2 million in fiscal 2017. Stores net revenues increased $40.8 million, or 3.0%, to $1,412.1 million in fiscal 2018 compared to $1,371.3 million in fiscal 2017. Direct net revenues increased $24.7 million, or 2.3%, to $1,093.5 million in fiscal 2018 compared to $1,068.8 million in fiscal 2017. Comparable brand revenue was 4% for fiscal 2018.
RH Segment net revenues
RH Segment net revenues increased $56.1 million, or 2.4%, to $2,375.5 million in fiscal 2018 compared to $2,319.3 million in fiscal 2017. The below discussion highlights several significant factors that resulted in increased RH Segment net revenues. Given the overall increase in RH Segment net revenues, our discussion below first lists, which we believe are in order of magnitude, all factors that contributed to the increase and then lists the factors that partially offset the overall increase.
50
RH Segment core net revenues increased due to timing and an increase in total pages circulated of our Source Book mailings, as well as the introduction of new products and new product categories, including the strong performance of our Outdoor product line in fiscal 2018 as compared to fiscal 2017. In addition, RH Segment core net revenues increased due to an increase in retail weighted-average leased selling square footage related to new store openings, including New York, West Palm Beach, Toronto, Portland, Nashville and Yountville. RH Segment core net revenues also increased during fiscal 2018 due to increased revenues from our Contract business, RH Hospitality operations and Membership. The overall increase in RH Segment core net revenues was partially offset by additional discounts offered on discontinued merchandise related to the optimization of our inventory and SKU rationalization. In addition, we believe that our net revenues were negatively impacted by a decline in sales in the fourth quarter resulting from stock market fluctuations and negative trends in high-end housing.
Outlet sales decreased $26.7 million in fiscal 2018 compared to fiscal 2017 primarily as a result of our inventory optimization efforts in fiscal 2017 as we increased our outlet promotional activity and offered higher discounts. Similar promotions and discounts were not offered to the same extent in fiscal 2018. This overall decrease was partially offset by an increase of seven outlet locations year over year, resulting in an approximate 15% increase in outlet selling square footage.
RH Segment net revenues decreased approximately $40.6 million due to fiscal 2017 representing fifty-three weeks of results, whereas fiscal 2018 included fifty-two weeks of results.
RH Segment net revenues for fiscal 2018 and fiscal 2017 were negatively impacted by $4.7 million and $3.2 million, respectively, related to the reduction of revenue associated with product recalls.
Waterworks net revenues
Waterworks net revenues increased $9.3 million, or 7.7%, to $130.2 million in fiscal 2018 compared to $120.8 million in fiscal 2017, primarily due to new product launches, particularly fittings for bath and kitchen. The overall increase in net revenues is partially offset by a decrease in net revenues due to Waterworks fiscal 2017, which included fifty-three weeks of results, whereas fiscal 2018 included fifty-two weeks of results.
Gross profit
Consolidated gross profit increased $151.8 million, or 17.9%, to $1,000.8 million in fiscal 2018 compared to $849.1 million in fiscal 2017. As a percentage of net revenues, gross margin increased 5.1% to 39.9% of net revenues in fiscal 2018 compared to 34.8% of net revenues in fiscal 2017.
RH Segment gross profit for fiscal 2018 was negatively impacted by $2.6 million related to acceleration of depreciation due to a change the estimated useful life of certain assets, $1.5 million related to costs associated with distribution center closures, $1.2 million due to inventory impairment related to Holiday merchandise and $0.6 million related to product recalls, including (i) the reduction of revenue, (ii) incremental costs and (iii) inventory charges, partially offset by (iv) insurance reimbursements.
RH Segment gross profit for fiscal 2017 was negatively impacted by $7.5 million related to product recalls, including (i) the reduction of revenue, (ii) incremental costs and (iii) inventory charges, and $1.7 million related to costs associated with distribution center closures. RH Segment gross profit for fiscal 2017 was positively impacted by $2.2 million related to the release of the remaining reserve for potential claims regarding anti-dumping duties which we believe have lapsed.
Waterworks gross profit for fiscal 2018 and fiscal 2017 was negatively impacted by $0.4 million and $2.5 million, respectively, of amortization related to the inventory fair value adjustment recorded in connection with the acquisition.
Excluding the accelerated asset depreciation, costs associated with the distribution center closures, inventory impairment, product recall adjustments, impact of the amortization related to the inventory fair value adjustment and release of the anti-dumping duty reserve mentioned above, consolidated gross margin would have increased 5.0% to 40.1% of net revenues in fiscal 2018 compared to 35.1% of net revenues in fiscal 2017.
51
RH Segment gross profit increased $147.3 million, or 18.4%, to $949.3 million in fiscal 2018 compared to $802.0 million in fiscal 2017. As a percentage of net revenues, RH Segment gross margin increased 5.4% to 40.0% of net revenues in fiscal 2018 compared to 34.6% of net revenues in fiscal 2017.
Excluding the accelerated asset depreciation, costs associated with distribution center closures, inventory impairment, product recall adjustments and release of the anti-dumping duty reserve mentioned above, RH Segment gross margin would have increased 5.3% to 40.1% of net revenues in fiscal 2018 compared to 34.8% of net revenues in fiscal 2017. The increase was related to improvements in our core merchandise margins as our SKU rationalization efforts had a reduced impact on our margins this year compared to last year, as well as increased outlet product margins due to higher outlet and warehouse sales during fiscal 2017 driven by increased promotions and higher discounts versus fiscal 2018. In addition, we achieved leverage in our occupancy costs primarily related to our distribution center network redesign. The overall increase in gross margin was partially offset by higher delivery costs and our investment in the ramping of our new RH Hospitality locations.
Waterworks gross profit
Waterworks gross profit increased $4.5 million, or 9.5%, to $51.5 million in fiscal 2018 compared to $47.1 million in fiscal 2017. As a percentage of net revenues, Waterworks gross margin increased 0.6% to 39.6% of net revenues in fiscal 2018 compared to 39.0% of net revenues in fiscal 2017. Excluding the impact of the amortization related to the inventory fair value adjustment mentioned above, Waterworks gross margin would have decreased 1.1% to 39.9% of net revenues in fiscal 2018 compared to 41.0% of net revenues in fiscal 2017. The decrease in gross margin is primarily due to SKU rationalization efforts in fiscal 2018, as well as deleverage in occupancy costs resulting from lower than expected revenue growth.
Selling, general and administrative expenses
Consolidated selling, general and administrative expenses decreased $6.1 million, or 0.9%, to $711.6 million in fiscal 2018 compared to $717.8 million in fiscal 2017.
RH Segment selling, general and administrative expenses
RH Segment selling, general and administrative expenses decreased $7.5 million, or 1.1%, to $658.5 million in fiscal 2018 compared $666.1 million in fiscal 2017.
RH Segment selling, general and administrative expenses for fiscal 2018 included a $10.0 million charge related to reorganizations primarily due to streamlining and realigning our home office operations, as well as due to distribution center closures, $3.4 million related to remeasurement of RH Contemporary Art lease loss liability, $1.0 million related to product recalls, $0.3 million related to costs associated with distribution center closures and a favorable $5.3 million legal settlement, net of related legal expenses.
RH Segment selling, general and administrative expenses for fiscal 2017 included $23.9 million related to a fully vested option grant made to Mr. Friedman in May 2017, $4.4 million related to remeasurement of RH Contemporary Art lease loss liability, $3.1 million costs associated with distribution center closures, $0.9 million reorganization charges, $0.2 million incremental costs associated with product recalls and a gain of $2.1 million related to the sale of building and land.
Employment and employee related costs, excluding the fully vested option grant to Mr. Friedman, and the severance costs associated with the reorganizations and distribution center closures mentioned above, increased $10.5 million during fiscal 2018 as compared to fiscal 2017, primarily related to incentive compensation.
Corporate expenses increased $9.5 million, primarily due to an increase in preopening expense associated with our Design Gallery openings and, to a lesser extent, an increase in credit card fees due to an increase in revenues.
Advertising and marketing costs decreased $8.9 million primarily due to the adoption of Topic 606 in the first quarter of fiscal 2018, which resulted in the costs associated with Source Books being fully expensed upon delivery to the carrier, as well as the timing of our Source Book mailings.
52
RH Segment selling, general and administrative expenses were 27.3% and 27.4% of net revenues for fiscal 2018 and fiscal 2017, respectively, excluding the reorganizations, the remeasurement of the lease liability associated with RH Contemporary Art, the product recalls, the distribution center closures, the legal settlement, the fully vested option grant made to Mr. Friedman in May 2017 and the gain related to the sale of building and land mentioned above. The decrease in selling, general and administrative expenses as a percentage of net revenues was primarily driven by advertising and marketing, partially offset by preopening expense associated with our Design Gallery openings.
Waterworks selling, general and administrative expenses
Waterworks selling, general and administrative expenses increased $1.4 million, or 2.6%, to $53.1 million in fiscal 2018 compared to $51.7 million in fiscal 2017. Waterworks selling, general and administrative expenses were 40.8% and 42.8% of net revenues in fiscal 2018 and fiscal 2017, respectively. The decrease in selling, general and administrative expenses as a percentage of net revenues was primarily driven by leverage in corporate costs.
Interest expense—net
Interest expense increased $12.5 million to $75.1 million in fiscal 2018 compared to $62.6 million in fiscal 2017. Interest expense consisted of the following:
|
|
|
Year Ended |
|
|||||
|
|
|
February 2, |
|
|
February 3, |
|
||
|
|
|
2019 |
|
|
2018 |
|
||
|
|
|
(in thousands) |
|
|||||
|
Amortization of convertible senior notes debt discount |
|
$ |
41,868 |
|
|
$ |
30,457 |
|
|
Build-to-suit lease transactions |
|
|
22,667 |
|
|
|
16,781 |
|
|
Asset based credit facility |
|
|
6,192 |
|
|
|
7,042 |
|
|
Amortization of debt issuance costs and deferred financing fees |
|
|
3,640 |
|
|
|
4,705 |
|
|
Term loans |
|
|
1,649 |
|
|
|
4,526 |
|
|
Other interest expense |
|
|
3,031 |
|
|
|
2,877 |
|
|
Capitalized interest for capital projects |
|
|
(3,139 |
) |
|
|
(3,304 |
) |
|
Interest income |
|
|
(834 |
) |
|
|
(514 |
) |
|
Total interest expense—net |
|
$ |
75,074 |
|
|
$ |
62,570 |
|
Goodwill and tradename impairment
We incurred a $32.1 million goodwill and tradename impairment charge in fiscal 2018 and a $33.7 million goodwill impairment charge in fiscal 2017 for our Waterworks reporting unit. Refer to “Impairment” within Note 3—Significant Accounting Policies in our consolidated financial statements for details regarding the impairment.
Loss on extinguishment of debt
We incurred a $0.9 million loss on extinguishment of debt in fiscal 2018 due to the repayment in full of the LILO term loan, the promissory note secured by our aircraft and the equipment security notes in June 2018, which includes acceleration of amortization of debt issuance costs of $0.6 million and a prepayment penalty of $0.3 million. We incurred a $4.9 million loss on extinguishment of debt in fiscal 2017 due to the repayment in full of the second lien term loan in October 2017, which includes a prepayment penalty of $3.0 million and acceleration of amortization of debt issuance costs of $1.9 million.
53
Income tax expense was $30.5 million in fiscal 2018 compared to $28.0 million in fiscal 2017. Our effective tax rate was 16.8% in fiscal 2018 compared to 92.8% in fiscal 2017. The effective tax rate in fiscal 2018 was significantly impacted by discrete tax benefits related to net excess tax windfalls from stock-based compensation of $15.9 million resulting from increased option exercise activity and appreciation of the stock price, the Waterworks reporting unit goodwill impairment, as well as the reduction in the U.S. corporate income tax rate from 35% to 21% effective January 1, 2018 due to the passage of the Tax Cuts and Jobs Act (the “Tax Act”.) The effective tax rate in fiscal 2017 was significantly impacted by non-deductible stock-based compensation related to the May 2017 grant to Mr. Friedman of an option to purchase 1,000,000 shares of the Company’s common stock. Refer to Note 16—Stock-Based Compensation in our consolidated financial statements for a description of the option grant to Mr. Friedman. In addition, the effective tax rate in fiscal 2017 was impacted by tax reform and the Waterworks reporting unit goodwill impairment. The fiscal 2017 effective tax rate was favorably impacted by net excess tax benefits from stock-based compensation of $7.0 million.
The United States enacted the Tax Cuts and Jobs Act (the “Tax Act”) on December 22, 2017. The new legislation contains several key tax provisions that affect us and, as required, we have included reasonable estimates of the income tax effects of the changes in tax law and tax rate in our fiscal 2017 financial results. Since the Tax Act was passed in the fourth quarter of fiscal 2017, we considered the accounting for the transition tax, deferred tax re-measurements, and other items to be provisional. As of February 2, 2019, we finalized our estimates within the one-year measurement period allowed by the SEC and completed our accounting for the tax effects of enactment of the Tax Act.
Our provision for income taxes in fiscal 2017 included $7.0 million of income tax expense as a result of the Tax Act, including $6.0 million for the provisional re-measurement of our net deferred tax assets for the reduction in the U.S. corporate income tax rate from 35% to 21% and a $1.0 million charge for our provisional estimate of the transition tax. We completed our accounting for re-measurement of our deferred tax assets and recorded $0.5 million of income tax expense as a result. No additional income tax expense or benefit was recorded relating to the completion of our transition tax liability.
Fiscal 2017 Compared to Fiscal 2016
Prior to the Waterworks acquisition on May 27, 2016, we had one reportable segment. As we acquired the Waterworks business on May 27, 2016, reportable segment information presented below for Waterworks includes results for thirty-five weeks during fiscal 2016 and includes results for fifty-three weeks during fiscal 2017. The RH Segment includes results for fifty-two weeks during fiscal 2016 and fifty-three weeks during fiscal 2017.
|
|
|
Year Ended |
|
|||||||||||||||||||||
|
|
|
February 3, |
|
|
January 28, |
|
||||||||||||||||||
|
|
|
2018 |
|
|
2017 |
|
||||||||||||||||||
|
|
|
RH Segment |
|
|
Waterworks (1) |
|
|
Total |
|
|
RH Segment |
|
|
Waterworks (1) |
|
|
Total |
|
||||||
|
|
|
(in thousands) |
|
|||||||||||||||||||||
|
Net revenues |
|
$ |
2,319,332 |
|
|
$ |
120,842 |
|
|
$ |
2,440,174 |
|
|
$ |
2,060,044 |
|
|
$ |
74,827 |
|
|
$ |
2,134,871 |
|
|
Cost of goods sold |
|
|
1,517,333 |
|
|
|
73,774 |
|
|
|
1,591,107 |
|
|
|
1,403,853 |
|
|
|
51,231 |
|
|
|
1,455,084 |
|
|
Gross profit |
|
|
801,999 |
|
|
|
47,068 |
|
|
|
849,067 |
|
|
|
656,191 |
|
|
|
23,596 |
|
|
|
679,787 |
|
|
Selling, general and administrative expenses |
|
|
666,055 |
|
|
|
51,711 |
|
|
|
717,766 |
|
|
|
590,288 |
|
|
|
36,463 |
|
|
|
626,751 |
|
|
Income (loss) from operations |
|
$ |
135,944 |
|
|
$ |
(4,643 |
) |
|
$ |
131,301 |
|
|
$ |
65,903 |
|
|
$ |
(12,867 |
) |
|
$ |
53,036 |
|
|
(1) |
Waterworks results include non-cash amortization of $2.5 million and $6.8 million related to the inventory fair value adjustment recorded in connection with our acquisition of Waterworks during fiscal 2017 and fiscal 2016, respectively. Waterworks results for fiscal 2016 also include a non-cash compensation charge of $3.7 million related to the fully vested option grants made in connection with our acquisition of Waterworks. |
Net revenues
Consolidated net revenues increased $305.3 million, or 14.3%, to $2,440.2 million in fiscal 2017 compared to $2,134.9 million in fiscal 2016. Stores net revenues increased $192.5 million, or 16.3%, to $1,371.3 million in fiscal 2017 compared to $1,178.9 million in fiscal 2016. Direct net revenues increased $112.8 million, or 11.8%, to $1,068.8 million in fiscal 2017 compared to $956.0 million in fiscal 2016. Comparable brand revenue was 6% for fiscal 2017.
54
RH Segment net revenues increased $259.3 million, or 12.6%, to $2,319.3 million in fiscal 2017 compared to $2,060.0 million in fiscal 2016. The below discussion highlights several significant factors that resulted in increased RH Segment net revenues, which are listed in order of magnitude.
RH Segment core net revenues increased due to the performance of our new Design Galleries and an increase in retail weighted-average leased selling square footage, as well as our decision to move the mailing of our 2016 Interiors Source Book to the fall of 2016. The 2016 Interiors Source Book mailing was complete in mid-December and therefore was a contributor to net revenues in fiscal 2017, whereas fiscal 2016 did not benefit from a similarly timed mailing.
Outlet sales, which include sales via warehouse locations, increased $61.1 million in fiscal 2017 compared to fiscal 2016, representing 23.5% of the RH Segment net revenues growth. Increased outlet sales occurred primarily as a result of our inventory optimization efforts as we increased our outlet promotional activity and offered higher discounts, including through warehouse sales. We also increased outlet selling square footage by approximately 33% compared to the prior period.
In addition, RH Segment net revenues increased approximately $40.6 million due to fiscal 2017 representing fifty-three weeks of results, whereas fiscal 2016 only included fifty-two weeks of results.
We introduced our membership program in March 2016, which provided a greater level of discount to our customers in most instances, but our recognition of membership fee revenue did not coincide with the timing of a customer order since the membership fee is recognized ratably over the 12 month period of membership. In fiscal 2017, we passed the first year anniversary of the launch of RH membership and as a result we were able to recognize a larger amount of Membership revenue versus 2016 and therefore we had an increase in Membership revenue recognized of $21.4 million.
During fiscal 2016, RH Segment net revenues were reduced by an estimated $16 million due to customer accommodation and related expenses as a result of our initiative to elevate the customer experience, including in response to production delays related to RH Modern. We did not experience similar production delays during fiscal 2017. Additionally, RH Segment net revenues for fiscal 2017 and fiscal 2016 were negatively impacted by $3.2 million and $3.4 million, respectively, related to the reduction of revenue associated with product recalls.
Waterworks net revenues
On May 27, 2016, we acquired a controlling interest in Waterworks. As a result of this acquisition, we acquired 15 Waterworks showrooms and included such additional retail stores in our weighted-average leased selling square footage for both fiscal 2017 and part of fiscal 2016. Waterworks net revenues increased $46.0 million, or 61.5%, to $120.8 million in fiscal 2017 compared to $74.8 million in fiscal 2016. Waterworks net revenues represented 5.0% and 3.5% of our net revenues for fiscal 2017 and fiscal 2016, respectively. The increase in Waterworks net revenues is primarily due to fiscal 2017 representing fifty-three weeks of results, whereas fiscal 2016 only included thirty-five weeks of results as Waterworks was acquired on May 27, 2016.
Gross profit
Consolidated gross profit increased $169.3 million, or 24.9%, to $849.1 million in fiscal 2017 compared to $679.8 million in fiscal 2016. As a percentage of net revenues, gross margin increased 3.0% to 34.8% of net revenues in fiscal 2017 compared to 31.8% of net revenues in fiscal 2016.
RH Segment gross profit for fiscal 2017 was positively impacted by $2.2 million related to the release of the remaining reserve for potential claims regarding anti-dumping duties which we believe have lapsed. RH Segment gross profit for fiscal 2016 was negatively impacted by $7.7 million related to the estimated cumulative impact of coupons redeemed in connection with a legal claim alleging that the Company violated California’s Song-Beverly Credit Card Act of 1971 by requesting and recording ZIP codes from customers paying with credit cards. The coupons expired in March 2016. RH Segment gross profit for fiscal 2016 was also negatively impacted by $4.0 million related to the reduction of revenue and costs associated with product recalls and $2.2 million due to inventory impairments related to RH Contemporary Art and RH Kitchen. RH Segment gross profit for fiscal 2017 was negatively impacted by $7.5 million related to the reduction of revenue, incremental costs and inventory charges associated with product recalls and $1.7 million related to costs associated with distribution center closures.
Waterworks gross profit for fiscal 2017 and fiscal 2016 was negatively impacted by $2.5 million and $6.8 million, respectively, of amortization related to the inventory fair value adjustment recorded in connection with the acquisition.
55
Excluding the release of the anti-dumping duty reserve, impact of the coupons redeemed in connection with the legal claim, product recall costs, RH Contemporary Art and RH Kitchen impairments, costs associated with the distribution center closures and amortization related to the inventory fair value adjustment mentioned above, consolidated gross margin would have increased 2.3% to 35.1% of net revenues in fiscal 2017 compared to 32.8% of net revenues in fiscal 2016.
RH Segment gross profit
RH Segment gross profit increased $145.8 million, or 22.2%, to $802.0 million in fiscal 2017 compared to $656.2 million in fiscal 2016. As a percentage of net revenues, RH Segment gross margin increased 2.7% to 34.6% of net revenues in fiscal 2017 compared to 31.9% of net revenues in fiscal 2016. Excluding the release of the anti-dumping duty reserve, impact of the coupons redeemed in connection with the legal claim, product recall costs, RH Contemporary Art and RH Kitchen impairments, and costs associated with distribution center closures mentioned above, RH Segment gross margin would have increased 2.3% to 34.8% of net revenues in fiscal 2017 compared to 32.5% of net revenues in fiscal 2016.
Merchandise margins were impacted by our SKU rationalization efforts that had a reduced impact on our margins this year compared to last year, partially offset by higher outlet and warehouse sales driven by increased promotions and higher discounts. In addition, gross margin increased due to leverage in our fiscal 2017 shipping expense, as well as incremental shipping charges incurred during fiscal 2016 related to RH Modern production delays and our investment to elevate the customer experience. We also experienced cost leverage due to savings related to our newly introduced reverse logistics strategy. During fiscal 2017, we experienced leverage in our fixed distribution occupancy costs, partially offset by increased outlet occupancy costs.
Waterworks gross profit
Waterworks gross profit increased $23.5 million, or 99.5%, to $47.1 million in fiscal 2017 compared to $23.6 million in fiscal 2016. The increase in Waterworks gross profit is primarily due to fiscal 2017 representing fifty-three weeks of results, whereas fiscal 2016 included thirty-five weeks of results as Waterworks was acquired on May 27, 2016. As a percentage of net revenues, Waterworks gross margin increased 7.5% to 39.0% of net revenues in fiscal 2017 compared to 31.5% of net revenues in fiscal 2016. Excluding the impact of the amortization related to the inventory fair value adjustment mentioned above, Waterworks gross margin would have increased 0.3% to 41.0% of net revenues in fiscal 2017 compared to 40.7% of net revenues in fiscal 2016. The increase in gross margin is primarily due to a decline in product related reserves year over year, partially offset by deleverage in occupancy costs.
Selling, general and administrative expenses
Consolidated selling, general and administrative expenses increased $91.0 million, or 14.5%, to $717.8 million in fiscal 2017 compared to $626.8 million in fiscal 2016.
RH Segment selling, general and administrative expenses
RH Segment selling, general and administrative expenses increased $75.8 million, or 12.8%, to $666.1 million in fiscal 2017 compared $590.3 million in fiscal 2016. Employment and employment related costs increased $47.5 million in fiscal 2017 compared to fiscal 2016, which includes the fully vested option grant made to Mr. Friedman and severance expense associated with the distribution center closures and reorganization discussed below. Excluding the fully vested option grant and severance expense, the remaining increase in employment costs is primarily related to incentive compensation due to the Company achieving certain internal performance targets in fiscal 2017. In addition, advertising and marketing costs increased $26.3 million in fiscal 2017 as compared to fiscal 2016, primarily due to the timing of our Source Book mailings. In fiscal 2017 we amortized costs related to our 2016 Interiors Source Book which was circulated in the fall of 2016. The 2016 Interiors Source Book mailing was complete in mid-December and therefore resulted in amortized costs in fiscal 2017, whereas fiscal 2016 did not incur similarly timed expenses.
RH Segment selling, general and administrative expenses for fiscal 2017 included $23.9 million related to a fully vested option grant made to Mr. Friedman in May 2017, $4.4 million related to remeasurement of RH Contemporary Art lease loss liability, $3.1 million costs associated with distribution center closures, $0.9 million reorganization charges, $0.2 million incremental costs associated with product recalls and a gain of $2.1 million related to the sale of building and land.
RH Segment selling, general and administrative expenses for fiscal 2016 included a $10.6 million impairment associated with RH Contemporary Art, $5.7 million associated with a reorganization, including severance and related taxes, $4.8 million related to the impairment recorded due to the decision to sell an aircraft, $2.8 million related to charges and expenses incurred as a result of the Waterworks transaction, $1.0 million related to the estimated cumulative impact of coupons redeemed in connection with a legal claim alleging that the Company violated California’s Song-Beverly Credit Card Act of 1971 by requesting and recording ZIP codes from customers paying with credit cards, and $0.6 million in costs associated with product recalls.
56
RH Segment selling, general and administrative expenses were 27.4% of net revenues for both fiscal 2017 and fiscal 2016, respectively, excluding the fully vested option grant made to Mr. Friedman in May 2017, costs associated with distribution center closures, impairment and subsequent remeasurement of the lease liability associated with RH Contemporary Art, the product recall costs, the gain related to the sale of building and land, the reorganization costs, the impairment recorded due to the decisions to sell an aircraft, the charges and expenses incurred as a result of the Waterworks transaction, and the impact of coupons redeemed in connection with the legal claim mentioned above. Selling, general and administrative expenses as a percentage of net revenues decreased due to leverage in our employment and corporate occupancy costs, which was offset by an increase in advertising and marketing costs, as well as increased incentive compensation costs.
Waterworks selling, general and administrative expenses
Waterworks selling, general and administrative expenses increased $15.2 million, or 41.8%, to $51.7 million in fiscal 2017 compared $36.5 million in fiscal 2016.
The increase in Waterworks selling, general and administrative expenses is primarily due to fiscal 2017 representing fifty-three weeks of results, whereas fiscal 2016 only includes thirty-five weeks of results as Waterworks was acquired on May 27, 2016. This increase is partially offset by stock-based compensation of $3.7 million related to the fully vested option grants made in connection with our acquisition of Waterworks in fiscal 2016.
Excluding the fully vested option grants made in connection with our acquisition of Waterworks, Waterworks selling, general and administrative expenses would have been 42.8% and 43.8% of net revenues in fiscal 2017 and fiscal 2016, respectively, with such decrease driven by leverage in corporate costs and advertising expenses partially offset by deleverage in employment and employment related costs.
Interest expense—net
Interest expense increased $18.1 million to $62.6 million in fiscal 2017 compared to $44.5 million in fiscal 2016. Interest expense consisted of the following:
|
|
|
Year Ended |
|
|||||
|
|
|
February 3, |
|
|
January 28, |
|
||
|
|
|
2018 |
|
|
2017 |
|
||
|
|
|
(in thousands) |
|
|||||
|
Amortization of convertible senior notes debt discount |
|
$ |
30,457 |
|
|
$ |
28,822 |
|
|
Build-to-suit lease transactions |
|
|
16,781 |
|
|
|
13,447 |
|
|
Asset based credit facility |
|
|
7,042 |
|
|
|
1,827 |
|
|
Amortization of debt issuance costs and deferred financing fees |
|
|
4,705 |
|
|
|
2,525 |
|
|
Term loans |
|
|
4,526 |
|
|
|
— |
|
|
Other interest expense |
|
|
2,877 |
|
|
|
3,268 |
|
|
Capitalized interest for capital projects |
|
|
(3,304 |
) |
|
|
(2,418 |
) |
|
Interest income |
|
|
(514 |
) |
|
|
(2,989 |
) |
|
Total interest expense—net |
|
$ |
62,570 |
|
|
$ |
44,482 |
|
Goodwill and tradename impairment
We incurred a $33.7 million goodwill impairment in fiscal 2017 for our Waterworks reporting unit. Refer to “Impairment” within Note 3—Significant Accounting Policies in our consolidated financial statements for details regarding the impairment.
Loss on extinguishment of debt
We incurred a $4.9 million loss on extinguishment of debt in fiscal 2017 due to the repayment in full of the second lien term loan in October 2017, which includes a prepayment penalty of $3.0 million and acceleration of amortization of debt issuance costs of $1.9 million.
57
Income tax expense was $28.0 million in fiscal 2017 compared to $3.2 million in fiscal 2016. Our effective tax rate was 92.8% in fiscal 2017 compared to 36.9% in fiscal 2016. The effective tax rate in fiscal 2017 was significantly impacted by non-deductible stock-based compensation related to the May 2017 grant to Mr. Friedman of an option to purchase 1,000,000 shares of the Company’s common stock. Refer to Note 16—Stock-Based Compensation in our consolidated financial statements for a description of the option grant to Mr. Friedman. In addition, the effective tax rate in fiscal 2017 was impacted by tax reform and the Waterworks reporting unit goodwill impairment. The effective tax rate was favorably impacted by net excess tax benefits from stock-based compensation of $7.0 million.
The United States enacted the Tax Cuts and Jobs Act (the “Tax Act”) on December 22, 2017. The new legislation contains several key tax provisions that affect us and, as required, we included reasonable estimates of the income tax effects of the changes in tax law and tax rate in our fiscal 2017 financial results. Since the Tax Act was passed in the fourth quarter of fiscal 2017, we considered the accounting for the transition tax, deferred tax re-measurements, and other items to be provisional as the charge may be adjusted due to changes in interpretations and assumptions we have made, guidance that may be issued, and actions we may take as a result of the tax legislation. As of February 2, 2019, we finalized our estimates within the one-year measurement period allowed by the SEC.
Our provision for income taxes in fiscal 2017 included $7.0 million of income tax expense as a result of the Tax Act, including $6.0 million for the provisional re-measurement of our net deferred tax assets for the reduction in the U.S. corporate income tax rate from 35% to 21% and a $1.0 million charge for our provisional estimate of the transition tax.
Quarterly Results
The following table sets forth our historical quarterly consolidated statements of income for each of the last eight fiscal quarters ended through February 2, 2019. This quarterly information has been prepared on the same basis as our annual audited financial statements and includes all adjustments that we consider necessary to fairly state the financial information for the fiscal quarters presented. The quarterly data should be read in conjunction with our consolidated financial statements and the related notes included in Item 8—Financial Statements and Supplementary Data.
Our quarterly results vary depending upon a variety of factors, including our product offerings, store openings, shifts in the timing of holidays, the timing of Source Book releases and promotional events, among other things. As a result of these factors, our working capital requirements and demands on our product distribution and delivery network may fluctuate during the year and results of a period shorter than a full year may not be indicative of results expected for the entire year.
|
|
|
Fiscal 2017 |
|
|
Fiscal 2018 |
|
||||||||||||||||||||||||||
|
|
|
First Quarter |
|
|
Second Quarter |
|
|
Third Quarter |
|
|
Fourth Quarter |
|
|
First Quarter |
|
|
Second Quarter |
|
|
Third Quarter |
|
|
Fourth Quarter |
|
||||||||
|
|
|
(dollars in thousands) |
|
|||||||||||||||||||||||||||||
|
Net revenues |
|
$ |
562,080 |
|
|
$ |
615,326 |
|
|
$ |
592,473 |
|
|
$ |
670,295 |
|
|
$ |
557,406 |
|
|
$ |
640,798 |
|
|
$ |
636,558 |
|
|
$ |
670,891 |
|
|
Cost of goods sold |
|
|
391,824 |
|
|
|
409,513 |
|
|
|
378,148 |
|
|
|
411,622 |
|
|
|
345,371 |
|
|
|
369,198 |
|
|
|
382,047 |
|
|
|
408,190 |
|
|
Gross profit |
|
|
170,256 |
|
|
|
205,813 |
|
|
|
214,325 |
|
|
|
258,673 |
|
|
|
212,035 |
|
|
|
271,600 |
|
|
|
254,511 |
|
|
|
262,701 |
|
|
Selling, general and administrative expenses |
|
|
163,360 |
|
|
|
193,690 |
|
|
|
171,163 |
|
|
|
189,553 |
|
|
|
158,434 |
|
|
|
186,225 |
|
|
|
207,495 |
|
|
|
159,463 |
|
|
Income from operations |
|
|
6,896 |
|
|
|
12,123 |
|
|
|
43,162 |
|
|
|
69,120 |
|
|
|
53,601 |
|
|
|
85,375 |
|
|
|
47,016 |
|
|
|
103,238 |
|
|
Other expenses |
|
|
|
|
|
|
|
|
|
|
|
|
|
|
|
|
|
|
|
|
|
|
|
|
|
|
|
|
|
|
|
|
|
Interest expense—net |
|
|
12,179 |
|
|
|
14,402 |
|
|
|
18,915 |
|
|
|
17,074 |
|
|
|
17,035 |
|
|
|
17,480 |
|
|
|
19,371 |
|
|
|
21,188 |
|
|
Goodwill and tradename impairment |
|
|
— |
|
|
|
— |
|
|
|
— |
|
|
|
33,700 |
|
|
|
— |
|
|
|
— |
|
|
|
— |
|
|
|
32,086 |
|
|
Loss on extinguishment of debt |
|
|
— |
|
|
|
— |
|
|
|
4,880 |
|
|
|
— |
|
|
|
— |
|
|
|
917 |
|
|
|
— |
|
|
|
— |
|
|
Total other expenses |
|
|
12,179 |
|
|
|
14,402 |
|
|
|
23,795 |
|
|
|
50,774 |
|
|
|
17,035 |
|
|
|
18,397 |
|
|
|
19,371 |
|
|
|
53,274 |
|
|
Income (loss) before income taxes |
|
|
(5,283 |
) |
|
|
(2,279 |
) |
|
|
19,367 |
|
|
|
18,346 |
|
|
|
36,566 |
|
|
|
66,978 |
|
|
|
27,645 |
|
|
|
49,964 |
|
|
Income tax expense (benefit) |
|
|
(1,913 |
) |
|
|
5,583 |
|
|
|
6,216 |
|
|
|
18,085 |
|
|
|
8,507 |
|
|
|
2,936 |
|
|
|
5,234 |
|
|
|
13,837 |
|
|
Net income (loss) |
|
$ |
(3,370 |
) |
|
$ |
(7,862 |
) |
|
$ |
13,151 |
|
|
$ |
261 |
|
|
$ |
28,059 |
|
|
$ |
64,042 |
|
|
$ |
22,411 |
|
|
$ |
36,127 |
|
|
Comparable brand revenue growth (1) |
|
|
9 |
% |
|
|
7 |
% |
|
|
6 |
% |
|
|
2 |
% |
|
|
1 |
% |
|
|
5 |
% |
|
|
4 |
% |
|
|
5 |
% |
|
Adjusted net income (2) |
|
$ |
1,794 |
|
|
$ |
19,701 |
|
|
$ |
24,424 |
|
|
$ |
43,281 |
|
|
$ |
33,454 |
|
|
$ |
67,434 |
|
|
$ |
46,826 |
|
|
$ |
75,980 |
|
|
Adjusted EBITDA (3) |
|
$ |
29,585 |
|
|
$ |
63,439 |
|
|
$ |
73,314 |
|
|
$ |
101,932 |
|
|
$ |
78,424 |
|
|
$ |
103,008 |
|
|
$ |
87,889 |
|
|
$ |
131,449 |
|
58
|
month following the one-year anniversary of the program launch. Waterworks revenue was included in comparable brand revenue growth beginning June 2017, which is the first full month following the one-year anniversary of the acquisition. The impact on net revenues related to the product recalls in the second and fourth quarters of fiscal 2017 and second, third and fourth quarters of fiscal 2018 has been excluded from comparable brand revenue growth. Because fiscal 2017 was a 53-week year, comparable brand revenue growth percentage for the fourth quarter of fiscal 2017 excludes the extra week of revenue. |
|
(2) |
Adjusted net income is a supplemental measure of financial performance that is not required by, or presented in accordance with, GAAP. We define adjusted net income as net income (loss), adjusted for the impact of certain non-recurring and other items that we do not consider representative of our underlying operating performance. Adjusted net income is included in this filing because management believes that adjusted net income provides meaningful supplemental information for investors regarding the performance of our business and facilitates a meaningful evaluation of actual results on a comparable basis with historical results. Our management uses this non-GAAP financial measure in order to have comparable financial results to analyze changes in our underlying business from quarter to quarter. The following table presents a reconciliation of net income (loss), the most directly comparable GAAP financial measure, to adjusted net income for the periods indicated below. |
|
|
|
Fiscal 2017 |
|
|
Fiscal 2018 |
|
||||||||||||||||||||||||||
|
|
|
First Quarter |
|
|
Second Quarter |
|
|
Third Quarter |
|
|
Fourth Quarter |
|
|
First Quarter |
|
|
Second Quarter |
|
|
Third Quarter |
|
|
Fourth Quarter |
|
||||||||
|
|
|
(in thousands) |
|
|||||||||||||||||||||||||||||
|
Net income (loss) |
|
$ |
(3,370 |
) |
|
$ |
(7,862 |
) |
|
$ |
13,151 |
|
|
$ |
261 |
|
|
$ |
28,059 |
|
|
$ |
64,042 |
|
|
$ |
22,411 |
|
|
$ |
36,127 |
|
|
Adjustments pre-tax: |
|
|
|
|
|
|
|
|
|
|
|
|
|
|
|
|
|
|
|
|
|
|
|
|
|
|
|
|
|
|
|
|
|
Goodwill and tradename impairment (a) |
|
|
— |
|
|
|
— |
|
|
|
— |
|
|
|
33,700 |
|
|
|
— |
|
|
|
— |
|
|
|
— |
|
|
|
32,086 |
|
|
Amortization of debt discount (b) |
|
|
6,715 |
|
|
|
6,790 |
|
|
|
6,879 |
|
|
|
7,542 |
|
|
|
7,272 |
|
|
|
9,000 |
|
|
|
11,283 |
|
|
|
11,661 |
|
|
Asset impairments and lease losses (c) |
|
|
— |
|
|
|
— |
|
|
|
— |
|
|
|
4,417 |
|
|
|
— |
|
|
|
— |
|
|
|
3,411 |
|
|
|
3,807 |
|
|
Reorganization related costs (d) |
|
|
— |
|
|
|
— |
|
|
|
1,029 |
|
|
|
(80 |
) |
|
|
— |
|
|
|
1,721 |
|
|
|
7,564 |
|
|
|
692 |
|
|
Recall accrual (e) |
|
|
— |
|
|
|
4,733 |
|
|
|
3,552 |
|
|
|
(578 |
) |
|
|
(254 |
) |
|
|
(1,064 |
) |
|
|
3,986 |
|
|
|
(1,049 |
) |
|
Distribution center closures (f) |
|
|
— |
|
|
|
— |
|
|
|
833 |
|
|
|
4,013 |
|
|
|
(2,072 |
) |
|
|
— |
|
|
|
3,850 |
|
|
|
— |
|
|
Loss on extinguishment of debt (g) |
|
|
— |
|
|
|
— |
|
|
|
4,880 |
|
|
|
— |
|
|
|
— |
|
|
|
917 |
|
|
|
— |
|
|
|
— |
|
|
Impact of inventory step-up (h) |
|
|
1,380 |
|
|
|
480 |
|
|
|
248 |
|
|
|
419 |
|
|
|
190 |
|
|
|
190 |
|
|
|
— |
|
|
|
— |
|
|
Legal settlement (i) |
|
|
— |
|
|
|
— |
|
|
|
— |
|
|
|
— |
|
|
|
1,915 |
|
|
|
(7,204 |
) |
|
|
— |
|
|
|
— |
|
|
Anti-dumping exposure (j) |
|
|
— |
|
|
|
— |
|
|
|
— |
|
|
|
(2,202 |
) |
|
|
— |
|
|
|
— |
|
|
|
— |
|
|
|
— |
|
|
Gain on sale of building and land (k) |
|
|
— |
|
|
|
(1,300 |
) |
|
|
(819 |
) |
|
|
— |
|
|
|
— |
|
|
|
— |
|
|
|
— |
|
|
|
— |
|
|
Executive non-cash compensation (l) |
|
|
— |
|
|
|
23,872 |
|
|
|
— |
|
|
|
— |
|
|
|
— |
|
|
|
— |
|
|
|
— |
|
|
|
— |
|
|
Subtotal adjusted items |
|
|
8,095 |
|
|
|
34,575 |
|
|
|
16,602 |
|
|
|
47,231 |
|
|
|
7,051 |
|
|
|
3,560 |
|
|
|
30,094 |
|
|
|
47,197 |
|
|
Impact of income tax items (m) |
|
|
(2,931 |
) |
|
|
(7,012 |
) |
|
|
(5,329 |
) |
|
|
(4,211 |
) |
|
|
(1,656 |
) |
|
|
(168 |
) |
|
|
(5,679 |
) |
|
|
(7,344 |
) |
|
Adjusted net income |
|
$ |
1,794 |
|
|
$ |
19,701 |
|
|
$ |
24,424 |
|
|
$ |
43,281 |
|
|
$ |
33,454 |
|
|
$ |
67,434 |
|
|
$ |
46,826 |
|
|
$ |
75,980 |
|
|
|
(a) |
Represents goodwill and tradename impairment related to the Waterworks reporting unit. Refer to “Impairment” within Note 3—Significant Accounting Policies in our consolidated financial statements. |
|
|
(b) |
Under GAAP, certain convertible debt instruments that may be settled in cash on conversion are required to be separately accounted for as liability and equity components of the instrument in a manner that reflects the issuer’s non-convertible debt borrowing rate. Accordingly, in accounting for GAAP purposes for the $350 million aggregate principal amount of convertible senior notes that were issued in June 2014 (the “2019 Notes”), for the $300 million aggregate principal amount of convertible senior notes that were issued in June and July 2015 (the “2020 Notes”) and for the $335 million aggregate principal amount of convertible senior notes that were issued in June 2018 (the “2023 Notes”), we separated the 2019 Notes, 2020 Notes and 2023 Notes into liability (debt) and equity (conversion option) components and we are amortizing as debt discount an amount equal to the fair value of the equity components as interest expense on the 2019 Notes, 2020 Notes and 2023 Notes over their expected lives. The equity components represent the difference between the proceeds from the issuance of the 2019 Notes, 2020 Notes and 2023 Notes and the fair value of the liability components of the 2019 Notes, 2020 Notes and 2023 Notes, respectively. Amounts are presented net of interest capitalized for capital projects of $0.7 million, $0.8 million, $0.8 million and $0.2 million during the first, second, third and fourth quarters of fiscal 2017, respectively. Amounts are presented net of interest capitalized for capital projects of $0.6 million, $0.8 million, $0.7 million and $0.6 million during the first, second, third and fourth quarters of fiscal 2018, respectively. |
|
|
(c) |
Represents adjustments due to the remeasurement of the lease loss liability for RH Contemporary Art in the fourth quarter of fiscal 2017 and the third quarter of fiscal 2018, resulting from an update to both the timing and the amount of future estimated lease related cash inflows. The adjustment in the fourth quarter of fiscal 2018 consist of accelerated depreciation expense of $2.6 million due to a change in the estimated useful life of certain assets and a $1.2 million inventory impairment charge related to holiday merchandise. |
|
|
(d) |
Represents severance costs and related taxes associated with reorganizations, including severance related to the closure of distribution centers and the Dallas customer call center as part of our supply chain reorganization. |
|
|
(e) |
Represents a reduction of net revenues, increase in costs of goods sold and inventory charges associated with product recalls, as well as accrual adjustments and insurance recoveries related to product recalls. |
|
|
(f) |
Represents disposals of inventory and property and equipment, lease related charges, inventory transfer costs and other costs associated with distribution center closures. |
59
|
|
(h) |
Represents the non-cash amortization of the inventory fair value adjustment recorded in connection with our acquisition of Waterworks. |
|
|
(i) |
Represents a favorable legal settlement, net of related legal expenses. |
|
|
(j) |
Represents the release of the remaining reserve for potential claims regarding anti-dumping duties which we believe have lapsed. The reserve related to potential tariff obligations of one of our foreign suppliers following the U.S. Department of Commerce’s review on the anti-dumping duty order on wooden bedroom furniture from China for the period from January 1, 2011 through December 31, 2011. |
|
|
(k) |
Represents the gain on the sale of building and land of one of our previously owned retail Galleries. As we entered into a short-term lease agreement to lease the property subsequent to the sale, the total gain associated with the sale of this property was amortized over a five month period. |
|
|
(l) |
Represents a non-cash compensation charge related to a fully vested option grant made to Mr. Friedman in May 2017. |
|
|
(m) |
The adjustments to calculate income tax expense for the first and third quarters of fiscal 2017 represent the tax effect of the adjusted items based on our effective tax rates of 36.2% and 32.1%, respectively. The adjustment for the second quarter of fiscal 2017 assumes a normalized tax rate of 39%. The adjustment for the fourth quarter of fiscal 2017 is based on an adjusted tax rate of 34.0% which excludes the impact of tax reform, including the $6.0 million revaluation of the net deferred tax assets and $1.0 million transitional tax, as well as the $5.9 million tax impact associated with the Waterworks reporting unit goodwill impairment. The adjustments to calculate income tax expense for the first, second and third quarters of fiscal 2018 represent the tax effect of the adjusted items based on our effective tax rates of 23.3%, 4.4% and 18.9%, respectively. The adjustment for the fourth quarter of fiscal 2018 is based on an adjusted tax rate of 21.8% and excludes a $3.6 million tax impact associated with the Waterworks reporting unit goodwill impairment. |
|
(3) |
EBITDA and Adjusted EBITDA are supplemental measures of financial performance that are not required by, or presented in accordance with, GAAP. We define EBITDA as consolidated net income before depreciation and amortization, interest expense, goodwill and tradename impairment, loss on extinguishment of debt and provision for income taxes. Adjusted EBITDA reflects further adjustments to EBITDA to eliminate the impact of non-cash compensation, as well as certain non-recurring and other items that we do not consider representative of our underlying operating performance. EBITDA and Adjusted EBITDA are included in this filing because management believes that these metrics provide meaningful supplemental information for investors regarding the performance of our business and facilitate a meaningful evaluation of operating results on a comparable basis with historical results. Our management uses this non-GAAP financial measure in order to have comparable financial results to analyze changes in our underlying business from quarter to quarter. Our measures of EBITDA and Adjusted EBITDA are not necessarily comparable to other similarly titled captions for other companies due to different methods of calculation. The following table presents a reconciliation of net income, the most directly comparable GAAP financial measure, to EBITDA and Adjusted EBITDA for the periods indicated below. |
|
|
|
Fiscal 2017 |
|
|
Fiscal 2018 |
|
||||||||||||||||||||||||||
|
|
|
First Quarter |
|
|
Second Quarter |
|
|
Third Quarter |
|
|
Fourth Quarter |
|
|
First Quarter |
|
|
Second Quarter |
|
|
Third Quarter |
|
|
Fourth Quarter |
|
||||||||
|
|
|
(in thousands) |
|
|||||||||||||||||||||||||||||
|
Net income (loss) |
|
$ |
(3,370 |
) |
|
$ |
(7,862 |
) |
|
$ |
13,151 |
|
|
$ |
261 |
|
|
$ |
28,059 |
|
|
$ |
64,042 |
|
|
$ |
22,411 |
|
|
$ |
36,127 |
|
|
Depreciation and amortization |
|
|
16,020 |
|
|
|
16,526 |
|
|
|
18,546 |
|
|
|
19,043 |
|
|
|
17,047 |
|
|
|
17,756 |
|
|
|
18,377 |
|
|
|
21,166 |
|
|
Interest expense—net |
|
|
12,179 |
|
|
|
14,402 |
|
|
|
18,915 |
|
|
|
17,074 |
|
|
|
17,035 |
|
|
|
17,480 |
|
|
|
19,371 |
|
|
|
21,188 |
|
|
Goodwill and tradename impairment (a) |
|
|
— |
|
|
|
— |
|
|
|
— |
|
|
|
33,700 |
|
|
|
— |
|
|
|
— |
|
|
|
— |
|
|
|
32,086 |
|
|
Loss on extinguishment of debt (a) |
|
|
— |
|
|
|
— |
|
|
|
4,880 |
|
|
|
— |
|
|
|
— |
|
|
|
917 |
|
|
|
— |
|
|
|
— |
|
|
Income tax (expense) benefit |
|
|
(1,913 |
) |
|
|
5,583 |
|
|
|
6,216 |
|
|
|
18,085 |
|
|
|
8,507 |
|
|
|
2,936 |
|
|
|
5,234 |
|
|
|
13,837 |
|
|
EBITDA |
|
|
22,916 |
|
|
|
28,649 |
|
|
|
61,708 |
|
|
|
88,163 |
|
|
|
70,648 |
|
|
|
103,131 |
|
|
|
65,393 |
|
|
|
124,404 |
|
|
Non-cash compensation (b) |
|
|
5,289 |
|
|
|
30,877 |
|
|
|
6,763 |
|
|
|
7,780 |
|
|
|
7,997 |
|
|
|
6,234 |
|
|
|
3,685 |
|
|
|
6,206 |
|
|
Asset impairment and lease losses (a) |
|
|
— |
|
|
|
— |
|
|
|
— |
|
|
|
4,417 |
|
|
|
— |
|
|
|
— |
|
|
|
3,411 |
|
|
|
1,196 |
|
|
Reorganization related costs (a) |
|
|
— |
|
|
|
— |
|
|
|
1,029 |
|
|
|
(80 |
) |
|
|
— |
|
|
|
1,721 |
|
|
|
7,564 |
|
|
|
692 |
|
|
Recall accrual (a) |
|
|
— |
|
|
|
4,733 |
|
|
|
3,552 |
|
|
|
(578 |
) |
|
|
(254 |
) |
|
|
(1,064 |
) |
|
|
3,986 |
|
|
|
(1,049 |
) |
|
Distribution center closures (a) |
|
|
— |
|
|
|
— |
|
|
|
833 |
|
|
|
4,013 |
|
|
|
(2,072 |
) |
|
|
— |
|
|
|
3,850 |
|
|
|
— |
|
|
Impact of inventory step-up (a) |
|
|
1,380 |
|
|
|
480 |
|
|
|
248 |
|
|
|
419 |
|
|
|
190 |
|
|
|
190 |
|
|
|
— |
|
|
|
— |
|
|
Legal settlement (a) |
|
|
— |
|
|
|
— |
|
|
|
— |
|
|
|
— |
|
|
|
1,915 |
|
|
|
(7,204 |
) |
|
|
— |
|
|
|
— |
|
|
Anti-dumping exposure (a) |
|
|
— |
|
|
|
— |
|
|
|
— |
|
|
|
(2,202 |
) |
|
|
— |
|
|
|
— |
|
|
|
— |
|
|
|
— |
|
|
Gain on sale of building and land (a) |
|
|
— |
|
|
|
(1,300 |
) |
|
|
(819 |
) |
|
|
— |
|
|
|
— |
|
|
|
— |
|
|
|
— |
|
|
|
— |
|
|
Adjusted EBITDA |
|
$ |
29,585 |
|
|
$ |
63,439 |
|
|
$ |
73,314 |
|
|
$ |
101,932 |
|
|
$ |
78,424 |
|
|
$ |
103,008 |
|
|
$ |
87,889 |
|
|
$ |
131,449 |
|
|
|
(a) |
Refer to the reconciliation of net income (loss) to adjusted net income table above and the related footnotes for additional information. |
|
|
(b) |
Represents non-cash compensation related to equity awards granted to employees. The adjustment for the second quarter of fiscal 2017 includes a non-cash compensation charge related to a fully vested option grant made to Mr. Friedman in May 2017. |
60
Liquidity and Capital Resources
General
The primary cash needs of our business have historically been for merchandise inventories, payroll, Source Books, store rent, capital expenditures associated with opening new stores and updating existing stores, as well as the development of our infrastructure and information technology. We seek out and evaluate opportunities for effectively managing and deploying capital in ways that improve working capital and support and enhance our business initiatives and strategies. In fiscal 2017, we completed two share repurchase programs in an aggregate amount of $1 billion. A $300 million share repurchase was completed during the first quarter of fiscal 2017 and a $700 million share repurchase was completed during the second quarter of fiscal 2017. In October 2018, our Board of Directors approved a new $700 million share repurchase program, pursuant to which, during fiscal 2018, we repurchased approximately 2.0 million shares of our common stock for an aggregate repurchase amount of approximately $250 million. Refer to “Share Repurchase Programs” below. We intend to evaluate our capital allocation from time to time and may engage in future share repurchases in circumstances where buying shares of our common stock represents a good value and provides a favorable return for our shareholders.
We have $985 million in aggregate principal amount of convertible notes outstanding, of which $350 million mature in June 2019, $300 million mature in June 2020 and $335 million mature in June 2023. In addition, the $350 million principal amount of convertible senior notes that matures in June 2019 becomes convertible by the holders on and after March 15, 2019 through the close of business on the second schedule trading day immediately preceding June 15, 2019. At the time the notes become due, and prior to maturity to the extent the notes become convertible and a holder exercises such conversion right, the trading price of our common stock may be such that we find it necessary to settle the notes in cash. Based on free cash flow of $163 million in fiscal 2018 and anticipated strong cash flow generation in 2019 and beyond, we expect to repay the outstanding principal of our $985 million convertible notes at maturity in June 2019, June 2020 and June 2023 in cash to minimize dilution. While we anticipate using free cash flow and borrowings on our revolving line of credit to repay the convertible notes in cash to minimize dilution, we may need to pursue additional sources of liquidity to repay such convertible notes in cash at their respective maturity dates. There can be no assurance as to the availability of capital to fund such repayments, or that if capital is available through additional debt issuances or refinancing of the convertible notes, that such capital will be available on terms that are favorable to us. We believe the strength of our business and the reduction in leverage we have achieved during the past year puts us in a strong position to take advantage of the capital markets opportunistically. We believe we have multiple financing alternatives available to us on favorable terms that could provide us with additional financial flexibility with respect to capital allocation.
We extended and amended our revolving line of credit in June 2017, which has a total availability of $600.0 million, of which $10.0 million is available to Restoration Hardware Canada, Inc., and includes a $200.0 million accordion feature under which the revolving line of credit may be expanded by agreement of the parties from $600.0 million to up to $800.0 million if and to the extent the lenders revise their credit commitments to encompass a larger facility. The revolving line of credit has a maturity date of June 28, 2022.
We believe that cash expected to be generated from operations, net cash proceeds from the issuance of the convertible senior notes, borrowing availability under the asset based credit facility and other financing arrangements will be sufficient to meet working capital requirements, anticipated capital expenditures and other capital needs for the next 12 months.
Our business has relied on cash flows from operations, net cash proceeds from the issuance of the convertible senior notes, as well as borrowings under our credit facilities as our primary sources of liquidity. We have pursued in the past, and may pursue in the future, additional strategies to generate liquidity for our operations, including through the strategic sale of assets, utilization of our credit facilities, and entry into new debt financing arrangements that present attractive terms.
During the first quarter of fiscal 2017, we received cash of $4.9 million for the sale of an aircraft, net of $0.3 million of costs to dispose of the aircraft, which was classified as an asset held for sale, and during the second quarter of fiscal 2017 we received cash of $10.2 million for the sale of a real estate parcel that we owned on which one of our retail Galleries was located, which was classified as an asset held for sale. We may in the future pursue additional strategies, through the use of existing assets and debt facilities, or through the pursuit of new external sources of liquidity and debt financings, to fund our strategies to enhance stockholder value. There can be no assurance that additional capital, whether raised through the sale of assets, utilization of our existing debt financing sources, or pursuit of additional debt financing sources, will be available to us on a timely manner, on favorable terms or at all. To the extent we pursue additional debt as a source of liquidity, our capitalization profile may change and may include significant leverage, and as a result we may be required to use future liquidity to repay such indebtedness and may be subject to additional terms and restrictions which affect our operations and future uses of capital.
61
In addition, our capital needs may change in the future due to changes in our business or new opportunities that we choose to pursue. We have invested significant capital expenditures in remodeling and opening new Design Galleries, and these capital expenditures have increased in the past and may continue to increase in future periods as we open additional Design Galleries, which may require us to undertake upgrades to historical buildings or construction of new buildings. During fiscal 2018, our investments in capital expenditures totaled $136.7 million.
We anticipate our gross capital expenditures to be $165 million to $185 million in fiscal 2019, primarily related to our efforts to continue our growth and expansion, including construction of new Design Galleries and infrastructure investments. We anticipate that our fiscal 2019 capital expenditures will be partially offset by proceeds from sales of assets of $50 million to $60 million.
Certain of our current lease arrangements for our new Design Galleries require the landlord to fund a portion of the construction related costs directly to third parties, rather than through traditional construction allowances and accordingly, we do not expect to receive contributions directly from our landlords related to the building of our Design Galleries under these arrangements. Other lease arrangements require the landlord to fund a portion of the construction related costs through payments directly to us. As we develop new Galleries, as well as other potential strategic initiatives in the future like our integrated hospitality experience, we may explore other models for our real estate, which could include longer lease terms or further purchases of, or joint ventures or other forms of equity ownership in, real estate interests associated with new sites and buildings. These approaches might require greater capital investment on our part than a traditional store lease with a landlord. We also believe there is an opportunity to transition our real estate strategy from a leasing model to a development model, where we potentially buy and develop our Design Galleries then recoup the investments through a sale leaseback arrangement resulting in lower capital investment and lower rent. In the event that such capital and other expenditures require us to pursue additional funding sources, we can provide no assurances that we will be successful in securing additional funding on attractive terms or at all.
There can be no assurance that we will have sufficient financial resources, or will be able to arrange financing on favorable terms to the extent necessary to fund all of our initiatives, or that sufficient incremental debt will be available to us in order to fund our cash payments in respect of the repayment of our outstanding convertible senior notes in an aggregate principal amount of $985 million at maturity of such senior convertible notes. In addition, agreements governing existing or new debt facilities may restrict our ability to operate our business in the manner we currently expect or to make required payments with respect to existing commitments including the repayment of the principal amount of our convertible senior notes in cash upon maturity of such senior notes. To the extent we need to seek waivers from any provider of debt financing, or we fail to observe the covenants or other requirements of existing or new debt facilities, any such event could have an impact on our other commitments and obligations including triggering cross defaults or other consequences with respect to other indebtedness. Our current level of indebtedness, and any additional indebtedness that we may incur, exposes us to certain risks with regards to interest rate increases and fluctuations. Our ability to make interest payments or to refinance any of our indebtedness to manage such interest rates may be limited or negatively affected by credit market conditions, macroeconomic trends and other risks.
Any weakening of, or other adverse developments in, the U.S. or global credit markets could affect our ability to manage our debt obligations and our ability to access future debt. We cannot assure you that we will be able to raise necessary funds on favorable terms, if at all, or that future financing requirements would not require us to raise money through an equity financing or by other means that could be dilutive to holders of our capital stock. If we fail to raise sufficient additional funds, we may be required to delay or abandon some of our planned future expenditures or aspects of our current operations.
Cash Flow Analysis
A summary of operating, investing, and financing activities is set forth in the following table:
|
|
|
Year Ended |
|
|||||||||
|
|
|
February 2, |
|
|
February 3, |
|
|
January 28, |
|
|||
|
|
|
2019 |
|
|
2018 |
|
|
2017 |
|
|||
|
|
|
(in thousands) |
|
|||||||||
|
Provided by operating activities |
|
$ |
300,556 |
|
|
$ |
556,817 |
|
|
$ |
80,512 |
|
|
Provided by (used in) investing activities |
|
|
(136,736 |
) |
|
|
44,691 |
|
|
|
(310,504 |
) |
|
Used in financing activities |
|
|
(183,201 |
) |
|
|
(691,413 |
) |
|
|
(2,241 |
) |
|
Decrease in cash and cash equivalents and restricted cash equivalents |
|
|
(19,511 |
) |
|
|
(89,753 |
) |
|
|
(231,784 |
) |
|
Cash and cash equivalents and restricted cash equivalents at end of period |
|
|
5,803 |
|
|
|
25,314 |
|
|
|
115,067 |
|
62
Net Cash Provided By Operating Activities
Operating activities consist primarily of net income adjusted for non-cash items including depreciation and amortization, impairments, stock-based compensation, amortization of debt discount and the effect of changes in working capital and other activities.
For fiscal 2018, net cash provided by operating activities was $300.6 million and consisted of net income of $150.6 million, non-cash items of $190.8 million, partially offset by an increase in cash used for working capital and other activities of $40.8 million. Working capital and other activities consisted primarily of increases in prepaid expenses and other current assets of $28.5 million related to (i) adoption of Topic 606, (ii) vendor deposits and (iii) federal and state tax receivables due to prepayments, increases in accounts receivable of $8.9 million and increases in inventory of $7.4 million. These decreases to working capital were partially offset by increases in deferred revenue and customer deposits of $8.4 million.
For fiscal 2017, net cash provided by operating activities was $556.8 million and consisted of net income of $2.2 million, non-cash items of $218.6 million and a decrease in cash used for working capital and other activities of $336.0 million. Working capital and other activities consisted primarily of decreases in inventory of $220.8 million due to our SKU rationalization initiative, outlet inventory optimization efforts and revised supply chain strategy, as well as increases in accounts payable and accrued liabilities of $64.5 million related to timing of payments. We also had decreases in prepaid expenses and other current assets of $44.3 million primarily due to amortization of our capitalized catalog costs, reduction in prepaid rent and a reduction of federal and state tax receivables.
For fiscal 2016, net cash provided by operating activities was $80.5 million and consisted of net income of $5.4 million and non-cash items of $150.8 million, partially offset by an increase in cash used for working capital and other activities of $75.7 million. Working capital and other activities consisted primarily of decreases in accounts payable and accrued liabilities of $50.3 million related to timing of payments, increases in prepaid expenses of $35.2 million related to the timing of the distribution of our Interiors Source Book and estimated federal tax payments and decreases in other current liabilities of $23.8 million related to payments for federal and state tax liabilities. This was partially offset by increases in deferred revenue and customer deposits of $24.0 million and an increase in other non-current obligations of $8.7 million primarily due to a deferred contract incentive payment.
Net Cash Provided By (Used In) Investing Activities
Investing activities consist primarily of investments in capital expenditures related to new Design Galleries, investments in supply chain and systems infrastructure, acquisition of businesses, as well as activities associated with investing in available-for-sale securities.
For fiscal 2018, net cash used in investing activities was $136.7 million due to investments in new Galleries, information technology and systems infrastructure, and supply chain investments.
For fiscal 2017, net cash provided by investing activities was $44.7 million primarily as a result of sales and maturities of investments in available-for-sale securities of $145.0 million and $46.9 million, respectively, the proceeds of which were used to fund the share repurchases made under the Fiscal 2017 $300 Million Repurchase Program. In addition, we had net proceeds from the sale of building and land and the sale of an aircraft of $10.2 million and $4.9 million, respectively. These increases to cash were partially offset by investments in new Galleries, information technology and systems infrastructure, and supply chain investments of $146.2 million and purchases of investments in available-for-sale securities of $16.1 million.
For fiscal 2016, net cash used in investing activities was $310.5 million primarily due to $170.0 million of investments in new Galleries, information technology and systems infrastructure, supply chain, and other corporate assets, as well as our acquisition of Waterworks, net of cash acquired, of $116.1 million. In addition, we made purchases of investments in available-for-sale securities of $248.5 million, partially offset by maturities and sales of such investments of $187.3 million and $37.1 million, respectively.
Net Cash Used In Financing Activities
Financing activities consist primarily of borrowings related to the convertible senior notes offerings, credit facilities and other financing arrangements, as well as share repurchases and other equity related transactions.
63
For fiscal 2018, net cash used in financing activities was $183.2 million primarily due to net repayments of debt of $254.4 million under the asset based credit facility, LILO term loan, equipment loans and promissory note secured by our aircraft, as well as due to $250 million of share repurchases made under the Fiscal 2018 $700 Million Repurchase Program. The repayments of debt described above were partially funded by the $335 million convertible senior notes issued in June 2018, which provided net proceeds of $287.8 million after taking into consideration the convertible note hedge and warrant transactions, as well as discounts upon original issuance and offering costs. Equity related transactions provided $34.5 million due to $44.0 million of proceeds from exercise of employee stock options, partially offset by $9.5 million of cash paid for employee taxes related to net settlement of equity awards
For fiscal 2017, net cash used in financing activities was $691.4 million primarily due to $1.0 billion of share repurchases made under the Fiscal 2017 $300 Million Repurchase Program and Fiscal 2017 $700 Million Repurchase Program. Cash funding for the share repurchase programs was provided by available cash balances, net borrowings under the asset based credit facility of $200.0 million, as well as borrowings under the term loans of $180.0 million, borrowings under loans secured by certain equipment of $20.0 million and borrowings under a promissory note secured by our aircraft of $14.0 million. Proceeds from exercise of employee stock options were $24.9 million. The cash provided by these financing activities was partially offset by the repayment of the second lien term loan, including the prepayment penalty, of $103.0 million, $10.2 million of payments on build-to-suit lease transactions, debt issuance costs of $8.3 million and $5.8 million cash paid for employee taxes related to net settlement of equity awards.
For fiscal 2016, net cash used in financing activities was $2.2 million primarily due to tax shortfalls from the exercise of stock options of $3.3 million and cash paid for employee taxes related to net settlement of equity awards of $1.6 million. The cash used in these financing activities was partially offset by net proceeds from the exercise of stock options of $3.3 million.
Non-Cash Transactions
Non-cash transactions consist of non-cash additions of property and equipment and the issuance of notes payable related to share repurchases from former employees.
Build-to-Suit Lease Transactions
The non-cash additions of property and equipment due to build-to-suit lease transactions are the result of the accounting requirements of Accounting Standards Codification (“ASC”) 840—Leases (“ASC 840”) for those construction projects for which we are the “deemed owner” of the construction project given the extent to which we are involved in constructing the leased asset. If we are the “deemed owner” for accounting purposes, upon commencement of the construction project, we are required to capitalize contributions by the landlord toward construction as property and equipment on our consolidated balance sheets. The contributions by the landlord toward construction, including the building, existing site improvements at construction commencement and any amounts paid by the landlord to those responsible for construction, are included as property and equipment additions due to build-to-suit lease transactions within the non-cash section of our consolidated statements of cash flows.
Over the lease term, these non-cash additions to property and equipment due to build-to-suit lease transactions do not impact our cash outflows, nor do they impact net income within our consolidated statements of income.
Convertible Senior Notes
0.00% Convertible Senior Notes due 2023
In June 2018, we issued in a private offering $300 million principal amount of 0.00% convertible senior notes due 2023 and issued an additional $35 million principal amount in connection with the overallotment option granted to the initial purchasers as part of the offering (collectively, the “2023 Notes”). The 2023 Notes are governed by the terms of an indenture between us and U.S. Bank National Association, as the Trustee. The 2023 Notes will mature on June 15, 2023, unless earlier purchased by us or converted. The 2023 Notes will not bear interest, except that the 2023 Notes will be subject to “special interest” in certain limited circumstances in the event of our failure to perform certain of our obligations under the indenture governing the 2023 Notes. The 2023 Notes are unsecured obligations and do not contain any financial covenants or restrictions on the payments of dividends, the incurrence of indebtedness or the issuance or repurchase of securities by us or any of our subsidiaries. Certain events are also considered “events of default” under the 2023 Notes, which may result in the acceleration of the maturity of the 2023 Notes, as described in the indenture governing the 2023 Notes.
The initial conversion rate applicable to the 2023 Notes is 5.1640 shares of common stock per $1,000 principal amount of 2023 Notes, which is equivalent to an initial conversion price of approximately $193.65 per share. The conversion rate will be subject to adjustment upon the occurrence of certain specified events, but will not be adjusted for any accrued and unpaid special interest. In addition, upon the occurrence of a “make-whole fundamental change” as defined in the indenture, we will, in certain circumstances, increase the conversion rate by a number of additional shares for a holder that elects to convert its 2023 Notes in connection with such make-whole fundamental change.
64
Prior to March 15, 2023, the 2023 Notes will be convertible only under the following circumstances: (1) during any calendar quarter commencing after September 30, 2018, if, for at least 20 trading days (whether or not consecutive) during the 30 consecutive trading day period ending on the last trading day of the immediately preceding calendar quarter, the last reported sale price of our common stock on such trading day is greater than or equal to 130% of the applicable conversion price on such trading day; (2) during the five consecutive business day period after any ten consecutive trading day period in which, for each day of that period, the trading price per $1,000 principal amount of 2023 Notes for such trading day was less than 98% of the product of the last reported sale price of our common stock and the applicable conversion rate on such trading day; or (3) upon the occurrence of specified corporate transactions. As of February 2, 2019, none of these conditions have occurred and, as a result, the 2023 Notes are not convertible as of February 2, 2019. On and after March 15, 2023, until the close of business on the second scheduled trading day immediately preceding the maturity date, holders may convert all or a portion of their 2023 Notes at any time, regardless of the foregoing circumstances. Upon conversion, the 2023 Notes will be settled, at our election, in cash, shares of our common stock, or a combination of cash and shares of our common stock.
We may not redeem the 2023 Notes; however, upon the occurrence of a fundamental change (as defined in the indenture governing the notes), holders may require us to purchase all or a portion of their 2023 Notes for cash at a price equal to 100% of the principal amount of the 2023 Notes to be purchased plus any accrued and unpaid special interest to, but excluding, the fundamental change purchase date.
Under GAAP, certain convertible debt instruments that may be settled in cash on conversion are required to be separately accounted for as liability and equity components of the instrument in a manner that reflects the issuer’s non-convertible debt borrowing rate. Accordingly, in accounting for the issuance of the 2023 Notes, we separated the 2023 Notes into liability and equity components. The carrying amount of the liability component was calculated by measuring the fair value of a similar liability that does not have an associated convertible feature. The carrying amount of the equity component, which is recognized as a debt discount, represents the difference between the proceeds from the issuance of the 2023 Notes and the fair value of the liability component of the 2023 Notes. The excess of the principal amount of the liability component over its carrying amount (“debt discount”) will be amortized to interest expense using an effective interest rate of 6.35% over the expected life of the 2023 Notes. The equity component is not remeasured as long as it continues to meet the conditions for equity classification.
In accounting for the debt issuance costs related to the issuance of the 2023 Notes, we allocated the total amount incurred to the liability and equity components based on their relative values. Debt issuance costs attributable to the liability component are amortized to interest expense using the effective interest method over the expected life of the 2023 Notes, and debt issuance costs attributable to the equity component are netted with the equity component in stockholders’ equity (deficit).
Debt issuance costs related to the 2023 Notes were comprised of discounts upon original issuance of $1.7 million and third party offering costs of $4.6 million. Discounts and third party offering costs attributable to the liability component were recorded as a contra-liability and are presented net against the convertible senior notes due 2023 balance on the consolidated balance sheets.
2023 Notes—Convertible Bond Hedge and Warrant Transactions
In connection with the offering of the 2023 Notes and the exercise of the overallotment option in June 2018, we entered into convertible note hedge transactions whereby we have the option to purchase a total of approximately 1.7 million shares of our common stock at a price of approximately $193.65 per share. The total cost of the convertible note hedge transactions was $91.9 million. In addition, we sold warrants whereby the holders of the warrants have the option to purchase a total of approximately 1.7 million shares of our common stock at a price of $309.84 per share. The warrants contain certain adjustment mechanisms whereby the total number of shares to be purchased under such warrants may be increased up to a cap of 3.5 million shares of common stock (which cap may also be subject to adjustment). We received $51.0 million in cash proceeds from the sale of these warrants. Taken together, the purchase of the convertible note hedges and sale of the warrants are intended to offset any actual earnings dilution from the conversion of the 2023 Notes until our common stock is above approximately $309.84 per share. As these transactions meet certain accounting criteria, the convertible note hedges and warrants are recorded in stockholders’ equity (deficit), are not accounted for as derivatives and are not remeasured each reporting period. The net costs incurred in connection with the convertible note hedge and warrant transactions were recorded as a reduction to additional paid-in capital on the consolidated balance sheets.
We recorded a deferred tax liability of $22.3 million in connection with the debt discount associated with the 2023 Notes and recorded a deferred tax asset of $22.5 million in connection with the convertible note hedge transactions. The deferred tax liability and deferred tax asset are recorded in deferred tax assets on the consolidated balance sheets.
65
0.00% Convertible Senior Notes due 2020
In June 2015, we issued in a private offering $250 million principal amount of 0.00% convertible senior notes due 2020 and, in July 2015, we issued an additional $50 million principal amount pursuant to the exercise of the overallotment option granted to the initial purchasers as part of our June 2015 offering (collectively, the “2020 Notes”). The 2020 Notes are governed by the terms of an indenture between us and U.S. Bank National Association, as the Trustee. The 2020 Notes will mature on July 15, 2020, unless earlier purchased by us or converted. The 2020 Notes will not bear interest, except that the 2020 Notes will be subject to “special interest” in certain limited circumstances in the event of our failure to perform certain of our obligations under the indenture governing the 2020 Notes. The 2020 Notes are unsecured obligations and do not contain any financial covenants or restrictions on the payments of dividends, the incurrence of indebtedness or the issuance or repurchase of securities by us or any of our subsidiaries. Certain events are also considered “events of default” under the 2020 Notes, which may result in the acceleration of the maturity of the 2020 Notes, as described in the indenture governing the 2020 Notes. The 2020 Notes are guaranteed by our primary operating subsidiary, Restoration Hardware, Inc., as Guarantor. The guarantee is the unsecured obligation of the Guarantor and is subordinated to the Guarantor’s obligations from time to time with respect to its credit agreement and ranks equal in right of payment with respect to Guarantor’s other obligations.
The initial conversion rate applicable to the 2020 Notes is 8.4656 shares of common stock per $1,000 principal amount of 2020 Notes, which is equivalent to an initial conversion price of approximately $118.13 per share. The conversion rate will be subject to adjustment upon the occurrence of certain specified events, but will not be adjusted for any accrued and unpaid special interest. In addition, upon the occurrence of a “make-whole fundamental change” as defined in the indenture, we will, in certain circumstances, increase the conversion rate by a number of additional shares for a holder that elects to convert its 2020 Notes in connection with such make-whole fundamental change.
Prior to March 15, 2020, the 2020 Notes will be convertible only under the following circumstances: (1) during any calendar quarter commencing after September 30, 2015, if, for at least 20 trading days (whether or not consecutive) during the 30 consecutive trading day period ending on the last trading day of the immediately preceding calendar quarter, the last reported sale price of our common stock on such trading day is greater than or equal to 130% of the applicable conversion price on such trading day; (2) during the five consecutive business day period after any ten consecutive trading day period in which, for each day of that period, the trading price per $1,000 principal amount of 2020 Notes for such trading day was less than 98% of the product of the last reported sale price of our common stock and the applicable conversion rate on such trading day; or (3) upon the occurrence of specified corporate transactions. As of February 2, 2019, none of these conditions have occurred and, as a result, the 2020 Notes are not convertible as of February 2, 2019. On and after March 15, 2020, until the close of business on the second scheduled trading day immediately preceding the maturity date, holders may convert all or a portion of their 2020 Notes at any time, regardless of the foregoing circumstances. Upon conversion, the 2020 Notes will be settled, at our election, in cash, shares of our common stock, or a combination of cash and shares of our common stock.
We may not redeem the 2020 Notes; however, upon the occurrence of a fundamental change (as defined in the indenture governing the notes), holders may require us to purchase all or a portion of their 2020 Notes for cash at a price equal to 100% of the principal amount of the 2020 Notes to be purchased plus any accrued and unpaid special interest to, but excluding, the fundamental change purchase date.
Under GAAP, certain convertible debt instruments that may be settled in cash on conversion are required to be separately accounted for as liability and equity components of the instrument in a manner that reflects the issuer’s non-convertible debt borrowing rate. Accordingly, in accounting for the issuance of the 2020 Notes, we separated the 2020 Notes into liability and equity components. The carrying amount of the liability component was calculated by measuring the fair value of a similar liability that does not have an associated convertible feature. The carrying amount of the equity component, which is recognized as a debt discount, represents the difference between the proceeds from the issuance of the 2020 Notes and the fair value of the liability component of the 2020 Notes. The debt discount will be amortized to interest expense using an effective interest rate of 6.47% over the expected life of the 2020 Notes. The equity component is not remeasured as long as it continues to meet the conditions for equity classification.
In accounting for the debt issuance costs related to the issuance of the 2020 Notes, we allocated the total amount incurred to the liability and equity components based on their relative values. Debt issuance costs attributable to the liability component are amortized to interest expense using the effective interest method over the expected life of the 2020 Notes, and debt issuance costs attributable to the equity component are netted with the equity component in stockholders’ equity (deficit).
Debt issuance costs related to the 2020 Notes were comprised of discounts upon original issuance of $3.8 million and third party offering costs of $2.3 million. Discounts and third party offering costs attributable to the liability component were recorded as a contra-liability and are presented net against the convertible senior notes due 2020 balance on the consolidated balance sheets.
66
2020 Notes—Convertible Bond Hedge and Warrant Transactions
In connection with the offering of the 2020 Notes in June 2015 and the exercise in full of the overallotment option in July 2015, we entered into convertible note hedge transactions whereby we have the option to purchase a total of approximately 2.5 million shares of our common stock at a price of approximately $118.13 per share. The total cost of the convertible note hedge transactions was $68.3 million. In addition, we sold warrants whereby the holders of the warrants have the option to purchase a total of approximately 2.5 million shares of our common stock at a price of $189.00 per share. The warrants contain certain adjustment mechanisms whereby the total number of shares to be purchased under such warrants may be increased up to a cap of 5.1 million shares of common stock (which cap may also be subject to adjustment). We received $30.4 million in cash proceeds from the sale of these warrants. Taken together, the purchase of the convertible note hedges and sale of the warrants are intended to offset any actual earnings dilution from the conversion of the 2020 Notes until our common stock is above approximately $189.00 per share. As these transactions meet certain accounting criteria, the convertible note hedges and warrants are recorded in stockholders’ equity (deficit), are not accounted for as derivatives and are not remeasured each reporting period. The net costs incurred in connection with the convertible note hedge and warrant transactions were recorded as a reduction to additional paid-in capital on the consolidated balance sheets.
We recorded a deferred tax liability of $32.8 million in connection with the debt discount associated with the 2020 Notes and recorded a deferred tax asset of $26.6 million in connection with the convertible note hedge transactions. The deferred tax liability and deferred tax asset are recorded in deferred tax assets on the consolidated balance sheets.
Our provision for income taxes in fiscal 2017 included $1.1 million of income tax benefit as a result of the Tax Act for the provisional re-measurement of the deferred tax asset and liability related to the 2020 Notes for the reduction in the U.S. corporate income tax rate from 35% to 21%.
0.00% Convertible Senior Notes due 2019
In June 2014, we issued $350 million aggregate principal amount of 0.00% convertible senior notes due 2019 (the “2019 Notes”) in a private offering. The 2019 Notes are governed by the terms of an indenture between us and U.S. Bank National Association, as the Trustee. The 2019 Notes will mature on June 15, 2019, unless earlier purchased by us or converted. The 2019 Notes will not bear interest, except that the 2019 Notes will be subject to “special interest” in certain limited circumstances in the event of our failure to perform certain of our obligations under the indenture governing the 2019 Notes. The 2019 Notes are unsecured obligations and do not contain any financial covenants or restrictions on the payments of dividends, the incurrence of indebtedness or the issuance or repurchase of securities by us or any of our subsidiaries. Certain events are also considered “events of default” under the 2019 Notes, which may result in the acceleration of the maturity of the 2019 Notes, as described in the indenture governing the 2019 Notes.
The initial conversion rate applicable to the 2019 Notes is 8.6143 shares of common stock per $1,000 principal amount of 2019 Notes, which is equivalent to an initial conversion price of approximately $116.09 per share. The conversion rate will be subject to adjustment upon the occurrence of certain specified events, but will not be adjusted for any accrued and unpaid special interest. In addition, upon the occurrence of a “make-whole fundamental change,” we will, in certain circumstances, increase the conversion rate by a number of additional shares for a holder that elects to convert its 2019 Notes in connection with such make-whole fundamental change.
Prior to March 15, 2019, the 2019 Notes will be convertible only under the following circumstances: (1) during any calendar quarter commencing after September 30, 2014, if, for at least 20 trading days (whether or not consecutive) during the 30 consecutive trading day period ending on the last trading day of the immediately preceding calendar quarter, the last reported sale price of our common stock on such trading day is greater than or equal to 130% of the applicable conversion price on such trading day; (2) during the five consecutive business day period after any ten consecutive trading day period in which, for each day of that period, the trading price per $1,000 principal amount of 2019 Notes for such trading day was less than 98% of the product of the last reported sale price of our common stock and the applicable conversion rate on such trading day; or (3) upon the occurrence of specified corporate transactions. As of February 2, 2019, none of these conditions have occurred and, as a result, the 2019 Notes are not convertible as of February 2, 2019. On and after March 15, 2019, until the close of business on the second scheduled trading day immediately preceding the maturity date, holders may convert all or a portion of their 2019 Notes at any time, regardless of the foregoing circumstances. Upon conversion, the 2019 Notes will be settled, at our election, in cash, shares of our common stock, or a combination of cash and shares of our common stock.
67
We may not redeem the 2019 Notes; however, upon the occurrence of a fundamental change (as defined in the indenture governing the notes), holders may require us to purchase all or a portion of their 2019 Notes for cash at a price equal to 100% of the principal amount of the 2019 Notes to be purchased plus any accrued and unpaid special interest to, but excluding, the fundamental change purchase date.
Under GAAP, certain convertible debt instruments that may be settled in cash on conversion are required to be separately accounted for as liability and equity components of the instrument in a manner that reflects the issuer’s non-convertible debt borrowing rate. Accordingly, in accounting for the issuance of the 2019 Notes, we separated the 2019 Notes into liability and equity components. The carrying amount of the liability component was calculated by measuring the fair value of a similar liability that does not have an associated convertible feature. The carrying amount of the equity component, which is recognized as a debt discount, represents the difference between the proceeds from the issuance of the 2019 Notes and the fair value of the liability component of the 2019 Notes. The debt discount will be amortized to interest expense using an effective interest rate of 4.51% over the expected life of the 2019 Notes. The equity component is not remeasured as long as it continues to meet the conditions for equity classification.
In accounting for the debt issuance costs related to the issuance of the 2019 Notes, we allocated the total amount incurred to the liability and equity components based on their relative values. Debt issuance costs attributable to the liability component are amortized to interest expense using the effective interest method over the expected life of the 2019 Notes, and debt issuance costs attributable to the equity component are netted with the equity component in stockholders’ equity (deficit).
Debt issuance costs related to the 2019 Notes were comprised of discounts and commissions payable to the initial purchasers of $4.4 million and third party offering costs of $1.0 million. Discounts, commissions payable to the initial purchasers and third party offering costs attributable to the liability component were recorded as a contra-liability and are presented net against the convertible senior notes due 2019 balance on the consolidated balance sheets.
2019 Notes—Convertible Bond Hedge and Warrant Transactions
In connection with the offering of the 2019 Notes, we entered into convertible note hedge transactions whereby we have the option to purchase a total of approximately 3.0 million shares of our common stock at a price of approximately $116.09 per share. The total cost of the convertible note hedge transactions was $73.3 million. In addition, we sold warrants whereby the holders of the warrants have the option to purchase a total of approximately 3.0 million shares of our common stock at a price of $171.98 per share. The warrants contain certain adjustment mechanisms whereby the total number of shares to be purchased under such warrants may be increased up to a cap of 6.0 million shares of common stock (which cap may also be subject to adjustment). We received $40.4 million in cash proceeds from the sale of these warrants. Taken together, the purchase of the convertible note hedges and sale of the warrants are intended to offset any actual dilution from the conversion of the 2019 Notes and to effectively increase the overall conversion price from $116.09 per share to $171.98 per share. As these transactions meet certain accounting criteria, the convertible note hedges and warrants are recorded in stockholders’ equity (deficit) and are not accounted for as derivatives. The net costs incurred in connection with the convertible note hedge and warrant transactions were recorded as a reduction to additional paid-in capital on the consolidated balance sheets.
We recorded a deferred tax liability of $27.5 million in connection with the debt discount associated with the 2019 Notes and recorded a deferred tax asset of $28.6 million in connection with the convertible note hedge transactions. The deferred tax liability and deferred tax asset are recorded in deferred tax assets on the consolidated balance sheets.
Our provision for income taxes in fiscal 2017 included $0.1 million of income tax expense as a result of the Tax Act for the provisional re-measurement of the deferred tax asset and liability related to the 2019 Notes for the reduction in the U.S. corporate income tax rate from 35% to 21%.
Asset Based Credit Facility
In August 2011, Restoration Hardware, Inc., along with its Canadian subsidiary, Restoration Hardware Canada, Inc., entered into a credit agreement with Bank of America, N.A., as administrative agent, and certain other lenders. On June 28, 2017, Restoration Hardware, Inc. entered into an eleventh amended and restated credit agreement among Restoration Hardware, Inc., Restoration Hardware Canada, Inc., various subsidiaries of RH named therein as borrowers or guarantors, the lenders party thereto and Bank of America, N.A. as administrative agent and collateral agent (the “credit agreement”). The credit agreement has a revolving line of credit with availability of up to $600.0 million, of which $10.0 million is available to Restoration Hardware Canada, Inc., and includes a $200.0 million accordion feature under which the revolving line of credit may be expanded by agreement of the parties from $600.0 million to up to $800.0 million if and to the extent the lenders revise their credit commitments to encompass a larger facility. In addition, the credit agreement established an $80.0 million LILO term loan facility which was repaid in full in June 2018. As a result of the repayment, we incurred a $0.5 million loss on extinguishment of debt in the nine months ended November 3, 2018, which represents the acceleration of amortization of debt issuance costs. We did not incur any prepayment penalties upon the early extinguishment of the LILO term loan.
68
On June 12, 2018, Restoration Hardware, Inc. entered into a First Amendment (the “First Amendment”) to the credit agreement. The First Amendment (i) changes the credit agreement’s definition of “Eligible In-Transit Inventory” to clarify the requirements to be fulfilled by the borrowers with respect to such in-transit inventory, and (ii) clarifies that no Default or Event of Default was caused by any prior non-compliance with such requirements with respect to in-transit inventory. Eligible In-Transit Inventory consists of inventory being shipped from vendor locations outside of the United States. Qualifying in-transit inventory is included within the borrowing base for eligible collateral for purposes of determining the amount of borrowing available to borrowers under the credit agreement.
On November 23, 2018, Restoration Hardware, Inc. entered into a Consent and Second Amendment (the “Second Amendment”) to the credit agreement. The Second Amendment includes certain clarifying changes to among other things: (a) address the processing of payments from insurance proceeds in connection with casualty or other insured losses with respect to property or assets of a Loan Party, and (b) add an additional category of permitted restricted payment to allow the lead borrower to make annual restricted payments of up to $3 million per fiscal year to cover payments of certain administrative and other obligations of RH in the ordinary course of business.
The availability of credit at any given time under the credit agreement is limited by reference to a borrowing base formula based upon numerous factors, including the value of eligible inventory and eligible accounts receivable. As a result of the borrowing base formula, actual borrowing availability under the revolving line of credit could be less than the stated amount of the revolving line of credit (as reduced by the actual borrowings and outstanding letters of credit under the revolving line of credit). All obligations under the credit agreement are secured by substantially all of the assets, including accounts receivable, inventory, intangible assets, property, equipment, goods and fixtures of Restoration Hardware, Inc., Restoration Hardware Canada, Inc., RH US, LLC, Waterworks Operating Co., LLC and Waterworks IP Co., LLC.
Borrowings under the revolving line of credit are subject to interest, at the borrowers’ option, at either the bank’s reference rate or LIBOR (or, in the case of the revolving line of credit, the Bank of America “BA” Rate or the Canadian Prime Rate, as such terms are defined in the credit agreement, for Canadian borrowings denominated in Canadian dollars or the United States Index Rate or LIBOR for Canadian borrowings denominated in United States dollars) plus an applicable margin rate, in each case.
The credit agreement contains various restrictive covenants, including, among others, limitations on the ability to incur liens, make loans or other investments, incur additional debt, issue additional equity, merge or consolidate with or into another person, sell assets, pay dividends or make other distributions or enter into transactions with affiliates, along with other restrictions and limitations typical to credit agreements of this type and size. As of February 2, 2019, Restoration Hardware, Inc. was in compliance with all applicable covenants of the credit agreement.
In addition, under our credit agreement, we are required to meet specified financial ratios in order to undertake certain actions, and we may be required to maintain certain levels of excess availability or meet a specified consolidated fixed-charge coverage ratio (“FCCR”). The trigger for the FCCR occurs if the domestic availability under the revolving line of credit is less than the greater of (i) $40.0 million and (ii) 10% of the sum of (a) the lesser of (x) the aggregate revolving commitments under the credit agreement and (y) the aggregate revolving borrowing base, plus (b) the lesser of (x) the then outstanding amount of the LILO term loan or (y) the LILO term loan borrowing base. If the availability under the credit agreement is less than the foregoing amount, then Restoration Hardware, Inc. is required to maintain an FCCR of at least one to one.
The credit agreement requires a daily sweep of all cash receipts and collections to prepay the loans under the agreement while (i) an event of default exists or (ii) the availability under the revolving line of credit for extensions of credit is less than the greater of (A) $40.0 million and (B) 10% of the sum of (a) the lesser of (x) the aggregate revolving commitments under the credit agreement and (y) the aggregate revolving borrowing base, plus (b) the lesser of (x) the then outstanding amount of the LILO term loan or (y) the LILO term loan borrowing base.
As of February 2, 2019, Restoration Hardware, Inc. had $57.5 million in outstanding borrowings and $378.9 million of availability under the revolving line of credit, net of $13.6 million in outstanding letters of credit. As a result of the consolidated FCCR restriction that limits the last 10% of borrowing availability, actual incremental borrowing available to the Company and the other affiliated parties under the revolving line of credit would be approximately $333.9 million as of February 2, 2019.
69
On July 7, 2017, Restoration Hardware, Inc., a wholly-owned subsidiary of RH, entered into the second lien credit agreement, dated as of July 7, 2017, among Restoration Hardware, Inc., as lead borrower, the guarantors party thereto, the lenders party thereto, each of whom are funds and accounts managed or advised by Apollo Capital Management, L.P., and its affiliated investment managers, and Wilmington Trust, National Association as administrative agent and collateral agent with respect to the second lien term loan in an aggregate principal amount equal to $100.0 million with a maturity date of January 7, 2023. The second lien term loan of $100.0 million was repaid in full on October 10, 2017. As a result of the repayment, we incurred a $4.9 million loss on extinguishment of debt in fiscal 2017, which includes a prepayment penalty of $3.0 million and acceleration of amortization of debt issuance costs of $1.9 million.
Intercreditor Agreement
On July 7, 2017, in connection with the second lien credit agreement, Restoration Hardware, Inc. entered into an intercreditor agreement (the “intercreditor agreement”) with the administrative agent and collateral agent under the credit agreement and the administrative agent and collateral agent under the second lien credit agreement. The intercreditor agreement established various customary inter-lender terms, including, without limitation, with respect to priority of liens, permitted actions by each party, application of proceeds, exercise of remedies in case of default, releases of liens and certain limitations on the amendment of the credit agreement and the second lien credit agreement without the consent of the other party. The intercreditor agreement was terminated upon repayment of the second lien term loan on October 10, 2017.
Share Repurchase Programs
During fiscal 2017, we repurchased approximately 20.2 million shares of our common stock under two separate repurchase programs for an aggregate repurchase amount of approximately $1 billion. During fiscal 2018, we repurchased approximately 2.0 million shares of our common stock under a separate repurchase program for an aggregate repurchase amount of approximately $250 million. Total repurchases made in fiscal 2018 and fiscal 2017 represented 54.5% of the shares outstanding as of the end of fiscal 2016.
We generated $163 million and $415 million in free cash flow in fiscal 2018 and fiscal 2017, respectively, which supported our share repurchase programs. Free cash flow is calculated as net cash provided by operating activities, net proceeds from sale of assets held for sale and borrowing on build-to-suit lease transactions, less capital expenditures, payments on build-to-suit lease transactions and payments on capital leases. Free cash flow excludes all non-cash items, such as the non-cash additions of property and equipment due to build-to-suit lease transactions. Free cash flow is included in this filing because management believes that free cash flow provides meaningful supplemental information for investors regarding the performance of our business and facilitates a meaningful evaluation of operating results on a comparable basis with historical results. Our management uses this non-GAAP financial measure in order to have comparable financial results to analyze changes in our underlying business from quarter to quarter. A reconciliation of our net cash provided by operating activities to free cash flow is as follows:
|
|
|
Year Ended |
|
|||||
|
|
|
February 2, |
|
|
February 3, |
|
||
|
|
|
2019 |
|
|
2018 |
|
||
|
|
|
(in thousands) |
|
|||||
|
Net cash provided by operating activities |
|
$ |
300,556 |
|
|
$ |
556,817 |
|
|
Capital expenditures |
|
|
(136,736 |
) |
|
|
(146,233 |
) |
|
Payments on build-to-suit lease transactions |
|
|
(7,452 |
) |
|
|
(10,200 |
) |
|
Payments on capital leases |
|
|
(719 |
) |
|
|
(377 |
) |
|
Borrowing on build-to-suit lease transactions |
|
|
7,077 |
|
|
|
— |
|
|
Proceeds from sale of assets held for sale—net |
|
|
— |
|
|
|
15,123 |
|
|
Free cash flow |
|
$ |
162,726 |
|
|
$ |
415,130 |
|
We believe that these share repurchase programs will continue to be an excellent allocation of capital for the long-term benefit of our shareholders. We may undertake other repurchase programs in the future with respect to our securities.
70
Fiscal 2017 $300 Million Share Repurchase Program
On February 21, 2017, our Board of Directors authorized a share repurchase program of up to $300 million (the “Fiscal 2017 $300 Million Repurchase Program”) through open market purchases, privately negotiated transactions or other means, including through Rule 10b18 open market repurchases, Rule 10b5-1 trading plans or through the use of other techniques such as accelerated share repurchases. During the three months ended April 29, 2017, we repurchased approximately 7.8 million shares of our common stock under the Fiscal 2017 $300 Million Repurchase Program at an average price of $38.24 per share, for an aggregate repurchase amount of approximately $300 million. No additional shares will be repurchased in future periods under the Fiscal 2017 $300 Million Repurchase Program.
Fiscal 2017 $700 Million Share Repurchase Program
Following completion of the Fiscal 2017 $300 Million Repurchase Program, our Board of Directors authorized on May 2, 2017 an additional share repurchase program of up to $700 million (the “Fiscal 2017 $700 Million Repurchase Program”) through open market purchases, privately negotiated transactions or other means, including through Rule 10b18 open market repurchases, Rule 10b5-1 trading plans or through the use of other techniques such as accelerated share repurchases including through privately-negotiated arrangements in which a portion of the share repurchase program is committed in advance through a financial intermediary and/or in transactions involving hedging or derivatives. During the three months ended July 29, 2017, we repurchased approximately 12.4 million shares of our common stock under the Fiscal 2017 $700 Million Repurchase Program at an average price of $56.60 per share, for an aggregate repurchase amount of approximately $700 million. No additional shares will be repurchased in future periods under the Fiscal 2017 $700 Million Repurchase Program.
Fiscal 2018 $700 Million Share Repurchase Program
On October 10, 2018, our Board of Directors authorized a share repurchase program of up to $700 million (the “Fiscal 2018 $700 Million Repurchase Program”) through open market purchases, privately negotiated transactions or other means, including through Rule 10b18 open market repurchases, Rule 10b5-1 trading plans or through the use of other techniques such as accelerated share repurchases including through privately-negotiated arrangements in which a portion of the share repurchase program is committed in advance through a financial intermediary and/or in transactions involving hedging or derivatives. During fiscal 2018, we repurchased approximately 2.0 million shares of our common stock under the Fiscal 2018 $700 Million Repurchase Program at an average price of $122.10 per share, for an aggregate repurchase amount of approximately $250 million. As of February 2, 2019, there was $450 million available under the Fiscal 2018 $700 Million Share Repurchase Program.
Contractual Obligations
As of February 2, 2019, our future contractual cash obligations over the next several periods were as follows:
|
|
|
Payments Due by Period |
|
|||||||||||||||||
|
|
|
Total |
|
|
2019 |
|
|
2020–2021 |
|
|
2022–2023 |
|
|
Thereafter |
|
|||||
|
|
|
(in thousands) |
|
|||||||||||||||||
|
Convertible senior notes due 2019 |
|
$ |
350,000 |
|
|
$ |
350,000 |
|
|
$ |
— |
|
|
$ |
— |
|
|
$ |
— |
|
|
Convertible senior notes due 2020 |
|
|
300,000 |
|
|
|
— |
|
|
|
300,000 |
|
|
|
— |
|
|
|
— |
|
|
Convertible senior notes due 2023 |
|
|
335,000 |
|
|
|
— |
|
|
|
— |
|
|
|
335,000 |
|
|
|
— |
|
|
Asset based credit facility (1) |
|
|
57,500 |
|
|
|
— |
|
|
|
— |
|
|
|
57,500 |
|
|
|
— |
|
|
Operating leases (2) |
|
|
613,696 |
|
|
|
83,426 |
|
|
|
138,022 |
|
|
|
108,063 |
|
|
|
284,185 |
|
|
Other non-current obligations (3) |
|
|
703,149 |
|
|
|
37,629 |
|
|
|
86,960 |
|
|
|
96,619 |
|
|
|
481,941 |
|
|
Capital lease obligations |
|
|
14,584 |
|
|
|
2,042 |
|
|
|
3,387 |
|
|
|
2,584 |
|
|
|
6,571 |
|
|
Notes payable for share repurchases |
|
|
19,633 |
|
|
|
892 |
|
|
|
— |
|
|
|
18,498 |
|
|
|
243 |
|
|
Letters of credit |
|
|
13,637 |
|
|
|
13,637 |
|
|
|
— |
|
|
|
— |
|
|
|
— |
|
|
Total |
|
$ |
2,407,199 |
|
|
$ |
487,626 |
|
|
$ |
528,369 |
|
|
$ |
618,264 |
|
|
$ |
772,940 |
|
|
(1) |
Under the credit agreement, the asset based credit facility has a maturity date of June 28, 2022. |
|
(2) |
We enter into operating leases in the normal course of business. Most lease arrangements provide us with the option to renew the leases at defined terms. The table above does not include future obligations for renewal options that have not yet been exercised. The future operating lease obligations would change if we were to exercise these options. Amounts above do not include estimated contingent rent due under operating leases. Our obligation for contingent rent as of February 2, 2019 was $4.9 million. |
|
(3) |
Other non-current obligations include estimated payments for rent associated with build-to-suit lease transactions. These amounts may be reduced in the event we are able to effect a sale-leaseback on any of these locations. |
71
The Company enters into various cancellable commitments related to the procurement of merchandise inventory. As of February 2, 2019, these merchandise inventory purchase commitments were $490.7 million.
As of February 2, 2019, the liability of $3.0 million for unrecognized tax benefits associated with uncertain tax positions (refer to Note 13—Income Taxes in our consolidated financial statements) has not been included in the contractual obligations table above as we are not able to reasonably estimate when cash payments for these liabilities will occur or the amount by which these liabilities will increase or decrease over time.
Off Balance Sheet Arrangements
We have no material off balance sheet arrangements as of February 2, 2019.
Critical Accounting Policies and Estimates
The preparation of financial statements in accordance with accounting principles generally accepted in the United States requires management to make estimates and assumptions that affect amounts reported in our consolidated financial statements and related notes, as well as the related disclosure of contingent assets and liabilities at the date of the financial statements and the reported amounts of revenues and expenses during the reporting period. Management evaluates its accounting policies, estimates, and judgments on an on-going basis. Management bases its estimates and judgments on historical experience and various other factors that are believed to be reasonable under the circumstances. Actual results may differ from these estimates under different assumptions and conditions and such differences could be material to the consolidated financial statements.
Management evaluated the development and selection of its critical accounting policies and estimates and believes that the following involve a higher degree of judgment or complexity and are most significant to reporting our consolidated results of operations and financial position, and are therefore discussed as critical. The following critical accounting policies reflect the significant estimates and judgments used in the preparation of our consolidated financial statements. With respect to critical accounting policies, even a relatively minor variance between actual and expected experience can potentially have a materially favorable or unfavorable impact on subsequent results of operations. However, our historical results for the periods presented on the consolidated financial statements have not been materially impacted by such variances. More information on all of our significant accounting policies can be found in Note 3—Significant Accounting Policies in our audited consolidated financial statements.
Revenue Recognition
We recognize revenues and the related cost of goods sold when a customer obtains control of the merchandise, which is when the customer has the ability to direct the use of and obtain the benefits from the merchandise. Revenue recognized for merchandise delivered via the home-delivery channel is recognized upon delivery. Revenue recognized for merchandise delivered via all other delivery channels will be recognized upon shipment. Revenues from “cash-and-carry” store sales are recognized at the point of sale in the store. Discounts or other accommodations provided to customers are accounted for as a reduction of sales.
We account for shipping and handling as activities to fulfill the promise to transfer the merchandise to our customers. We apply this policy consistently across all of our distribution channels. In instances where revenue is recognized for the related merchandise prior to delivery to customers (i.e., revenue recognized upon shipment), the related costs of shipping and handling activities will be accrued for in the same period. Costs of shipping and handling are included in cost of goods sold.
We defer revenue associated with merchandise delivered via the home-delivery channel. As we recognize revenue when the merchandise is delivered to our customers, it is included as deferred revenue on the consolidated balance sheets while in-transit.
We collect annual membership fees related to the RH Members Program. New membership fees are recorded as deferred revenue when collected from customers and recognized as revenue based on expected product revenues over the annual membership period, based on historical trends of sales to members. Membership renewal fees are recorded as deferred revenue when collected from customers and are recognized as revenue on a straight-line basis over the membership period, or one year.
Sales tax collected is not recognized as revenue but is included in accounts payable and accrued expenses on the consolidated balance sheets as it is ultimately remitted to governmental authorities.
We reserve for projected merchandise returns. Merchandise returns are often resalable merchandise and are refunded by issuing the same payment tender of the original purchase. Merchandise exchanges of the same product and price are not considered merchandise returns and, therefore, are excluded when calculating the sales returns reserve.
72
Our customers may return purchased items for a refund. We provide an allowance for sales returns based on historical return rates, which is presented on a gross basis. We present the allowance for sales returns within other current liabilities and the estimated value of the right of return asset for merchandise within prepaid expense and other assets on the consolidated balance sheets.
Merchandise Inventories
Our merchandise inventories are comprised of finished goods and are carried at the lower of cost or net realizable value, with cost determined on a weighted-average cost method. To determine if the value of inventory should be marked down below original cost, we consider current and anticipated demand, customer preference and the merchandise age. The inventory value is adjusted periodically to reflect current market conditions, which requires management judgments that may significantly affect the ending inventory valuation, as well as gross margin. The significant estimates used in inventory valuation are obsolescence (including excess and slow-moving inventory and lower of cost or net realizable value reserves) and estimates of inventory shrinkage. We adjust our inventory for obsolescence based on historical trends, aging reports, specific identification and our estimates of future retail sales prices.
Reserves for shrinkage are estimated and recorded throughout the period as a percentage of net sales based on historical shrinkage results and current inventory levels. Actual shrinkage is recorded throughout the year based upon periodic cycle counts and the results of our annual physical inventory counts. Actual inventory shrinkage and obsolescence can vary from estimates due to factors including the mix of our inventory (which ranges from large furniture to décor) and execution against loss prevention initiatives in our stores, distribution centers, off-site storage locations and with third-party transportation providers.
Due to these factors, our obsolescence and shrinkage reserves contain uncertainties. Both estimates have calculations that require management to make assumptions and to apply judgment regarding a number of factors, including market conditions, the selling environment, historical results and current inventory trends. If actual obsolescence or shrinkage change from our original estimates, we adjust our inventory reserves accordingly throughout the period. Management does not believe that changes in the assumptions used in these estimates would have a significant effect on our net income or inventory balances. We have not made any material changes to our assumptions included in the calculations of the obsolescence and shrinkage reserves during the periods presented or recorded significant adjustments related to the physical inventory process.
Impairment
Goodwill
We evaluate goodwill annually to determine whether it is impaired or whenever events occur or circumstances change that would indicate that the fair value of a reporting unit is less than its carrying amount. Conditions that may indicate impairment include, but are not limited to, a significant adverse change in customer demand or business climate that could affect the value of an asset; general economic conditions, such as increasing Treasury rates or unexpected changes in gross domestic product growth; a change in our market share; budget-to-actual performance and consistency of operating margins and capital expenditures; a product recall or an adverse action or assessment by a regulator; or changes in management or key personnel.
We perform our annual goodwill impairment testing in the fourth fiscal quarter by comparing the fair value of a reporting unit with its carrying amount. We would recognize an impairment charge for the amount by which the carrying amount exceeds the reporting unit’s fair value.
We determine fair values using the discounted cash flow approach (“income approach”) or the market multiple valuation approach (“market approach”), when available and appropriate, or a combination of both. We assess the valuation methodology based upon the relevance and availability of the data at the time we perform the valuation. If multiple valuation methodologies are used, the results are weighted appropriately.
Under the income approach, fair value is determined based on the present value of estimated future cash flows, discounted at an appropriate risk-adjusted rate. We use our internal forecasts to estimate future cash flows and include an estimate of long-term future growth rates based on our most recent views of the long-term outlook for each respective reporting unit. Actual results may differ from those assumed in our forecasts. We derive our discount rates using a capital asset pricing model and analyzing published rates for industries relevant to our reporting units to estimate the cost of equity financing. We use discount rates that are commensurate with the risks and uncertainty inherent in the respective businesses and in our internally developed forecasts.
Valuations using the market approach are derived from metrics of publicly traded companies or historically completed transactions of comparable businesses. The selection of comparable businesses is based on the markets in which the reporting units operate giving consideration to risk profiles, size, geography, and diversity of products and services. A market approach is limited to reporting units for which there are publicly traded companies that have the characteristics similar to our businesses.
73
Estimating the fair value of reporting units requires the use of estimates and significant judgments that are based on a number of factors including actual operating results. It is reasonably possible that the judgments and estimates described above could change in future periods.
A reporting unit is an operating segment or a business unit one level below that operating segment for which discrete financial information is prepared and regularly reviewed by the Chief Operating Decision Maker (“CODM”). We have deemed RH Segment and Waterworks to be the reporting units for which goodwill is independently tested, as these operating segments are the lowest level for which discrete financial information is prepared and regularly reviewed by the CODM.
RH Segment Reporting Unit
During fiscal 2018, fiscal 2017 and fiscal 2016, we reviewed the RH Segment reporting unit goodwill for impairment by assessing qualitative factors to determine whether it was more likely than not that the fair value of the reporting unit was less than its carrying amount. Based on the qualitative tests performed in each fiscal year, we determined that it was not more likely than not that the fair value of the reporting unit was less than its carrying amount for fiscal 2018, fiscal 2017 and fiscal 2016, and therefore we did not recognize goodwill impairment with respect to the RH Segment in any such fiscal year.
Waterworks Reporting Unit
During the fourth fiscal quarters of 2018 and 2017, we conducted our annual strategic planning process. Based upon the outcome of this process in each fiscal year, management identified indicators that there could be an impairment of the Waterworks reporting unit. These indicators included (i) an updated long-range financial plan provided by the Waterworks segment management that indicated a reduction of revenues and EBITDA as compared to prior long-range financial plans, (ii) a review of the strategic initiatives of the Waterworks segment and (iii) the Waterworks segment not achieving revenue and operating income objectives compared to plans.
In determining the Waterworks reporting unit estimated fair value using the income approach in both fiscal 2018 and fiscal 2017, we projected future cash flows based on management’s estimates and long-term plans and applied a discount rate based on a weighted average cost of capital. This analysis required management to make judgments about revenues, expenses, fixed asset and working capital requirements, the impact of updated tax legislation and other subjective inputs. In determining the Waterworks reporting unit estimated fair value using the market approach, management considered assumptions that it believes market participants would use in valuing the Waterworks reporting unit, based on EBITDA multiples and including the application of a control premium. For purposes of this analysis, in both fiscal years, we weighted the results 80% towards the income approach and 20% towards the market approach.
Based on the estimated fair value of the Waterworks reporting unit as of the assessment date of each of its fiscal 2018 and fiscal 2017 analysis, we recorded a $17.4 million and $33.7 million non-cash impairment in the fourth quarter of fiscal 2018 and fiscal 2017, respectively, to reduce the carrying value of goodwill in the Waterworks reporting unit.
Tradenames, Trademarks and Domain Names
We annually evaluate whether tradenames, trademarks and domain names continue to have an indefinite life. Tradenames, trademarks and domain names are reviewed for impairment annually in the fourth quarter and may be reviewed more frequently if indicators of impairment are present. Conditions that may indicate impairment include, but are not limited to, a significant adverse change in customer demand or business climate that could affect the value of an asset, a product recall or an adverse action or assessment by a regulator.
We qualitatively assesses indefinite-lived intangible asset impairment to determine whether it is more likely than not that the fair value of the asset is less than its carrying amount. If tradenames, trademarks and domain names are not qualitatively assessed or if such intangible assets are qualitatively assessed and it is determined it is not more likely than not that the asset’s fair value is greater than its carrying amount, an impairment review is performed by comparing the carrying value to the estimated fair value, determined using a discounted cash flow methodology. Factors used in the valuation of intangible assets with indefinite lives include, but are not limited to, management’s plans for future operations, brand initiatives, recent results of operations and projected future cash flows.
RH Segment Reporting Unit
During fiscal 2018, fiscal 2017 and fiscal 2016, we qualitatively assessed the RH Segment reporting unit indefinite-lived intangible asset for impairment and determine it was more likely than not that the fair value of the assets were greater than their carrying amounts. Based on the qualitative tests performed in each fiscal year, we did not perform quantitative impairment tests in any year. We did not recognize any impairment with respect to intangible assets for the RH Segment reporting unit in fiscal 2018, fiscal 2017, or fiscal 2016.
74
In connection with the goodwill impairment test performed for the Waterworks reporting unit in fiscal 2017, described above, we performed an impairment test on the tradenames allocated to the reporting unit which utilized the discounted cash flow methodology under the relief-from-royalty method. Under the relief-from-royalty method, our significant assumptions include the forecasted future revenues and the estimated royalty rate, expressed as a percentage of revenues. Based on the quantitative impairment test performed, which resulted in fair value of the tradename in excess of book value by approximately 26%, we concluded that the tradename allocated to the Waterworks reporting unit was not impaired as of February 3, 2018 and did not recognize any impairment with respect to the tradename for the Waterworks reporting unit in fiscal 2017.
At the end of each of the first three fiscal quarters of 2018, we determined that there were no events or circumstances that indicated any impairment for the Waterworks reporting unit tradename. During the fourth fiscal quarter of 2018, management updated the fiscal 2019 budget and financial projections beyond fiscal 2019 for the Waterworks reporting unit. There were certain factors that caused the key financial inputs for the tradename valuation model to significantly decrease from the previous inputs, the most significant of which was a reduction of future forecasted net revenues resulting from an expected shift in product mix, challenges in continuing to grow the showrooms business and supply chain constraints.
These factors arising during the fourth fiscal quarter of 2018 had a significant and negative impact on the estimated future cash flows of the Waterworks reporting unit. In connection with the goodwill impairment test performed for the Waterworks reporting unit in fiscal 2018, described above, we performed an impairment test on the tradename allocated to the reporting unit which utilized the discounted cash flow methodology under the relief-from-royalty method. Under the relief-from-royalty method, our significant assumptions include the forecasted future revenues and the estimated royalty rate, expressed as a percentage of revenues. Based on the quantitative impairment test performed and the result of changes in forecasted revenues and the valuation assumption around future royalty rates, we concluded that the Waterworks reporting unit tradename was impaired as of February 2, 2019. As a result, we recognized a $14.6 million non-cash impairment with respect to the tradename for the Waterworks reporting unit in fiscal 2018.
Long-Lived Assets
Long-lived assets, such as property and equipment and intangible assets subject to amortization, are reviewed for impairment whenever events or changes in circumstances indicate that the carrying amount of an asset may not be recoverable. Conditions that may indicate impairment include, but are not limited to, a significant adverse change in customer demand or business climate that could affect the value of an asset, a product recall or an adverse action or assessment by a regulator. If the sum of the estimated undiscounted future cash flows related to the asset is less than the carrying value, we recognize a loss equal to the difference between the carrying value and the fair value, usually determined by the estimated discounted cash flow analysis of the assets.
Since there is typically no active market for our long-lived tangible assets, we estimate fair values based on the expected future cash flows of the asset or asset group, using a discount rate commensurate with the related risk. The asset group is defined as the lowest level for which identifiable cash flows are available and largely independent of the cash flows of other groups of assets, which for our stores is the individual gallery level. We estimate future cash flows based on gallery-level historical results, current trends, and operating and cash flow projections. Our estimates are subject to uncertainty and may be affected by a number of factors outside our control, including general economic conditions and the competitive environment. While we believe our estimates and judgments about future cash flows are reasonable, future impairment charges may be required if the expected cash flow estimates, as projected, do not occur or if events change requiring us to revise our estimates.
Lease Accounting
We lease stores, distribution facilities, office space and, less significantly, certain machinery and equipment. We classify leases at the inception of the lease as a capital lease or an operating lease.
Build-to-Suit Lease Transactions
We are sometimes involved in the construction of leased stores, which, depending on the extent to which we are involved, we may be the “deemed owner” of the leased premises for accounting purposes during the construction period pursuant to ASC 840. If we are the “deemed owner” for accounting purposes, upon commencement of the construction project, we are required to capitalize the cash and non-cash assets contributed by the landlord for construction as property and equipment on our consolidated balance sheets. The contributions by the landlord toward construction, including the building, existing site improvements at construction commencement and any amounts paid by the landlord to those responsible for construction, are included as property and equipment additions due to build-to-suit lease transactions within the non-cash section of our consolidated statements of cash flows. Over the lease term, these non-cash additions to property and equipment due to build-to-suit lease transactions do not impact our cash outflows, nor do they impact net income within our consolidated statements of income.
75
Upon completion of the construction project, we perform a sale-leaseback analysis to determine if we do not have any forms of “continuing involvement” and therefore can remove the assets and related liabilities from our consolidated balance sheets. If the assets and related liabilities cannot be removed from our consolidated balance sheets, we account for the transactions as a financing lease. These lease transactions are referred to as build-to-suit lease transactions.
Rent expense relating to the land is recognized on a straight-line basis once construction begins, which is determined using the fair value of the leased land at construction commencement and our incremental borrowing rate. Once cash payments commence under the lease, all amounts in excess of land rent expense are recorded as a debt-service payment and are recognized as interest expense and a reduction of the financing obligation.
Similar to capital leases, the expense recorded within the consolidated statements of income over the lease term is equal to the cash rent payments made under the lease. The primary difference in the consolidated statements of income between build-to-suit lease transactions and operating leases is the timing of recognition and the classification of expenses. Expenses related to operating leases are classified as rent expense compared to expenses related to build-to-suit lease transactions which are classified as a combination of rent expense, depreciation expense and interest expense.
Operating and Capital Leases
In a capital or an operating lease, the expected lease term begins with the date that we take possession of the equipment or the leased space for construction and other purposes. The expected lease term may also include the exercise of renewal options if the exercise of the option is determined to be reasonably assured. The expected term is also used in the determination of whether a store is a capital or operating lease.
Certain of our property and equipment are held under capital leases. These assets are included in property and equipment and depreciated over the lesser of the useful life of the asset or the lease term. For buildings held under capital leases, unless the fair value of the land at lease inception exceeds 25% of the aggregate fair value of the leased land and buildings, rent payments under the leases are recognized using the effective interest method as a reduction of the capital lease obligation and interest expense. Pursuant to ASC 840, at lease inception, if the fair value of the underlying land exceeds 25% of the fair value of the real estate (land and buildings), we allocate a portion of the cash payments under the lease to land rent expense equal to the product of the fair value of the leased land at construction commencement and our incremental borrowing rate. The remaining cash payment is treated as debt-service payments and recognized as a reduction of the capital lease obligation and an increase in interest expense.
All other leases are considered operating leases in accordance with ASC 840. Assets subject to an operating lease and the related lease payments are not recorded on the consolidated balance sheets. For leases that contain lease incentives, premiums and minimum rent expenses, we recognize rent expense on a straight-line basis over the lease term. Tenant improvement allowances received from landlords under operating leases are recorded in deferred rent and lease incentives on the consolidated balance sheets, and are amortized on a straight-line basis over the lease term.
Stock-Based Compensation
We use the straight-line method of accounting for stock-based compensation, which we believe is the predominant method used in our industry. We recognize the fair value of stock-based compensation in the consolidated financial statements as compensation expense over the requisite service period. In addition, excess tax benefits related to stock-based compensation awards are reflected as financing cash flows. For service-only awards, compensation expense is recognized on a straight-line basis, net of forfeitures, over the requisite service period for the fair value of awards that actually vest. Fair value for restricted stock units is valued using the closing price of our stock on the date of grant. The fair value of each option award granted under our award plan is estimated on the date of grant using a Black-Scholes Merton option pricing model which requires the input of subjective assumptions regarding the expected term, expected volatility, dividend yield and risk-free interest rate. We elected to calculate the expected term of the option awards using the “simplified method.” This election was made based on the lack of sufficient historical exercise data to provide a reasonable basis upon which to estimate expected term. Under the “simplified” calculation method, the expected term is calculated as an average of the vesting period and the contractual life of the options.
Income Taxes
We account for income taxes under an asset and liability approach that requires the recognition of deferred tax assets and liabilities for the expected future tax consequences of events that have been recognized in our consolidated financial statements or tax returns. In estimating future tax consequences, we generally take into account all expected future events then known to us, other than changes in the tax law or rates which have not yet been enacted and which are not permitted to be considered. Accordingly, we may record a valuation allowance to reduce our net deferred tax assets to the amount that is more-likely-than-not to be realized. The
76
determination as to whether a deferred tax asset will be realized is made on a jurisdictional basis and is based upon management’s best estimate of the recoverability of our net deferred tax assets. Future taxable income and ongoing prudent and feasible tax planning are considered in determining the amount of the valuation allowance, and the amount of the allowance is subject to adjustment in the future. Specifically, in the event we are to determine that we are not more-likely-than-not able to realize our net deferred tax assets in the future, an adjustment to the valuation allowance would decrease income in the period such determination is made. This allowance does not alter our ability to utilize the underlying tax net operating loss and credit carryforwards in the future, the utilization of which is limited to achieving future taxable income.
In assessing the need for a valuation allowance, we consider both positive and negative evidence related to the likelihood of realization of the deferred tax assets. If, based on the weight of available evidence, it is more-likely-than-not the deferred tax assets will not be realized, we record a valuation allowance. The weight given to the positive and negative evidence is commensurate with the extent to which the evidence may be objectively verified. As such, it is generally difficult for positive evidence regarding projected future taxable income exclusive of reversing taxable temporary differences to outweigh objective negative evidence of recent financial reporting losses. United States GAAP states that cumulative losses in recent years are a significant piece of negative evidence that is difficult to overcome in determining that a valuation allowance is not needed against deferred tax assets.
As of February 2, 2019, we had $1.6 million in valuation allowances against deferred tax assets in certain state and foreign jurisdictions due to historical losses.
The accounting standard for uncertainty in income taxes prescribes a recognition threshold that a tax position is required to meet before being recognized in the financial statements and provides guidance on derecognition, measurement, classification, interest and penalties, accounting in interim periods, disclosure and transition issues. Differences between tax positions taken in a tax return and amounts recognized in the financial statements generally result in an increase in a liability for income taxes payable or a reduction of an income tax refund receivable, or a reduction in a deferred tax asset or an increase in a deferred tax liability, or both. We recognize interest and penalties related to unrecognized tax benefits in tax expense.
Recently Issued Accounting Pronouncements
For information regarding recently issued accounting pronouncements, refer to Note 3—Significant Accounting Polices in our consolidated financial statements within Part II of this Annual Report on Form 10-K.
Interest Rate Risk
We currently do not engage in any interest rate hedging activity and we have no intention to do so in the foreseeable future.
We are subject to interest rate risk in connection with borrowings under our revolving line of credit which bears interest at variable rates and we may incur additional indebtedness that bears interest at variable rates. At February 2, 2019, $57.5 million was outstanding under the revolving line of credit. As of February 2, 2019, the undrawn borrowing availability under the revolving line of credit was $378.9 million, net of $13.6 million in outstanding letters of credit. As a result of the FCCR restriction that limits the last 10% of borrowing availability, actual incremental borrowing available under the revolving line of credit would be approximately $333.9 million. Based on the average interest rate on the revolving line of credit during the three months ended February 2, 2019, and to the extent that borrowings were outstanding on such line of credit, we do not believe that a 10% change in the interest rate would have a material effect on our consolidated results of operations or financial condition. To the extent that we incur additional indebtedness, we may increase our exposure to risk from interest rate fluctuations.
As of February 2, 2019, we had $350 million principal amount of 0.00% convertible senior notes due 2019 outstanding (the “2019 Notes”). As this instrument does not bear interest, we do not have interest rate risk exposure related to this debt.
As of February 2, 2019, we had $300 million principal amount of 0.00% convertible senior notes due 2020 outstanding (the “2020 Notes”). As this instrument does not bear interest, we do not have interest rate risk exposure related to this debt.
As of February 2, 2019, we had $335 million principal amount of 0.00% convertible senior notes due 2023 outstanding (the “2023 Notes”). As this instrument does not bear interest, we do not have interest rate risk exposure related to this debt.
77
Market Price Sensitive Instruments
0.00% Convertible Senior Notes due 2019
In connection with the issuance of the 2019 Notes, we entered into privately-negotiated convertible note hedge transactions with certain counterparties. The convertible note hedge transactions relate to, collectively, 3.0 million shares of our common stock, which represents the number of shares of our common stock underlying the 2019 Notes, subject to anti-dilution adjustments substantially similar to those applicable to the 2019 Notes. These convertible note hedge transactions are expected to reduce the potential earnings dilution with respect to our common stock upon conversion of the 2019 Notes and/or reduce our exposure to potential cash or stock payments that may be required upon conversion of the 2019 Notes.
We also entered into separate warrant transactions with the same group of counterparties initially relating to the number of shares of our common stock underlying the convertible note hedge transactions, subject to customary anti-dilution adjustments. The warrant transactions will have a dilutive effect with respect to our common stock to the extent that the price per share of our common stock exceeds the strike price of the warrants unless we elect, subject to certain conditions, to settle the warrants in cash. The strike price of the warrant transactions is initially $171.98 per share. Refer to Note 10—Convertible Senior Notes in our consolidated financial statements.
0.00% Convertible Senior Notes due 2020
In connection with the issuance of the 2020 Notes, we entered into privately-negotiated convertible note hedge transactions with certain counterparties. The convertible note hedge transactions relate to, collectively, 2.5 million shares of our common stock, which represents the number of shares of our common stock underlying the 2020 Notes, subject to anti-dilution adjustments substantially similar to those applicable to the 2020 Notes. These convertible note hedge transactions are expected to reduce the potential earnings dilution with respect to our common stock upon conversion of the 2020 Notes and/or reduce our exposure to potential cash or stock payments that may be required upon conversion of the 2020 Notes.
We also entered into separate warrant transactions with the same group of counterparties initially relating to the number of shares of our common stock underlying the convertible note hedge transactions, subject to customary anti-dilution adjustments. The warrant transactions will have a dilutive effect with respect to our common stock to the extent that the price per share of our common stock exceeds the strike price of the warrants unless we elect, subject to certain conditions, to settle the warrants in cash. The strike price of the warrant transactions is initially $189.00 per share. Refer to Note 10—Convertible Senior Notes in our consolidated financial statements.
0.00% Convertible Senior Notes due 2023
In connection with the issuance of the 2023 Notes, we entered into privately-negotiated convertible note hedge transactions with certain counterparties. The convertible note hedge transactions relate to, collectively, 1.7 million shares of our common stock, which represents the number of shares of our common stock underlying the 2023 Notes, subject to anti-dilution adjustments substantially similar to those applicable to the 2023 Notes. These convertible note hedge transactions are expected to reduce the potential earnings dilution with respect to our common stock upon conversion of the 2023 Notes and/or reduce our exposure to potential cash or stock payments that may be required upon conversion of the 2023 Notes.
We also entered into separate warrant transactions with the same group of counterparties initially relating to the number of shares of our common stock underlying the convertible note hedge transactions, subject to customary anti-dilution adjustments. The warrant transactions will have a dilutive effect with respect to our common stock to the extent that the price per share of our common stock exceeds the strike price of the warrants unless we elect, subject to certain conditions, to settle the warrants in cash. The strike price of the warrant transactions is initially $309.84 per share. Refer to Note 10—Convertible Senior Notes in our consolidated financial statements.
Impact of Inflation
Our results of operations and financial condition are presented based on historical cost. While it is difficult to accurately measure the impact of inflation due to the imprecise nature of the estimates required, we believe the effects of inflation, if any, on our consolidated results of operations and financial condition have been immaterial.
78
REPORT OF INDEPENDENT REGISTERED PUBLIC ACCOUNTING FIRM
To the Board of Directors and Stockholders of RH
Opinions on the Financial Statements and Internal Control over Financial Reporting
We have audited the accompanying consolidated balance sheets of RH and its subsidiaries (the “Company”) as of February 2, 2019 and February 3, 2018, and the related consolidated statements of income, comprehensive income, stockholders’ equity (deficit) and cash flows for each of the three years in the period ended February 2, 2019, including the related notes (collectively referred to as the “consolidated financial statements”). We also have audited the Company’s internal control over financial reporting as of February 2, 2019, based on criteria established in Internal Control - Integrated Framework (2013) issued by the Committee of Sponsoring Organizations of the Treadway Commission (COSO).
In our opinion, the consolidated financial statements referred to above present fairly, in all material respects, the financial position of the Company as of February 2, 2019 and February 3, 2018, and the results of its operations and its cash flows for each of the three years in the period ended February 2, 2019 in conformity with accounting principles generally accepted in the United States of America. Also in our opinion, the Company maintained, in all material respects, effective internal control over financial reporting as of February 2, 2019, based on criteria established in Internal Control - Integrated Framework (2013) issued by the COSO.
Change in Accounting Principles
As discussed in Note 3 to the consolidated financial statements, the Company changed the manner in which it accounts for revenues from contracts with customers and the manner in which it accounts for restricted cash in fiscal 2018.
Basis for Opinions
The Company’s management is responsible for these consolidated financial statements, for maintaining effective internal control over financial reporting, and for its assessment of the effectiveness of internal control over financial reporting, included in Management’s Report on Internal Control Over Financial Reporting appearing under Item 9A. Our responsibility is to express opinions on the Company’s consolidated financial statements and on the Company’s internal control over financial reporting based on our audits. We are a public accounting firm registered with the Public Company Accounting Oversight Board (United States) (PCAOB) and are required to be independent with respect to the Company in accordance with the U.S. federal securities laws and the applicable rules and regulations of the Securities and Exchange Commission and the PCAOB.
We conducted our audits in accordance with the standards of the PCAOB. Those standards require that we plan and perform the audits to obtain reasonable assurance about whether the consolidated financial statements are free of material misstatement, whether due to error or fraud, and whether effective internal control over financial reporting was maintained in all material respects.
Our audits of the consolidated financial statements included performing procedures to assess the risks of material misstatement of the consolidated financial statements, whether due to error or fraud, and performing procedures that respond to those risks. Such procedures included examining, on a test basis, evidence regarding the amounts and disclosures in the consolidated financial statements. Our audits also included evaluating the accounting principles used and significant estimates made by management, as well as evaluating the overall presentation of the consolidated financial statements. Our audit of internal control over financial reporting included obtaining an understanding of internal control over financial reporting, assessing the risk that a material weakness exists, and testing and evaluating the design and operating effectiveness of internal control based on the assessed risk. Our audits also included performing such other procedures as we considered necessary in the circumstances. We believe that our audits provide a reasonable basis for our opinions.
Definition and Limitations of Internal Control over Financial Reporting
A company’s internal control over financial reporting is a process designed to provide reasonable assurance regarding the reliability of financial reporting and the preparation of financial statements for external purposes in accordance with generally accepted accounting principles. A company’s internal control over financial reporting includes those policies and procedures that (i) pertain to the maintenance of records that, in reasonable detail, accurately and fairly reflect the transactions and dispositions of the assets of the company; (ii) provide reasonable assurance that transactions are recorded as necessary to permit preparation of financial statements in accordance with generally accepted accounting principles, and that receipts and expenditures of the company are being made only in accordance with authorizations of management and directors of the company; and (iii) provide reasonable assurance regarding prevention or timely detection of unauthorized acquisition, use, or disposition of the company’s assets that could have a material effect on the financial statements.
79
Because of its inherent limitations, internal control over financial reporting may not prevent or detect misstatements. Also, projections of any evaluation of effectiveness to future periods are subject to the risk that controls may become inadequate because of changes in conditions, or that the degree of compliance with the policies or procedures may deteriorate.
/s/ PricewaterhouseCoopers LLP
San Francisco, California
March 29, 2019
We have served as the Company’s auditor since 2008.
80
CONSOLIDATED BALANCE SHEETS
(In thousands, except share amounts)
|
|
|
February 2, |
|
|
February 3, |
|
||
|
|
|
2019 |
|
|
2018 |
|
||
|
|
|
|
|
|
|
As Revised |
|
|
|
ASSETS |
|
|
|
|
|
|
|
|
|
Current assets: |
|
|
|
|
|
|
|
|
|
Cash and cash equivalents |
|
$ |
5,803 |
|
|
$ |
17,907 |
|
|
Accounts receivable—net |
|
|
40,224 |
|
|
|
31,412 |
|
|
Merchandise inventories |
|
|
531,947 |
|
|
|
527,026 |
|
|
Prepaid expense and other current assets |
|
|
104,719 |
|
|
|
68,585 |
|
|
Total current assets |
|
|
682,693 |
|
|
|
644,930 |
|
|
Property and equipment—net |
|
|
863,562 |
|
|
|
800,698 |
|
|
Goodwill |
|
|
124,379 |
|
|
|
141,893 |
|
|
Tradenames, trademarks and domain names |
|
|
86,022 |
|
|
|
100,663 |
|
|
Other intangible assets—net |
|
|
— |
|
|
|
39 |
|
|
Deferred tax assets |
|
|
30,033 |
|
|
|
23,311 |
|
|
Other non-current assets |
|
|
19,345 |
|
|
|
21,332 |
|
|
Total assets |
|
$ |
1,806,034 |
|
|
$ |
1,732,866 |
|
|
LIABILITIES AND STOCKHOLDERS’ DEFICIT |
|
|
|
|
|
|
|
|
|
Current liabilities: |
|
|
|
|
|
|
|
|
|
Accounts payable and accrued expenses |
|
$ |
320,441 |
|
|
$ |
318,765 |
|
|
Deferred revenue and customer deposits |
|
|
152,595 |
|
|
|
149,404 |
|
|
Convertible senior notes due 2019—net |
|
|
343,789 |
|
|
|
— |
|
|
Other current liabilities |
|
|
101,347 |
|
|
|
51,166 |
|
|
Total current liabilities |
|
|
918,172 |
|
|
|
519,335 |
|
|
Asset based credit facility |
|
|
57,500 |
|
|
|
199,970 |
|
|
Term loan—net |
|
|
— |
|
|
|
79,499 |
|
|
Convertible senior notes due 2019—net |
|
|
— |
|
|
|
327,731 |
|
|
Convertible senior notes due 2020—net |
|
|
271,157 |
|
|
|
252,994 |
|
|
Convertible senior notes due 2023—net |
|
|
249,151 |
|
|
|
— |
|
|
Financing obligations under build-to-suit lease transactions |
|
|
228,928 |
|
|
|
229,323 |
|
|
Deferred rent and lease incentives |
|
|
53,742 |
|
|
|
54,983 |
|
|
Other non-current obligations |
|
|
50,346 |
|
|
|
76,367 |
|
|
Total liabilities |
|
|
1,828,996 |
|
|
|
1,740,202 |
|
|
Commitments and contingencies (Note 19) |
|
|
— |
|
|
|
— |
|
|
Stockholders’ deficit: |
|
|
|
|
|
|
|
|
|
Preferred stock, $0.0001 par value per share, 10,000,000 shares authorized, no shares issued or outstanding as of February 2, 2019 and February 3, 2018 |
|
|
— |
|
|
|
— |
|
|
Common stock, $0.0001 par value per share, 180,000,000 shares authorized, 20,480,613 shares issued and 20,477,813 shares outstanding as of February 2, 2019; 41,737,470 shares issued and 21,517,338 shares outstanding as of February 3, 2018 |
|
|
2 |
|
|
|
2 |
|
|
Additional paid-in capital |
|
|
356,422 |
|
|
|
840,765 |
|
|
Accumulated other comprehensive loss |
|
|
(2,333 |
) |
|
|
(171 |
) |
|
Retained earnings (accumulated deficit) |
|
|
(376,810 |
) |
|
|
152,394 |
|
|
Treasury stock—at cost, 2,800 shares as of February 2, 2019 and 20,220,132 shares as of February 3, 2018 |
|
|
(243 |
) |
|
|
(1,000,326 |
) |
|
Total stockholders’ deficit |
|
|
(22,962 |
) |
|
|
(7,336 |
) |
|
Total liabilities and stockholders’ deficit |
|
$ |
1,806,034 |
|
|
$ |
1,732,866 |
|
The accompanying notes are an integral part of these Consolidated Financial Statements.
81
CONSOLIDATED STATEMENTS OF INCOME
(In thousands, except share and per share amounts)
|
|
|
Year Ended |
|
|||||||||
|
|
|
February 2, |
|
|
February 3, |
|
|
January 28, |
|
|||
|
|
|
2019 |
|
|
2018 |
|
|
2017 |
|
|||
|
Net revenues |
|
$ |
2,505,653 |
|
|
$ |
2,440,174 |
|
|
$ |
2,134,871 |
|
|
Cost of goods sold |
|
|
1,504,806 |
|
|
|
1,591,107 |
|
|
|
1,455,084 |
|
|
Gross profit |
|
|
1,000,847 |
|
|
|
849,067 |
|
|
|
679,787 |
|
|
Selling, general and administrative expenses |
|
|
711,617 |
|
|
|
717,766 |
|
|
|
626,751 |
|
|
Income from operations |
|
|
289,230 |
|
|
|
131,301 |
|
|
|
53,036 |
|
|
Other expenses |
|
|
|
|
|
|
|
|
|
|
|
|
|
Interest expense—net |
|
|
75,074 |
|
|
|
62,570 |
|
|
|
44,482 |
|
|
Goodwill and tradename impairment |
|
|
32,086 |
|
|
|
33,700 |
|
|
|
— |
|
|
Loss on extinguishment of debt |
|
|
917 |
|
|
|
4,880 |
|
|
|
— |
|
|
Total other expenses |
|
|
108,077 |
|
|
|
101,150 |
|
|
|
44,482 |
|
|
Income before income taxes |
|
|
181,153 |
|
|
|
30,151 |
|
|
|
8,554 |
|
|
Income tax expense |
|
|
30,514 |
|
|
|
27,971 |
|
|
|
3,153 |
|
|
Net income |
|
$ |
150,639 |
|
|
$ |
2,180 |
|
|
$ |
5,401 |
|
|
Weighted-average shares used in computing basic net income per share |
|
|
21,613,678 |
|
|
|
27,053,616 |
|
|
|
40,691,483 |
|
|
Basic net income per share |
|
$ |
6.97 |
|
|
$ |
0.08 |
|
|
$ |
0.13 |
|
|
Weighted-average shares used in computing diluted net income per share |
|
|
26,533,225 |
|
|
|
29,253,208 |
|
|
|
40,926,840 |
|
|
Diluted net income per share |
|
$ |
5.68 |
|
|
$ |
0.07 |
|
|
$ |
0.13 |
|
The accompanying notes are an integral part of these Consolidated Financial Statements.
82
CONSOLIDATED STATEMENTS OF COMPREHENSIVE INCOME
(In thousands)
|
|
|
Year Ended |
|
|||||||||
|
|
|
February 2, |
|
|
February 3, |
|
|
January 28, |
|
|||
|
|
|
2019 |
|
|
2018 |
|
|
2017 |
|
|||
|
Net income |
|
$ |
150,639 |
|
|
$ |
2,180 |
|
|
$ |
5,401 |
|
|
Net gains (losses) from foreign currency translation |
|
|
(2,162 |
) |
|
|
1,510 |
|
|
|
1,003 |
|
|
Net unrealized holding gains on available-for-sale investments |
|
|
— |
|
|
|
11 |
|
|
|
5 |
|
|
Total comprehensive income |
|
$ |
148,477 |
|
|
$ |
3,701 |
|
|
$ |
6,409 |
|
The accompanying notes are an integral part of these Consolidated Financial Statements.
83
CONSOLIDATED STATEMENTS OF STOCKHOLDERS’ EQUITY (DEFICIT)
(In thousands, except share amounts)
|
|
|
Common Stock |
|
|
Additional Paid-In |
|
|
Accumulated Other Comprehensive |
|
|
Retained Earnings (Accumulated |
|
|
Treasury Stock |
|
|
Total Stockholders’ Equity |
|
||||||||||||||
|
|
|
Shares |
|
|
Amount |
|
|
Capital |
|
|
Income (Loss) |
|
|
Deficit) |
|
|
Shares |
|
|
Amount |
|
|
(Deficit) |
|
||||||||
|
Balances—January 30, 2016 |
|
|
40,583,275 |
|
|
|
4 |
|
|
|
763,566 |
|
|
|
(2,700 |
) |
|
|
144,813 |
|
|
|
294,888 |
|
|
|
(19,523 |
) |
|
|
886,160 |
|
|
Stock-based compensation |
|
|
— |
|
|
|
— |
|
|
|
28,930 |
|
|
|
— |
|
|
|
— |
|
|
|
— |
|
|
|
— |
|
|
|
28,930 |
|
|
Issuance of restricted stock |
|
|
33,555 |
|
|
|
— |
|
|
|
— |
|
|
|
— |
|
|
|
— |
|
|
|
— |
|
|
|
— |
|
|
|
— |
|
|
Vested and delivered restricted stock units |
|
|
88,538 |
|
|
|
— |
|
|
|
(1,531 |
) |
|
|
— |
|
|
|
— |
|
|
|
— |
|
|
|
— |
|
|
|
(1,531 |
) |
|
Exercise of stock options—including tax benefit |
|
|
123,265 |
|
|
|
— |
|
|
|
(99 |
) |
|
|
— |
|
|
|
— |
|
|
|
— |
|
|
|
— |
|
|
|
(99 |
) |
|
Net income |
|
|
— |
|
|
|
— |
|
|
|
— |
|
|
|
— |
|
|
|
5,401 |
|
|
|
— |
|
|
|
— |
|
|
|
5,401 |
|
|
Net gains from foreign currency translation |
|
|
— |
|
|
|
— |
|
|
|
— |
|
|
|
1,003 |
|
|
|
— |
|
|
|
— |
|
|
|
— |
|
|
|
1,003 |
|
|
Net unrealized holding gains (losses) on investments |
|
|
— |
|
|
|
— |
|
|
|
— |
|
|
|
5 |
|
|
|
— |
|
|
|
— |
|
|
|
— |
|
|
|
5 |
|
|
Balances—January 28, 2017 |
|
|
40,828,633 |
|
|
|
4 |
|
|
|
790,866 |
|
|
|
(1,692 |
) |
|
|
150,214 |
|
|
|
294,888 |
|
|
|
(19,523 |
) |
|
|
919,869 |
|
|
Stock-based compensation |
|
|
— |
|
|
|
— |
|
|
|
50,283 |
|
|
|
— |
|
|
|
— |
|
|
|
— |
|
|
|
— |
|
|
|
50,283 |
|
|
Issuance of restricted stock |
|
|
15,631 |
|
|
|
— |
|
|
|
— |
|
|
|
— |
|
|
|
— |
|
|
|
— |
|
|
|
— |
|
|
|
— |
|
|
Vested and delivered restricted stock units |
|
|
197,660 |
|
|
|
— |
|
|
|
(4,504 |
) |
|
|
— |
|
|
|
— |
|
|
|
— |
|
|
|
— |
|
|
|
(4,504 |
) |
|
Exercise of stock options |
|
|
695,546 |
|
|
|
— |
|
|
|
23,643 |
|
|
|
— |
|
|
|
— |
|
|
|
— |
|
|
|
— |
|
|
|
23,643 |
|
|
Repurchases of common stock |
|
|
(20,220,132 |
) |
|
|
(2 |
) |
|
|
— |
|
|
|
— |
|
|
|
— |
|
|
|
20,220,132 |
|
|
|
(1,000,326 |
) |
|
|
(1,000,328 |
) |
|
Retirement of treasury stock |
|
|
— |
|
|
|
— |
|
|
|
(19,523 |
) |
|
|
— |
|
|
|
— |
|
|
|
(294,888 |
) |
|
|
19,523 |
|
|
|
— |
|
|
Net income |
|
|
— |
|
|
|
— |
|
|
|
— |
|
|
|
— |
|
|
|
2,180 |
|
|
|
— |
|
|
|
— |
|
|
|
2,180 |
|
|
Net gains from foreign currency translation |
|
|
— |
|
|
|
— |
|
|
|
— |
|
|
|
1,510 |
|
|
|
— |
|
|
|
— |
|
|
|
— |
|
|
|
1,510 |
|
|
Net unrealized holding gains (losses) on investments |
|
|
— |
|
|
|
— |
|
|
|
— |
|
|
|
11 |
|
|
|
— |
|
|
|
— |
|
|
|
— |
|
|
|
11 |
|
|
Balances—February 3, 2018 —As Revised |
|
|
21,517,338 |
|
|
|
2 |
|
|
|
840,765 |
|
|
|
(171 |
) |
|
|
152,394 |
|
|
|
20,220,132 |
|
|
|
(1,000,326 |
) |
|
|
(7,336 |
) |
|
Stock-based compensation |
|
|
— |
|
|
|
— |
|
|
|
23,557 |
|
|
|
— |
|
|
|
— |
|
|
|
— |
|
|
|
— |
|
|
|
23,557 |
|
|
Issuance of restricted stock |
|
|
6,405 |
|
|
|
— |
|
|
|
— |
|
|
|
— |
|
|
|
— |
|
|
|
— |
|
|
|
— |
|
|
|
— |
|
|
Vested and delivered restricted stock units |
|
|
122,177 |
|
|
|
— |
|
|
|
(9,502 |
) |
|
|
— |
|
|
|
— |
|
|
|
— |
|
|
|
— |
|
|
|
(9,502 |
) |
|
Exercise of stock options |
|
|
882,272 |
|
|
|
— |
|
|
|
44,024 |
|
|
|
— |
|
|
|
— |
|
|
|
— |
|
|
|
— |
|
|
|
44,024 |
|
|
Repurchases of common stock |
|
|
(2,050,379 |
) |
|
|
|
|
|
|
— |
|
|
|
— |
|
|
|
— |
|
|
|
2,050,379 |
|
|
|
(250,243 |
) |
|
|
(250,243 |
) |
|
Retirement of treasury stock |
|
|
— |
|
|
|
— |
|
|
|
(591,519 |
) |
|
|
— |
|
|
|
(658,807 |
) |
|
|
(22,267,711 |
) |
|
|
1,250,326 |
|
|
|
— |
|
|
Equity component value of convertible note issuance—net |
|
|
— |
|
|
|
— |
|
|
|
89,933 |
|
|
|
— |
|
|
|
— |
|
|
|
— |
|
|
|
— |
|
|
|
89,933 |
|
|
Sale of common stock warrant |
|
|
— |
|
|
|
— |
|
|
|
51,021 |
|
|
|
— |
|
|
|
— |
|
|
|
— |
|
|
|
— |
|
|
|
51,021 |
|
|
Purchase of convertible note hedge |
|
|
— |
|
|
|
— |
|
|
|
(91,857 |
) |
|
|
— |
|
|
|
— |
|
|
|
— |
|
|
|
— |
|
|
|
(91,857 |
) |
|
Impact of Topic 606 adoption (Note 3) |
|
|
— |
|
|
|
— |
|
|
|
— |
|
|
|
— |
|
|
|
(21,036 |
) |
|
|
— |
|
|
|
— |
|
|
|
(21,036 |
) |
|
Net income |
|
|
— |
|
|
|
— |
|
|
|
— |
|
|
|
— |
|
|
|
150,639 |
|
|
|
— |
|
|
|
— |
|
|
|
150,639 |
|
|
Net losses from foreign currency translation |
|
|
— |
|
|
|
— |
|
|
|
— |
|
|
|
(2,162 |
) |
|
|
— |
|
|
|
— |
|
|
|
— |
|
|
|
(2,162 |
) |
|
Balances—February 2, 2019 |
|
|
20,477,813 |
|
|
$ |
2 |
|
|
$ |
356,422 |
|
|
$ |
(2,333 |
) |
|
$ |
(376,810 |
) |
|
|
2,800 |
|
|
$ |
(243 |
) |
|
$ |
(22,962 |
) |
The accompanying notes are an integral part of these Consolidated Financial Statements.
84
CONSOLIDATED STATEMENTS OF CASH FLOWS
(In thousands)
|
|
|
Year Ended |
|
|||||||||
|
|
|
February 2, |
|
|
February 3, |
|
|
January 28, |
|
|||
|
|
|
2019 |
|
|
2018 |
|
|
2017 |
|
|||
|
CASH FLOWS FROM OPERATING ACTIVITIES |
|
|
|
|
|
|
|
|
|
|
|
|
|
Net income |
|
$ |
150,639 |
|
|
$ |
2,180 |
|
|
$ |
5,401 |
|
|
Adjustments to reconcile net income to net cash provided by operating activities: |
|
|
|
|
|
|
|
|
|
|
|
|
|
Depreciation and amortization |
|
|
74,346 |
|
|
|
70,135 |
|
|
|
56,995 |
|
|
Goodwill and tradename impairment |
|
|
32,086 |
|
|
|
33,700 |
|
|
|
— |
|
|
Assets impairments and lease losses |
|
|
5,634 |
|
|
|
6,481 |
|
|
|
17,137 |
|
|
Product recalls |
|
|
6,874 |
|
|
|
7,707 |
|
|
|
4,615 |
|
|
Net non-cash charges resulting from inventory step-up |
|
|
380 |
|
|
|
2,527 |
|
|
|
6,835 |
|
|
Amortization of purchase premiums and accretion of purchases discount—net |
|
|
— |
|
|
|
99 |
|
|
|
1,022 |
|
|
Amortization of debt discount |
|
|
41,868 |
|
|
|
30,457 |
|
|
|
28,822 |
|
|
Excess tax shortfall from exercise of stock options |
|
|
— |
|
|
|
— |
|
|
|
3,288 |
|
|
Stock-based compensation expense |
|
|
23,983 |
|
|
|
50,709 |
|
|
|
29,214 |
|
|
Loss on extinguishment of debt |
|
|
917 |
|
|
|
4,880 |
|
|
|
— |
|
|
Deferred income taxes |
|
|
263 |
|
|
|
6,572 |
|
|
|
(221 |
) |
|
Other non-cash interest expense |
|
|
4,410 |
|
|
|
5,325 |
|
|
|
3,121 |
|
|
Change in assets and liabilities—net of acquisition: |
|
|
|
|
|
|
|
|
|
|
|
|
|
Accounts receivable |
|
|
(8,883 |
) |
|
|
2,758 |
|
|
|
588 |
|
|
Merchandise inventories |
|
|
(7,399 |
) |
|
|
220,767 |
|
|
|
(4,304 |
) |
|
Prepaid expense and other assets |
|
|
(78,454 |
) |
|
|
44,252 |
|
|
|
(35,222 |
) |
|
Accounts payable and accrued expenses |
|
|
(452 |
) |
|
|
64,460 |
|
|
|
(50,307 |
) |
|
Deferred revenue and customer deposits |
|
|
8,413 |
|
|
|
3,366 |
|
|
|
23,977 |
|
|
Other current liabilities |
|
|
51,215 |
|
|
|
680 |
|
|
|
(23,820 |
) |
|
Deferred rent and lease incentives |
|
|
(1,111 |
) |
|
|
1,059 |
|
|
|
4,662 |
|
|
Other non-current obligations |
|
|
(4,173 |
) |
|
|
(1,297 |
) |
|
|
8,709 |
|
|
Net cash provided by operating activities |
|
|
300,556 |
|
|
|
556,817 |
|
|
|
80,512 |
|
|
CASH FLOWS FROM INVESTING ACTIVITIES |
|
|
|
|
|
|
|
|
|
|
|
|
|
Capital expenditures |
|
|
(136,736 |
) |
|
|
(146,194 |
) |
|
|
(170,031 |
) |
|
Purchase of trademarks and domain names |
|
|
— |
|
|
|
(39 |
) |
|
|
(322 |
) |
|
Proceeds from sale of assets held for sale—net |
|
|
— |
|
|
|
15,123 |
|
|
|
— |
|
|
Purchase of investments |
|
|
— |
|
|
|
(16,109 |
) |
|
|
(248,485 |
) |
|
Maturities of investments |
|
|
— |
|
|
|
46,890 |
|
|
|
187,338 |
|
|
Sales of investments |
|
|
— |
|
|
|
145,020 |
|
|
|
37,096 |
|
|
Acquisition of business—net of cash acquired |
|
|
— |
|
|
|
— |
|
|
|
(116,100 |
) |
|
Net cash provided by (used in) investing activities |
|
|
(136,736 |
) |
|
|
44,691 |
|
|
|
(310,504 |
) |
|
CASH FLOWS FROM FINANCING ACTIVITIES |
|
|
|
|
|
|
|
|
|
|
|
|
|
Borrowing under asset based credit facility |
|
|
866,500 |
|
|
|
600,000 |
|
|
|
— |
|
|
Repayments under asset based credit facility |
|
|
(1,008,970 |
) |
|
|
(400,030 |
) |
|
|
— |
|
|
Borrowings under term loans |
|
|
— |
|
|
|
180,000 |
|
|
|
— |
|
|
Repayments under term loans |
|
|
(80,000 |
) |
|
|
(103,000 |
) |
|
|
— |
|
|
Borrowing under promissory and equipment security notes |
|
|
— |
|
|
|
34,000 |
|
|
|
— |
|
|
Repayments under promissory and equipment security notes |
|
|
(31,974 |
) |
|
|
(2,319 |
) |
|
|
— |
|
|
Debt issuance costs |
|
|
— |
|
|
|
(8,298 |
) |
|
|
— |
|
|
Proceeds from issuance of convertible senior notes |
|
|
335,000 |
|
|
|
— |
|
|
|
— |
|
|
Proceeds from issuance of warrants |
|
|
51,021 |
|
|
|
— |
|
|
|
— |
|
|
Purchase of convertible note hedges |
|
|
(91,857 |
) |
|
|
— |
|
|
|
— |
|
|
Debt issuance costs related to convertible senior notes |
|
|
(6,349 |
) |
|
|
— |
|
|
|
— |
|
|
Repurchases of common stock—including commissions |
|
|
(250,000 |
) |
|
|
(1,000,326 |
) |
|
|
— |
|
|
Borrowing on build-to-suit lease transactions |
|
|
7,077 |
|
|
|
— |
|
|
|
— |
|
|
Payments on build-to-suit lease transactions |
|
|
(7,452 |
) |
|
|
(10,200 |
) |
|
|
— |
|
|
Proceeds from exercise of stock options |
|
|
44,024 |
|
|
|
24,896 |
|
|
|
3,261 |
|
|
Excess tax shortfall from exercise of stock options |
|
|
— |
|
|
|
— |
|
|
|
(3,288 |
) |
|
Tax withholdings related to issuance of stock-based awards |
|
|
(9,502 |
) |
|
|
(5,759 |
) |
|
|
(1,603 |
) |
|
Other financing activities |
|
|
(719 |
) |
|
|
(377 |
) |
|
|
(611 |
) |
|
Net cash used in financing activities |
|
|
(183,201 |
) |
|
|
(691,413 |
) |
|
|
(2,241 |
) |
|
Effects of foreign currency exchange rate translation |
|
|
(130 |
) |
|
|
152 |
|
|
|
449 |
|
|
Net decrease in cash and cash equivalents and restricted cash equivalents |
|
|
(19,511 |
) |
|
|
(89,753 |
) |
|
|
(231,784 |
) |
|
Cash and cash equivalents |
|
|
|
|
|
|
|
|
|
|
|
|
|
Beginning of period—cash and cash equivalents |
|
|
17,907 |
|
|
|
87,023 |
|
|
|
331,467 |
|
|
Beginning of period—restricted cash equivalents (construction related deposits) |
|
|
7,407 |
|
|
|
28,044 |
|
|
|
15,384 |
|
|
Beginning of period—cash and cash equivalents and restricted cash equivalents |
|
$ |
25,314 |
|
|
$ |
115,067 |
|
|
$ |
346,851 |
|
|
|
|
|
|
|
|
|
|
|
|
|
|
|
|
End of period—cash and cash equivalents |
|
|
5,803 |
|
|
|
17,907 |
|
|
|
87,023 |
|
|
End of period—restricted cash equivalents (construction related deposits) |
|
|
— |
|
|
|
7,407 |
|
|
|
28,044 |
|
|
End of period—cash and cash equivalents and restricted cash equivalents |
|
$ |
5,803 |
|
|
$ |
25,314 |
|
|
$ |
115,067 |
|
|
Cash paid for interest |
|
$ |
31,154 |
|
|
$ |
28,180 |
|
|
$ |
16,615 |
|
|
Cash paid for taxes |
|
|
41,289 |
|
|
|
4,025 |
|
|
|
48,464 |
|
|
Non-cash transactions: |
|
|
|
|
|
|
|
|
|
|
|
|
|
Property and equipment additions in accounts payable and accrued expenses at period-end |
|
|
19,978 |
|
|
|
25,182 |
|
|
|
9,201 |
|
|
Property and equipment additions due to build-to-suit lease transactions |
|
|
7,644 |
|
|
|
35,386 |
|
|
|
55,991 |
|
|
Property and equipment additions from unpaid construction related deposits |
|
|
2,807 |
|
|
|
5,091 |
|
|
|
3,807 |
|
|
Property and equipment acquired under capital lease |
|
|
1,534 |
|
|
|
847 |
|
|
|
16 |
|
|
Issuance of non-current notes payable related to share repurchases from former employees |
|
|
243 |
|
|
|
— |
|
|
|
— |
|
|
Property and equipment reduction due to build-to-suit lease transaction termination |
|
|
(8,143 |
) |
|
|
— |
|
|
|
— |
|
The accompanying notes are an integral part of these Consolidated Financial Statements.
85
NOTES TO CONSOLIDATED FINANCIAL STATEMENTS
NOTE 1—NATURE OF BUSINESS
RH, a Delaware corporation, together with its subsidiaries (collectively, the “Company”), is a luxury home furnishings retailer that offers a growing number of categories, including furniture, lighting, textiles, bathware, décor, outdoor and garden, and child and teen furnishings. These products are sold through the Company’s stores, catalogs and websites.
On May 27, 2016, the Company acquired a controlling interest in Design Investors WW Acquisition Company, LLC, which owns the business operating under the name “Waterworks.” Refer to Note 4—Business Combination.
As of February 2, 2019, the Company operated a total of 86 retail Galleries and 39 outlet stores in 32 states, the District of Columbia and Canada, and includes 15 Waterworks showrooms throughout the United States and in the U.K., and had sourcing operations in Shanghai and Hong Kong.
NOTE 2—ORGANIZATION
The Company was formed on August 18, 2011 and capitalized on September 2, 2011 as a holding company for the purposes of facilitating an initial public offering of common equity and was at such time a direct subsidiary of Home Holdings, LLC, a Delaware limited liability company (“Home Holdings”).
On November 1, 2012, the Company acquired all of the outstanding shares of capital stock of Restoration Hardware, Inc., a Delaware corporation, and Restoration Hardware, Inc. became a direct, wholly owned subsidiary of the Company. Restoration Hardware, Inc. was a direct, wholly owned subsidiary of Home Holdings LLC, a Delaware limited liability company (“Home Holdings”) prior to the Company’s initial public offering. Outstanding units issued by Home Holdings under its equity compensation plan, referred to as the Team Resto Ownership Plan, were replaced with common stock of the Company at the time of its initial public offering. These transactions are referred to as the “Reorganization.” On November 7, 2012, the Company completed its initial public offering.
On December 15, 2016, Restoration Hardware Holdings, Inc. filed a Certificate of Amendment to its Amended and Restated Certificate of Incorporation with the Secretary of State of the State of Delaware to change its name to “RH,” effective January 1, 2017.
Convertible Senior Notes
In June 2018, the Company issued in a private offering $300 million principal amount of 0.00% convertible senior notes due 2023 and issued an additional $35 million principal amount in connection with the overallotment option granted to the initial purchasers (collectively, the “2023 Notes”). In connection with the issuance of these notes, the Company entered into convertible note hedge transactions for which it paid an aggregate amount of $91.9 million. In addition, the Company sold warrants for which it received aggregate proceeds of $51.0 million. Taken together, the Company received total cash proceeds of $287.8 million, net of discounts upon original issuance and offering costs of $6.3 million. Refer to Note 10—Convertible Senior Notes.
NOTE 3—SIGNIFICANT ACCOUNTING POLICIES
Basis of Presentation
These consolidated financial statements are prepared in conformity with accounting principles generally accepted in the United States (“GAAP”). The consolidated financial statements include the accounts of the Company and its wholly owned subsidiaries. Accordingly, all intercompany balances and transactions have been eliminated through the consolidation process.
Revision
During the third quarter of fiscal 2018, management determined that the Company had incorrectly reported the impact during the fiscal year ended February 3, 2018 of retiring its common stock in accordance with Accounting Standards Codification (“ASC”) 505—Equity. The common stock retired in fiscal 2017 was related to shares repurchased under the Company’s equity plans. This resulted in an overstatement of treasury stock of $19.5 million and an overstatement of additional paid-in capital of $19.5 million on the consolidated balance sheets as of February 3, 2018, May 5, 2018 and August 4, 2018. There was no impact on the consolidated statements of income or cash flows related to this misstatement. This error was not considered to be material to any of the previously issued annual or interim financial statements.
86
The following are selected line items from the Company’s consolidated balance sheets and consolidated statements of stockholders’ equity (deficit) illustrating the effect of the revision (in thousands):
|
|
|
Consolidated Balance Sheets |
|
|||||||||
|
|
|
February 3, 2018 |
|
|||||||||
|
|
|
As Reported |
|
|
Adjustment |
|
|
As Revised |
|
|||
|
Stockholders’ deficit: |
|
|
|
|
|
|
|
|
|
|
|
|
|
Common stock |
|
$ |
2 |
|
|
$ |
— |
|
|
$ |
2 |
|
|
Additional paid-in capital |
|
|
860,288 |
|
|
|
(19,523 |
) |
|
|
840,765 |
|
|
Accumulated other comprehensive income |
|
|
(171 |
) |
|
|
— |
|
|
|
(171 |
) |
|
Retained earnings |
|
|
152,394 |
|
|
|
— |
|
|
|
152,394 |
|
|
Treasury stock |
|
|
(1,019,849 |
) |
|
|
19,523 |
|
|
|
(1,000,326 |
) |
|
Total stockholders’ deficit |
|
$ |
(7,336 |
) |
|
$ |
— |
|
|
$ |
(7,336 |
) |
|
|
|
|
|
|
|
|
|
|
|
|
|
|
|
|
|
Unaudited Condensed Consolidated Balance Sheets |
|
|||||||||
|
|
|
May 5, 2018 |
|
|||||||||
|
|
|
As Reported |
|
|
Adjustment |
|
|
As Revised |
|
|||
|
Stockholders’ equity: |
|
|
|
|
|
|
|
|
|
|
|
|
|
Common stock |
|
$ |
2 |
|
|
$ |
— |
|
|
$ |
2 |
|
|
Additional paid-in capital |
|
|
870,751 |
|
|
|
(19,523 |
) |
|
|
851,228 |
|
|
Accumulated other comprehensive income |
|
|
(1,436 |
) |
|
|
— |
|
|
|
(1,436 |
) |
|
Retained earnings |
|
|
159,417 |
|
|
|
— |
|
|
|
159,417 |
|
|
Treasury stock |
|
|
(1,020,092 |
) |
|
|
19,523 |
|
|
|
(1,000,569 |
) |
|
Total stockholders’ equity |
|
$ |
8,642 |
|
|
$ |
— |
|
|
$ |
8,642 |
|
|
|
|
|
|
|
|
|
|
|
|
|
|
|
|
|
|
Unaudited Condensed Consolidated Balance Sheets |
|
|||||||||
|
|
|
August 4, 2018 |
|
|||||||||
|
|
|
As Reported |
|
|
Adjustment |
|
|
As Revised |
|
|||
|
Stockholders’ equity: |
|
|
|
|
|
|
|
|
|
|
|
|
|
Common stock |
|
$ |
2 |
|
|
$ |
— |
|
|
$ |
2 |
|
|
Additional paid-in capital |
|
|
944,610 |
|
|
|
(19,523 |
) |
|
|
925,087 |
|
|
Accumulated other comprehensive income |
|
|
(1,918 |
) |
|
|
— |
|
|
|
(1,918 |
) |
|
Retained earnings |
|
|
223,459 |
|
|
|
— |
|
|
|
223,459 |
|
|
Treasury stock |
|
|
(1,020,092 |
) |
|
|
19,523 |
|
|
|
(1,000,569 |
) |
|
Total stockholders’ equity |
|
$ |
146,061 |
|
|
$ |
— |
|
|
$ |
146,061 |
|
Fiscal Years
The Company’s fiscal year ends on the Saturday closest to January 31. As a result, the Company’s fiscal year may include 53 weeks. The fiscal years ended February 2, 2019 (“fiscal 2018”) and January 28, 2017 (“fiscal 2016”) each consisted of 52 weeks. The fiscal year ended February 3, 2018 (“fiscal 2017”) consisted of 53 weeks.
Use of Accounting Estimates
The preparation of the Company’s consolidated financial statements in conformity with GAAP requires management to make estimates and assumptions that affect the reported amounts of assets and liabilities and disclosures of contingent assets and liabilities at the date of the consolidated financial statements and the reported amounts of revenues and expenses during the reporting period. Actual results could differ from those estimates and such differences could be material to the consolidated financial statements.
Cash and Cash Equivalents
The Company considers all highly liquid investments with original maturities of 90 days or less to be cash equivalents.
87
The Company maintains its cash and cash equivalent accounts in financial institutions in both U.S. dollar and Canadian dollar denominations. Accounts at the U.S. institutions are insured by the Federal Deposit Insurance Corporation (“FDIC”) up to $250,000 and accounts at the Canadian institutions are insured by the Canada Deposit Insurance Corporation (“CDIC”) up to $100,000 Canadian dollars. As of February 2, 2019 and February 3, 2018, and at various times throughout these fiscal years, the Company had cash in financial institutions in excess of the amount insured by the FDIC and CDIC. The Company performs ongoing evaluations of these institutions to limit its concentration of credit risk.
Accounts Receivable
Accounts receivable consist primarily of receivables from the Company’s credit card processors for sales transactions, receivables related to the Company’s contract business and other miscellaneous receivables. Accounts receivable is presented net of allowance for doubtful accounts, which is recorded on a specific identification basis. The allowance for doubtful accounts was $1.9 million and $1.8 million as of February 2, 2019 and February 3, 2018, respectively.
Merchandise Inventories
The Company’s merchandise inventories are comprised of finished goods and are carried at the lower of cost or net realizable value, with cost determined on a weighted-average cost method. To determine if the value of inventory should be marked down below original cost, the Company considers current and anticipated demand, customer preference and the merchandise age. The inventory value is adjusted periodically to reflect current market conditions, which requires management judgments that may significantly affect the ending inventory valuation, as well as gross margin. The significant estimates used in inventory valuation are obsolescence (including excess and slow-moving inventory and lower of cost or net realizable value reserves) and estimates of inventory shrinkage. The Company adjusts its inventory for obsolescence based on historical trends, aging reports, specific identification and its estimates of future retail sales prices.
Reserves for shrinkage are estimated and recorded throughout the period as a percentage of shipped sales based on historical shrinkage results and current inventory levels. Actual shrinkage is recorded throughout the year based upon periodic cycle counts and the results of the Company’s annual physical inventory counts. Actual inventory shrinkage and obsolescence can vary from estimates due to factors including the mix of the Company’s inventory (which ranges from large furniture to décor) and execution against loss prevention initiatives in the Company’s stores, distribution centers, off-site storage locations and with its third-party transportation providers.
Due to these factors, the Company’s obsolescence and shrinkage reserves contain uncertainties. Both estimates have calculations that require management to make assumptions and to apply judgment regarding a number of factors, including market conditions, the selling environment, historical results and current inventory trends. If actual obsolescence or shrinkage estimates change from the Company’s original estimates, the Company will adjust its inventory reserves accordingly throughout the period. Management does not believe that changes in the assumptions used in these estimates would have a significant effect on the Company’s net income or inventory balances. The Company’s inventory reserve balances were $30.7 million and $31.4 million as of February 2, 2019 and February 3, 2018, respectively.
Product Recalls
During fiscal 2018, fiscal 2017 and fiscal 2016, the Company initiated product recalls for certain of its products. In addition, in fiscal 2018 and fiscal 2017, the Company adjusted the accrual related to certain product recalls previously initiated and received insurance reimbursements associated with certain product recalls. Product recalls had the following effect on the Company’s income before income taxes (in thousands):
|
|
|
Year Ended |
|
|||||||||
|
|
|
February 2, |
|
|
February 3, |
|
|
January 28, |
|
|||
|
|
|
2019 |
|
|
2018 |
|
|
2017 |
|
|||
|
Reduction of net revenues |
|
$ |
4,733 |
|
|
$ |
3,207 |
|
|
$ |
3,441 |
|
|
Impact on cost of goods sold |
|
|
(4,139 |
) |
|
|
4,315 |
|
|
|
535 |
|
|
Impact on gross profit |
|
|
594 |
|
|
|
7,522 |
|
|
|
3,976 |
|
|
Incremental selling, general and administrative expenses |
|
|
1,025 |
|
|
|
185 |
|
|
|
639 |
|
|
Impact on income before income taxes |
|
$ |
1,619 |
|
|
$ |
7,707 |
|
|
$ |
4,615 |
|
88
The product recall accrual as of February 2, 2019 and February 3, 2018 was $7.8 million and $1.2 million, respectively, and is included in other current liabilities on the consolidated balance sheets.
Advertising Expenses
Advertising expenses primarily represent the costs associated with the Company’s catalog mailings, as well as print and website marketing. Total advertising expense, which is recorded in selling, general and administrative expenses on the consolidated statements of income, was $97.0 million, $106.6 million and $79.8 million in fiscal 2018, fiscal 2017, and fiscal 2016, respectively.
Capitalized Catalog Costs
Capitalized catalog costs consist primarily of third-party incremental direct costs to prepare, print and distribute Source Books. Such costs are capitalized and recognized as expense upon the delivery of the Source Books to the carrier. In the case of multiple printings of a Source Book, the creative costs will be expensed in full upon the initial delivery of Source Books to the carrier.
The Company had $16.2 million and $44.1 million of capitalized catalog costs that are included in prepaid expense and other current assets on the consolidated balance sheets as of February 2, 2019, and February 3, 2018, respectively.
Website and Print Advertising
Website and print advertising expenses, which include e-commerce advertising, web creative content and direct marketing activities such as print media, radio and other media advertising, are expensed as incurred or upon the release of the content or the initial advertisement.
Property and Equipment
Property and equipment is recorded at cost, net of accumulated depreciation and amortization. Depreciation is calculated using the straight-line method, generally using the following useful lives:
|
Category of Property and Equipment |
|
Useful Life |
|
Building and building improvements |
|
40 years |
|
Machinery, equipment and aircraft |
|
3 to 10 years |
|
Furniture, fixtures and equipment |
|
3 to 7 years |
|
Computer software |
|
3 to 10 years |
The cost of leasehold improvements and lease acquisitions is amortized over the lesser of the useful life of the asset or the applicable lease term.
The Company expenses all internal-use software costs incurred in the preliminary project stage and capitalizes certain direct costs associated with the development and purchase of internal-use software, including external costs of materials and services and internal payroll costs related to the software project, within property and equipment. Capitalized costs are amortized on a straight-line basis over the estimated useful lives of the software, generally between three and ten years.
Interest is capitalized on construction in progress and software projects during the period in which expenditures have been made, activities are in progress to prepare the asset for its intended use and interest expense is being incurred. The Company capitalized interest of $3.1 million, $3.3 million and $2.4 million in fiscal 2018, fiscal 2017 and fiscal 2016, respectively. During fiscal 2018, $2.7 million of the $3.1 million capitalized interest relates to the capitalization of non-cash interest associated with the amortization of the convertible senior notes debt discount. During fiscal 2017, $2.5 million of the $3.3 million capitalized interest relates to the capitalization of non-cash interest associated with the amortization of the convertible senior notes debt discount. During fiscal 2016, all of the $2.4 million capitalized interest relates to the capitalization of non-cash interest associated with the amortization of the convertible senior notes debt discount.
Property and equipment acquired under non-cancelable leases, which meet the criteria of capital leases, are capitalized and amortized over the lesser of the useful life of the asset or the lease term. For buildings held under capital lease, unless the fair value of the land at lease inception exceeds 25% of the aggregate fair value of the leased land and building, rent payments under the leases are recognized using the effective interest method as a reduction of the capital lease obligation and interest expense. Pursuant to Accounting Standards Codification (“ASC”) 840—Leases (“ASC 840”), at lease inception, if the fair value of the underlying land exceeds 25% of the fair value of the real estate (land and building), the Company allocates a portion of the cash payments under the
89
lease to land rent expense equal to the product of the fair value of the leased land at construction commencement and the Company’s incremental borrowing rate. The remaining cash payment is treated as debt-service payments and recognized as a reduction of the capital lease obligation and an increase in interest expense.
The land purchased by the Company is recorded at cost and is a non-depreciable asset.
Property and equipment is reviewed for impairment whenever events or changes in circumstances indicate that the carrying amount of assets may not be recoverable. For further discussion regarding impairments refer to the “Impairment” accounting policy below.
Intangible Assets
Intangible assets reflect the value assigned to tradenames, trademarks, domain names and the fair market value of the Company’s leases. The Company does not amortize tradenames, trademarks and domain names as the Company defines the life of these assets as indefinite.
Impairment
Goodwill
The Company evaluates goodwill annually to determine whether it is impaired or whenever events occur or circumstances change that would indicate that the fair value of a reporting unit is less than its carrying amount. Conditions that may indicate impairment include, but are not limited to, a significant adverse change in customer demand or business climate that could affect the value of an asset; general economic conditions, such as increasing Treasury rates or unexpected changes in gross domestic product growth; a change in the Company’s market share; budget-to-actual performance and consistency of operating margins and capital expenditures; a product recall or an adverse action or assessment by a regulator; or changes in management or key personnel.
The Company performs its annual goodwill impairment testing in the fourth fiscal quarter. Historically, through its fourth quarter ended January 28, 2017, the Company applied a two-step impairment test: in step one, the carrying value of the reporting unit was compared with its fair value; in step two, which was applied when the carrying value was more than its fair value, the amount of goodwill impairment, if any, was derived by deducting the fair value of the reporting unit’s assets and liabilities from the fair value of its equity, and comparing that amount with the carrying amount of goodwill.
In January 2017, the FASB issued Accounting Standards Update No. 2017-04—Intangibles—Goodwill and Other (Topic 350) (“ASU 2017-04”). ASU 2017-04 amends the guidance to simplify the subsequent measurement of goodwill by removing step two of the goodwill impairment test (the requirement to calculate the implied fair value of goodwill to measure a goodwill impairment charge). Instead, an entity should perform its annual, or interim, goodwill impairment test by comparing the fair value of a reporting unit with its carrying amount, limited to the total amount of goodwill of the reporting unit. An entity should recognize an impairment charge for the amount by which the carrying amount exceeds the reporting unit’s fair value. The Company early adopted ASU 2017-04 in fiscal 2017 and applied the amended guidance to its annual impairment tests performed in fiscal 2017 and fiscal 2018.
The Company determines fair values using the discounted cash flow approach (“income approach”) or the market multiple valuation approach (“market approach”), when available and appropriate, or a combination of both. The Company assesses the valuation methodology based upon the relevance and availability of the data at the time it performs the valuation. If multiple valuation methodologies are used, the results are weighted appropriately.
Under the income approach, fair value is determined based on the present value of estimated future cash flows, discounted at an appropriate risk-adjusted rate. The Company uses its internal forecasts to estimate future cash flows and includes an estimate of long-term future growth rates based on its most recent views of the long-term outlook for each respective reporting unit. Actual results may differ from those assumed in the Company’s forecasts. The Company derives its discount rates using a capital asset pricing model and analyzing published rates for industries relevant to its reporting units to estimate the cost of equity financing. The Company uses discount rates that are commensurate with the risks and uncertainty inherent in the respective businesses and in its internally developed forecasts.
Valuations using the market approach are derived from metrics of publicly traded companies or historically completed transactions of comparable businesses. The selection of comparable businesses is based on the markets in which the reporting units operate giving consideration to risk profiles, size, geography, and diversity of products and services. A market approach is limited to reporting units for which there are publicly traded companies that have the characteristics similar to the Company’s businesses.
90
Estimating the fair value of reporting units requires the use of estimates and significant judgments that are based on a number of factors including actual operating results. It is reasonably possible that the judgments and estimates described above could change in future periods.
A reporting unit is an operating segment, or a business unit one level below that operating segment for which discrete financial information is prepared and regularly reviewed by the Chief Operating Decision Maker (“CODM”). The Company has deemed RH Segment and Waterworks to be the reporting units for which goodwill is independently tested, as these operating segments are the lowest level for which discrete financial information is prepared and regularly reviewed by the CODM.
RH Segment Reporting Unit
During fiscal 2018, fiscal 2017 and fiscal 2016, the Company reviewed the RH Segment reporting unit goodwill for impairment by assessing qualitative factors to determine whether it was more likely than not that the fair value of the reporting unit was less than its carrying amount. Based on the qualitative tests performed in each fiscal year, the Company determined that it was not more likely than not that the fair value of the reporting unit was less than its carrying amount for fiscal 2018, fiscal 2017 and fiscal 2016, and therefore the Company did not recognize goodwill impairment with respect to the RH Segment in any such fiscal year.
Waterworks Reporting Unit
During the fourth fiscal quarters of 2018 and 2017, the Company conducted its annual strategic planning process. Based upon the outcome of this process in each fiscal year, management identified indicators that there could be an impairment of the Waterworks reporting unit. These indicators included (i) an updated long-range financial plan provided by the Waterworks segment management that indicated a reduction of revenues and EBITDA as compared to prior long-range financial plans, (ii) a review of the strategic initiatives of the Waterworks segment and (iii) the Waterworks segment not achieving revenue and operating income objectives compared to plans.
In determining the Waterworks reporting unit estimated fair value using the income approach in both fiscal 2018 and fiscal 2017, the Company projected future cash flows based on management’s estimates and long-term plans and applied a discount rate based on a weighted average cost of capital. This analysis required the Company to make judgments about revenues, expenses, fixed asset and working capital requirements, the impact of updated tax legislation and other subjective inputs. In determining the Waterworks reporting unit estimated fair value using the market approach, the Company considered assumptions that it believes market participants would use in valuing the Waterworks reporting unit, based on EBITDA multiples and including the application of a control premium. For purposes of this analysis, in both fiscal years, the Company weighted the results 80% towards the income approach and 20% towards the market approach.
Based on the estimated fair value of the Waterworks reporting unit as of the assessment date of each of its fiscal 2018 and fiscal 2017 analysis, the Company recorded a $17.4 million and $33.7 million non-cash impairment in the fourth quarter of fiscal 2018 and fiscal 2017, respectively, to reduce the carrying value of goodwill in the Waterworks reporting unit. The impairment is recorded in goodwill and tradename impairment on the consolidated statements of income and the Waterworks reporting unit goodwill was fully impaired as of February 2, 2019.
Tradenames, Trademarks and Domain Names
The Company annually evaluates whether tradenames, trademarks and domain names continue to have an indefinite life. Tradenames, trademarks and domain names are reviewed for impairment annually in the fourth quarter and may be reviewed more frequently if indicators of impairment are present. Conditions that may indicate impairment include, but are not limited to, a significant adverse change in customer demand or business climate that could affect the value of an asset, a product recall or an adverse action or assessment by a regulator.
The Company qualitatively assesses indefinite-lived intangible asset impairment to determine whether it is more likely than not that the fair value of the asset is less than its carrying amount. If tradenames, trademarks and domain names are not qualitatively assessed or if such intangible assets are qualitatively assessed and it is determined it is not more likely than not that the asset’s fair value is greater than its carrying amount, an impairment review is performed by comparing the carrying value to the estimated fair value, determined using a discounted cash flow methodology. Factors used in the valuation of intangible assets with indefinite lives include, but are not limited to, management’s plans for future operations, brand initiatives, recent results of operations and projected future cash flows.
91
During fiscal 2018, fiscal 2017 and fiscal 2016, the Company qualitatively assessed the RH Segment reporting unit indefinite-lived intangible asset for impairment and determine it was more likely than not that the fair value of the assets were greater than their carrying amounts. Based on the qualitative tests performed in each fiscal year, the Company did not perform quantitative impairment tests in any year. The Company did not recognize any impairment with respect to intangible assets for the RH Segment reporting unit in fiscal 2018, fiscal 2017, or fiscal 2016.
Waterworks Reporting Unit
In connection with the goodwill impairment test performed for the Waterworks reporting unit in fiscal 2017, described above, the Company performed an impairment test on the tradenames allocated to the reporting unit which utilized the discounted cash flow methodology under the relief-from-royalty method. Under the relief-from-royalty method, the Company’s significant assumptions include the forecasted future revenues and the estimated royalty rate, expressed as a percentage of revenues. Based on the quantitative impairment test performed, which resulted in fair value of the tradename in excess of book value by approximately 26%, the Company concluded that the tradename allocated to the Waterworks reporting unit was not impaired as of February 3, 2018 and did not recognize any impairment with respect to the tradename for the Waterworks reporting unit in fiscal 2017.
At the end of each of the first three fiscal quarters of 2018, the Company determined that there were no events or circumstances that indicated any impairment for the Waterworks reporting unit tradename. During the fourth fiscal quarter of 2018, management updated the fiscal 2019 budget and financial projections beyond fiscal 2019 for the Waterworks reporting unit. There were certain factors that caused the key financial inputs for the tradename valuation model to significantly decrease from the previous inputs, the most significant of which was a reduction of future forecasted net revenues resulting from an expected shift in product mix, challenges in continuing to grow the showrooms business and supply chain constraints.
These factors arising during the fourth fiscal quarter of 2018 had a significant and negative impact on the estimated future cash flows of the Waterworks reporting unit. In connection with the goodwill impairment test performed for the Waterworks reporting unit in fiscal 2018, described above, the Company performed an impairment test on the tradename allocated to the reporting unit which utilized the discounted cash flow methodology under the relief-from-royalty method. Under the relief-from-royalty method, the Company’s significant assumptions include the forecasted future revenues and the estimated royalty rate, expressed as a percentage of revenues. Based on the quantitative impairment test performed and the result of changes in forecasted revenues and the valuation assumption around future royalty rates, the Company concluded that the Waterworks reporting unit tradename was impaired as of February 2, 2019. As a result, the Company recognized a $14.6 million non-cash impairment with respect to the tradename for the Waterworks reporting unit in fiscal 2018, which was recorded in goodwill and tradename impairment on the consolidated statements of income. The remaining tradename balance of the Waterworks reporting unit was $37.5 million as of February 2, 2019.
Long-Lived Assets
Long-lived assets, such as property and equipment and intangible assets subject to amortization, are reviewed for impairment whenever events or changes in circumstances indicate that the carrying amount of an asset may not be recoverable. Conditions that may indicate impairment include, but are not limited to, a significant adverse change in customer demand or business climate that could affect the value of an asset, a product recall or an adverse action or assessment by a regulator. If the sum of the estimated undiscounted future cash flows related to the asset is less than the carrying value, the Company recognizes a loss equal to the difference between the carrying value and the fair value, usually determined by the estimated discounted cash flow analysis of the assets.
Since there is typically no active market for the Company’s long-lived tangible assets, the Company estimates fair values based on the expected future cash flows of the asset or asset group, using a discount rate commensurate with the related risk. The asset group is defined as the lowest level for which identifiable cash flows are available and largely independent of the cash flows of other groups of assets, which for the stores is the individual gallery level. The Company estimates future cash flows based on gallery-level historical results, current trends, and operating and cash flow projections. The Company’s estimates are subject to uncertainty and may be affected by a number of factors outside its control, including general economic conditions and the competitive environment. While the Company believes its estimates and judgments about future cash flows are reasonable, future impairment charges may be required if the expected cash flow estimates, as projected, do not occur or if events change requiring the Company to revise its estimates.
The Company did not record impairment for long-lived tangible assets at the individual gallery level in fiscal 2018, fiscal 2017 or fiscal 2016. Due to certain distribution center closures and business line integrations in fiscal 2018, fiscal 2017 and fiscal 2016, the Company recorded impairment for certain corporate assets and other long-lived assets in fiscal 2018, fiscal 2017 and fiscal 2016, as discussed below under “Distribution Center Closures,” “Asset Held for Sale” and “RH Contemporary Art Impairment.” No additional impairment has been recorded for corporate assets and other long-lived assets in fiscal 2018, fiscal 2017 and fiscal 2016.
92
During the third quarter of fiscal 2018, the Company initiated and executed a plan to close its distribution center located in Essex, MD. As a result of the distribution center closure, the Company incurred restructuring related costs in the RH Segment in fiscal 2018, including a lease loss liability of $2.2 million, loss on disposal of capitalized property and equipment of $0.2 million, as well as costs for employee termination benefits of $0.2 million. The impact to selling, general and administrative expenses on the consolidated statements of income was $2.6 million, which represents the total charges expected to be incurred with this distribution center closure.
During the third quarter of fiscal 2017, the Company initiated a plan to close two of its distribution centers, one located in Mira Loma, CA and one located in Dallas, TX. The Mira Loma distribution center closure was finalized in November 2017 and the Dallas distribution center closure was finalized in January 2018, both of which occurred in the fourth quarter of fiscal 2017. As a result of the distribution center closures, the Company incurred restructuring related costs in the RH Segment in fiscal 2017, including loss on disposal of capitalized property and equipment and lease loss liability of $2.1 million, as well as costs for employee termination benefits of $0.9 million. The total expense of $3.0 million was included in selling, general and administrative expenses on the consolidated statements of income.
During the first quarter of fiscal 2018, the Company decreased the lease loss liability associated with the Dallas distribution center closure by $1.2 million primarily due to the remeasurement of the lease loss liability resulting from a sublease agreement entered into by the Company in April 2018 that resulted in an update to both the timing and the terms of future lease-related cash inflows. The Company does not expect to incur additional charges in the future associated with this distribution center closures.
As of February 2, 2019 and February 3, 2018, the Company’s lease loss liability associated with all distribution center closures, which is estimated as the net present value of the difference between lease payments and receipts under sublease agreements, was $2.2 million and $2.6 million, respectively, and is included in other non-current obligations on the consolidated balance sheets.
The distribution center lease loss liability activity in fiscal 2018 and fiscal 2017 was as follows (in thousands):
|
|
|
Year Ended |
|
|||||
|
|
|
February 2, |
|
|
February 3, |
|
||
|
|
|
2019 |
|
|
2018 |
|
||
|
Balance at beginning of fiscal year |
|
$ |
2,585 |
|
|
$ |
— |
|
|
Lease loss liability additions |
|
|
1,927 |
|
|
|
2,447 |
|
|
Lease loss liability remeasurements |
|
|
(1,232 |
) |
|
|
— |
|
|
Payments made under lease agreements |
|
|
(6,041 |
) |
|
|
(583 |
) |
|
Payments received under sublease agreements |
|
|
4,904 |
|
|
|
716 |
|
|
Interest |
|
|
34 |
|
|
|
5 |
|
|
Balance at end of fiscal year |
|
$ |
2,177 |
|
|
$ |
2,585 |
|
Asset Held for Sale
An asset is considered to be held for sale when all of the following criteria are met:
|
|
• |
Management commits to a plan to sell the property; |
|
|
• |
It is unlikely that the disposal plan will be significantly modified or discontinued; |
|
|
• |
The property is available for immediate sale in its present condition; |
|
|
• |
Actions required to complete the sale of the property have been initiated; |
|
|
• |
Sale of the asset is probable and the completed sale is expected to occur within one year; and |
|
|
• |
The property is actively being marketed for sale at a price that is reasonable given its current market value. |
Upon designation as an asset held for sale, the carrying value of the asset is recorded at the lower of its carrying value or its estimated fair value less estimated costs to sell, and the Company ceases depreciating the asset.
During the fourth quarter of fiscal 2016, the Company committed to a plan to sell an aircraft, which resulted in a reclassification of such aircraft from property and equipment to asset held for sale on the consolidated balance sheets. The Company performed an assessment and determined that based on management’s best estimate of the selling price of the aircraft as of January 28, 2017, it had an impairment of $4.8 million in fiscal 2016 in the RH Segment. Such impairment charge is included in selling, general and administrative expenses on the consolidated statements of income. In April 2017, the sale of the aircraft was completed for a purchase price of $5.2 million and the Company incurred additional costs of $0.3 million to dispose of the asset.
93
RH Contemporary Art Impairment
During the fourth quarter of fiscal 2016, the Company initiated and executed a plan to integrate the RH Contemporary Art (“RHCA”) product line into the broader RH platform and no longer operates RHCA as a separate division. As a result, the Company incurred restructuring related costs in the RH Segment, including loss on disposal of capitalized property and equipment of $5.5 million, lease loss liability of $3.2 million, inventory impairment of $2.7 million and other associated costs of $0.3 million. The Company did not incur any costs for employee termination benefits associated with the integration. The impact to cost of goods sold and selling, general and administrative expenses on the consolidated statements of income in fiscal 2016 was $1.1 million and $10.6 million, respectively.
During the third quarter of fiscal 2018 and the fourth quarter of fiscal 2017, the Company recorded expense of $3.4 million and $4.4 million, respectively, in the RH Segment related to the remeasurement of the lease loss liability for RHCA resulting from an update to both the timing and the amount of future estimated lease related cash inflows based on present market conditions, which is included in selling, general and administrative expenses on the consolidated statements of income.
As of February 2, 2019 and February 3, 2018, the Company’s lease loss liability associated with the RHCA impairment, which is estimated as the net present value of the difference between lease payments and receipts under sublease agreements, was $9.8 million and $7.1 million, respectively, and is included in other non-current obligations on the consolidated balance sheets.
The RHCA lease loss liability activity in fiscal 2018 and fiscal 2017 was as follows (in thousands):
|
|
|
Year Ended |
|
|||||
|
|
|
February 2, |
|
|
February 3, |
|
||
|
|
|
2019 |
|
|
2018 |
|
||
|
Balance at beginning of fiscal year |
|
$ |
7,100 |
|
|
$ |
3,188 |
|
|
Lease loss liability remeasurement |
|
|
3,411 |
|
|
|
4,417 |
|
|
Payments made under lease agreement |
|
|
(2,249 |
) |
|
|
(1,699 |
) |
|
Payments received under sublease agreement |
|
|
1,138 |
|
|
|
1,003 |
|
|
Interest |
|
|
415 |
|
|
|
191 |
|
|
Balance at end of fiscal year |
|
$ |
9,815 |
|
|
$ |
7,100 |
|
Lease Accounting
The Company leases stores, distribution facilities, office space and, less significantly, certain machinery and equipment. The Company classifies leases at the inception of the lease as a capital lease or an operating lease.
Build-to-Suit Lease Transactions
The Company is sometimes involved in the construction of leased stores, which, depending on the extent to which it is involved, the Company may be the “deemed owner” of the leased premises for accounting purposes during the construction period pursuant to ASC 840—Leases. If the Company is the “deemed owner” for accounting purposes, upon commencement of the construction project, it is required to capitalize the cash and non-cash assets contributed by the landlord for construction as property and equipment on its consolidated balance sheets. The contributions by the landlord toward construction, including the building, existing site improvements at construction commencement and any amounts paid by the landlord to those responsible for construction, are included as property and equipment additions due to build-to-suit lease transactions within the non-cash section of the consolidated statements of cash flows. Over the lease term, these non-cash additions to property and equipment due to build-to-suit lease transactions do not impact the Company’s cash outflows, nor do they impact net income within the consolidated statements of income.
Upon completion of the construction project, the Company performs a sale-leaseback analysis to determine if it does not have any forms of “continuing involvement” and therefore can remove the assets and related liabilities from its consolidated balance sheets. If the assets and related liabilities cannot be removed from the Company’s consolidated balance sheets, the Company accounts for the transactions as a financing lease. These lease transactions are referred to as build-to-suit lease transactions.
Rent expense relating to the land is recognized on a straight-line basis once construction begins, which is determined using the fair value of the leased land at construction commencement and the Company’s incremental borrowing rate. Once cash payments commence under the lease, all amounts in excess of land rent expense are recorded as a debt-service payment and are recognized as interest expense and a reduction of the financing obligation.
Similar to capital leases, the expense recorded within the consolidated statements of income over the lease term is equal to the cash rent payments made under the lease. The primary difference in the consolidated statements of income between build-to-suit lease
94
transactions and operating leases is the timing of recognition and the classification of expenses. Expenses related to operating leases are classified as rent expense compared to expenses related to build-to-suit lease transactions which are classified as a combination of rent expense, depreciation expense and interest expense.
Operating and Capital Leases
In a capital or an operating lease, the expected lease term begins with the date that the Company takes possession of the equipment or the leased space for construction and other purposes. The expected lease term may also include the exercise of renewal options if the exercise of the option is determined to be reasonably assured. The expected term is also used in the determination of whether a store is a capital or operating lease.
Certain of the Company’s property and equipment are held under capital leases. These assets are included in property and equipment and depreciated over the lesser of the useful life of the asset or the lease term. For buildings held under capital leases, unless the fair value of the land at lease inception exceeds 25% of the aggregate fair value of the leased land and buildings, rent payments under the leases are recognized using the effective interest method as a reduction of the capital lease obligation and interest expense. Pursuant to ASC 840, at lease inception, if the fair value of the underlying land exceeds 25% of the fair value of the real estate (land and buildings), the Company allocates a portion of the cash payments under the lease to land rent expense equal to the product of the fair value of the leased land at construction commencement and the Company’s incremental borrowing rate. The remaining cash payment is treated as debt-service payments and recognized as interest expense and a reduction of the capital lease obligation.
All other leases are considered operating leases in accordance with ASC 840. Assets subject to an operating lease and the related lease payments are not recorded on the consolidated balance sheets. For leases that contain lease incentives, premiums and minimum rent expenses, the Company recognizes rent expense on a straight-line basis over the lease term. Tenant improvement allowances received from landlords under operating leases are recorded in deferred rent and lease incentives on the consolidated balance sheets, and are amortized on a straight-line basis over the lease term.
Debt Issuance Costs
Debt issuance costs related to debt, excluding the asset based credit facility, are recorded as a contra-liability and are presented net against the respective debt balance on the consolidated balance sheets. Debt issuance costs are amortized utilizing the effective interest method over the expected life of the respective debt. Such amortization is included in interest expense–net on the consolidated statements of income.
Deferred financing fees related to the asset based credit facility are included in non-current assets on the consolidated balance sheets. Deferred financing fees related to the asset based credit facility are amortized utilizing the straight-line method. Such amortization is included in interest expense–net on the consolidated statements of income.
Revenue Recognition
The Company recognizes revenues and the related cost of goods sold when a customer obtains control of the merchandise, which is when the customer has the ability to direct the use of and obtain the benefits from the merchandise. Revenue recognized for merchandise delivered via the home-delivery channel is recognized upon delivery. Revenues recognized for merchandise delivered via all other delivery channels are recognized upon shipment. Revenues from “cash-and-carry” store sales are recognized at the point of sale in the store. Discounts or other accommodations provided to customers are accounted for as a reduction of sales.
The Company recognizes shipping and handling fees as activities to fulfill the promise to transfer the merchandise to customers. The Company applies this policy consistently across all of its distribution channels. In instances where revenue is recognized for the related merchandise upon delivery to customers, the related costs of shipping and handling activities are accrued for in the same period. In instances where revenue is recognized for the related merchandise prior to delivery to customers (i.e., revenue recognized upon shipment), the related costs of shipping and handling activities are accrued for in the same period. Costs of shipping and handling are included in cost of goods sold.
Sales tax collected is not recognized as revenue but is included in accounts payable and accrued expenses on the consolidated balance sheets as it is ultimately remitted to governmental authorities.
The Company reserves for projected merchandise returns. Merchandise returns are often resalable merchandise and are refunded by issuing the same payment tender of the original purchase. Merchandise exchanges of the same product and price are not considered merchandise returns and, therefore, are excluded when calculating the sales returns reserve.
95
The Company’s customers may return purchased items for a refund. The Company provides an allowance for sales returns based on historical return rates, which is presented on a gross basis. The allowance for sales returns is presented within other current liabilities and the estimated value of the right of return asset for merchandise is presented within prepaid expense and other assets on the consolidated balance sheets.
A summary of the allowance for sales returns is as follows (in thousands):
|
|
|
Year Ended |
|
|||||||||
|
|
|
February 2, |
|
|
February 3, |
|
|
January 28, |
|
|||
|
|
|
2019 |
|
|
2018 |
|
|
2017 |
|
|||
|
Balance at beginning of fiscal year |
|
$ |
10,565 |
|
|
$ |
10,077 |
|
|
$ |
12,688 |
|
|
Waterworks acquisition—beginning balance |
|
|
— |
|
|
|
— |
|
|
|
523 |
|
|
Impact of Topic 606 adoption |
|
|
5,862 |
|
|
|
— |
|
|
|
— |
|
|
Provision for sales returns |
|
|
112,218 |
|
|
|
108,134 |
|
|
|
106,508 |
|
|
Actual sales returns |
|
|
(108,824 |
) |
|
|
(107,646 |
) |
|
|
(109,642 |
) |
|
Balance at end of fiscal year |
|
$ |
19,821 |
|
|
$ |
10,565 |
|
|
$ |
10,077 |
|
Refer to “Revenue from Contracts with Customers” below for the impact of Topic 606 on the Company, which was effective in the first quarter of fiscal 2018.
Deferred Revenue and Customer Deposits
The Company defers revenue associated with merchandise delivered via the home-delivery channel. In instances where the Company recognizes revenue when the merchandise is delivered to customers, it is included as deferred revenue on the consolidated balance sheets while in-transit. Deferred revenue also includes the unrecognized portion of the annual RH Members Program fee. New membership fees are recorded as deferred revenue when collected from customers and recognized as revenue based on expected product revenues over the annual membership period, based on historical trends of sales to members. Membership renewal fees are recorded as deferred revenue when collected from customers and are recognized as revenue on a straight-line basis over the membership period, or one year.
Customer deposits represent payments made by customers on custom orders. At the time of purchase the Company collects deposits for all custom orders equivalent to 50% of the customer purchase price. Custom order deposits are recognized as revenue when the customer obtains control of the merchandise.
Refer to “Revenue from Contracts with Customers” below for the impact of Topic 606 on the Company, which was effective in the first quarter of fiscal 2018.
Gift Cards and Merchandise Credits
The Company sells gift cards and issues merchandise credits to its customers in its stores and through its websites and product catalogs. Such gift cards and merchandise credits do not have expiration dates. The Company recognizes breakage associated with gift cards and merchandise credits proportional to actual gift card redemptions. Breakage of $1.5 million was recorded in net revenues in fiscal 2018. Breakage resulted in a reduction of selling, general and administrative expenses on the consolidated statements of income of $3.0 million in both fiscal 2017 and fiscal 2016. Refer to “Revenue from Contracts with Customers” below for the impact of Topic 606 on the Company, which was effective in the first quarter of fiscal 2018.
Self Insurance
The Company maintains insurance coverage for significant exposures, as well as those risks that, by law, must be insured. In the case of the Company’s health care coverage for employees, the Company has a managed self insurance program related to claims filed. Expenses related to this self insured program are computed on an actuarial basis, based on claims experience, regulatory requirements, an estimate of claims incurred but not yet reported (“IBNR”) and other relevant factors. The projections involved in this process are subject to uncertainty related to the timing and amount of claims filed, levels of IBNR, fluctuations in health care costs and changes to regulatory requirements. The Company had liabilities of $2.0 million and $2.7 million related to health care coverage as of February 2, 2019 and February 3, 2018, respectively.
96
The Company carries workers’ compensation insurance subject to a deductible amount for which the Company is responsible on each claim. The Company had liabilities of $3.3 million related to workers’ compensation claims, primarily for claims that do not meet the per-incident deductible, as of both February 2, 2019 and February 3, 2018.
Stock-Based Compensation
The Company recognizes the fair value of stock-based compensation in the consolidated financial statements as compensation expense over the requisite service period. For service-only awards, compensation expense is recognized on a straight-line basis, net of forfeitures, over the requisite service period for the fair value of awards that actually vest. Fair value for restricted stock units is valued using the closing price of the Company’s stock on the date of grant. The fair value of each option award granted under the Company’s award plan is estimated on the date of grant using a Black-Scholes Merton option pricing model (“OPM”) which requires the input of subjective assumptions regarding the expected term, expected volatility, dividend yield and risk-free interest rate. The Company elected to calculate the expected term of the option awards using the “simplified method.” This election was made based on the lack of sufficient historical exercise data to provide a reasonable basis upon which to estimate expected term. Under the “simplified” calculation method, the expected term is calculated as an average of the vesting period and the contractual life of the options.
Cost of Goods Sold
Cost of goods sold includes, but is not limited to, the direct cost of purchased merchandise, inventory shrinkage, inventory reserves and write-downs, inbound freight, all freight costs to get merchandise to the Company’s stores, design and buying costs, occupancy costs related to store operations and supply chain, such as rent, property tax and common area maintenance, depreciation and amortization, and all logistics costs associated with shipping product to customers.
Selling, General and Administrative Expenses
Selling, general and administrative expenses include all operating costs not included in cost of goods sold. These expenses include payroll and payroll related expenses, store expenses other than occupancy, and expenses related to many of the Company’s operations at its corporate headquarters, including utilities, depreciation and amortization, credit card fees and marketing expense, which primarily includes catalog production, mailing and print advertising costs. All store pre-opening costs are included in selling, general and administrative expenses and are expensed as incurred.
Net Income Per Share
Basic net income per share is computed as net income divided by the weighted-average number of common shares outstanding for the period. Diluted net income per share is computed as net income divided by the weighted-average number of common shares outstanding for the period, common share equivalents under equity plans using the treasury-stock method and the calculated common share equivalents in excess of the respective conversion rates related to each of the convertible senior notes. Potential dilutive securities are excluded from the computation of diluted net income per share if their effect is anti-dilutive.
Treasury Stock
The Company records its purchases of treasury stock at cost as a separate component of stockholders’ equity (deficit). Upon retirement of treasury stock, the Company allocates the excess of the purchase price over par value to additional paid-in capital subject to certain limitations with any remaining purchase price allocated to retained earnings.
Income Taxes
The Company accounts for income taxes under an asset and liability approach that requires the recognition of deferred tax assets and liabilities for the expected future tax consequences of events that have been recognized in the Company’s consolidated financial statements or tax returns. In estimating future tax consequences, the Company generally takes into account all expected future events then known to it, other than changes in the tax law or rates which have not yet been enacted and which are not permitted to be considered. Accordingly, the Company may record a valuation allowance to reduce its net deferred tax assets to the amount that is more-likely-than-not to be realized. The determination as to whether a deferred tax asset will be realized is made on a jurisdictional basis and is based upon management’s best estimate of the recoverability of the Company’s net deferred tax assets. Future taxable income and ongoing prudent and feasible tax planning are considered in determining the amount of the valuation allowance, and the amount of the allowance is subject to adjustment in the future. Specifically, in the event the Company were to determine that it is not more-likely-than-not able to realize its net deferred tax assets in the future, an adjustment to the valuation allowance would decrease income in the period such determination is made. This allowance does not alter the Company’s ability to utilize the underlying tax net operating loss and credit carryforwards in the future, the utilization of which is limited to achieving future taxable income.
97
The accounting standard for uncertainty in income taxes prescribes a recognition threshold that a tax position is required to meet before being recognized in the financial statements and provides guidance on derecognition, measurement, classification, interest and penalties, accounting in interim periods, disclosure and transition issues. Differences between tax positions taken in a tax return and amounts recognized in the financial statements generally result in an increase in liability for income taxes payable or a reduction of an income tax refund receivable, or a reduction in a deferred tax asset or an increase in a deferred tax liability, or both. The Company recognizes interest and penalties related to unrecognized tax benefits in tax expense.
The United States enacted the Tax Cuts and Jobs Act (the “Tax Act”) on December 22, 2017, which had a significant impact to the Company’s provision for income taxes as of February 2, 2019. The Tax Act includes a number of changes to existing U.S. tax laws that impact us, including the reduction of the U.S. corporate income tax rate from 35% to 21% effective January 1, 2018. The Tax Act also provides for a one-time transition tax on accumulated foreign earnings and the acceleration of depreciation for certain assets, as well as prospective changes beginning in 2018, including limitations on the deductibility of executive compensation and interest, the elimination of certain domestic deductions and credits, the elimination of the Alternative Minimum Tax regime, and modifications to the deductibility and carryforward period of net operating losses. The Tax Act transitions U.S. international taxation from a worldwide system to a modified territorial system and includes base erosion prevention measures on non-U.S. earnings, which may have the effect of subjecting certain earnings of the Company’s foreign subsidiaries to U.S. taxation. The Company’s provision for income taxes in fiscal 2017 included $7.0 million of income tax expense as a result of the Tax Act, including $6.0 million for the provisional re-measurement of the deferred tax assets for the reduction in the U.S. corporate income tax rate from 35% to 21% and a $1.0 million charge for the provisional estimate of the transition tax.
The Tax Act requires complex computations to be performed that were not previously required under U.S. tax law, significant judgments to be made in interpretation of the provisions of the Tax Act and significant estimates in calculations, and the preparation and analysis of information not previously relevant or regularly produced. The U.S. Treasury Department, the Internal Revenue Service, and other standard-setting bodies could interpret or issue guidance on how provisions of the Tax Act will be applied or otherwise administered that is different from the Company’s interpretation. The Company has completed its analysis of the Tax Act, and has not made material adjustments to the provisional amounts that the Company previously recorded.
Comprehensive Income
Comprehensive income is comprised of net income and other gains and losses affecting equity that are excluded from net income. The components of other comprehensive income consist of net gains (losses) on foreign currency translation and net unrealized holding gains (losses) on available-for-sale investments, both of which are presented net of tax.
Foreign Currency Translation
Local currencies are generally considered the functional currencies outside the United States. Assets and liabilities denominated in non-U.S. currencies are translated at the rate of exchange prevailing on the date of the consolidated balance sheets and revenues and expenses are translated at average rates of exchange for the period. The related translation gains (losses) are reflected in the accumulated other comprehensive income section of the consolidated statements of stockholders’ equity (deficit). Foreign currency gains (losses) resulting from foreign currency transactions are included in selling, general and administrative expenses on the consolidated statements of income and are not material for all periods presented.
Recently Issued Accounting Standards
Revenue from Contracts with Customers
In May 2014, the Financial Accounting Standards Board (“FASB”) and International Accounting Standards Board issued their converged accounting standards update on revenue recognition, Accounting Standards Update 2014-09—Revenue from Contracts with Customers (Topic 606). This guidance outlines a single comprehensive model for companies to use in accounting for revenue arising from contracts with customers and supersedes most current revenue recognition guidance, including industry-specific guidance. The core principle of the revenue model is that revenue is recognized when a customer obtains control of a good or service. A customer obtains control when it has the ability to direct the use of and obtain the benefits from the good or service. Under the new guidance, transfer of control is no longer the same as transfer of risks and rewards as indicated in the prior guidance.
Adoption and Accounting Policy
The Company adopted Topic 606, on February 4, 2018, using the modified retrospective transition method and recorded a decrease to opening retained earnings of $21.0 million, inclusive of the tax impact. Results reported within the Company’s condensed consolidated financial statements for reporting periods beginning February 4, 2018 are presented under Topic 606 while prior periods
98
are not adjusted and continue to be reported in accordance with the Company’s historic accounting under ASC 605—Revenue Recognition (Topic 605).
Under Topic 606, changes were made to the recognition timing or classification of revenues and expenses for the following:
|
Description |
Policy under Topic 605 |
Policy under Topic 606 |
|
Advertising expenses |
Costs associated with Source Books were capitalized and amortized over their expected period of future benefit. Expense was amortized based upon the ratio of actual revenues to the total of actual and estimated future revenues on an individual Source Book basis, generally over a twelve-month period after they were mailed. |
Costs associated with Source Books are expensed upon the delivery of the Source Books to the carrier. In the case of multiple printings of a Source Book, the creative costs will be expensed in full upon the initial delivery of Source Books to the carrier. |
|
Gift card breakage |
Recognized gift card breakage (amounts not expected to be redeemed) within selling, general and administrative expenses. |
Recognize gift card breakage within net revenues proportional to actual gift card redemptions. |
|
Membership revenue |
Annual fees for new memberships in the RH Members Program and renewals were recorded as deferred revenue when collected from customers and recognized as revenue on a straight-line basis over the twelve month membership period. |
Annual fees for new memberships in the RH Members Program are recorded as deferred revenue when collected from customers and recognized as revenue based on expected product revenues over the annual membership period, using historical trends of sales to members.
RH Members Program renewal fees are recorded as deferred revenue when collected from customers and will continue to be recognized as revenue on a straight-line basis over the twelve month membership period. |
|
Revenue recognition |
Revenue for merchandise that is not delivered via the home-delivery channel was recognized upon delivery. |
Revenue for merchandise that is not delivered via the home-delivery channel will be recognized upon shipment. |
|
Allowance for sales returns |
Recognized an allowance for sales returns as a net liability within other current liabilities. |
Recognize an allowance for sales returns on a gross basis as a liability within other current liabilities and a right of return asset for merchandise within prepaid expense and other current assets. |
Advertising expenses—The adoption of Topic 606 materially impacts the timing of recognizing advertising expense related to direct response advertising, including costs associated with the Company’s Source Books. Under Topic 606, the Company will recognize expense associated with the Source Books upon the delivery of the Source Books to the carrier. In the case of multiple printings of a Source Book, the creative costs will be expensed in full upon the initial delivery of Source Books to the carrier. Prior to adoption of Topic 606, costs associated with Source Books were capitalized and amortized over their expected period of future benefit. Such amortization was based upon the ratio of actual revenues to the total of actual and estimated future revenues on an individual Source Book basis. Each Source Book was generally fully amortized within a twelve-month period after they were mailed and the majority of the amortization occurred within the first five to nine months, with the exception of the Holiday Source Books, which were generally fully amortized within a three-month period after they were mailed. Upon adoption of Topic 606, capitalized costs associated with Source Books of $37.8 million that had been delivered to the carrier prior to or on February 3, 2018 were reclassified to retained earnings on the consolidated balance sheets, resulting in a decrease to the opening retained earnings balance.
Gift card breakage—Under Topic 606, the Company recognizes gift card breakage proportional to actual gift card redemptions and such breakage is recorded within net revenues on the condensed consolidated statements of income. Gift card breakage was previously recorded as a reduction to selling, general and administrative expenses when the likelihood of redemption was remote. Upon adoption of Topic 606, gift card liabilities of $6.0 million were reclassified to retained earnings on the consolidated balance sheets, resulting in an increase to the opening retained earnings balance.
Membership revenue—Under Topic 606, the annual fee for new memberships in the RH Members Program is recorded as deferred revenue when collected from customers and recognized as revenue based on expected product revenues over the annual membership period, using historical trends of sales to members. Prior to the adoption of Topic 606, new memberships were recorded as deferred revenue when collected from customers and recognized as revenue on a straight-line basis over the twelve month membership period. This will result in a majority of revenue being recognized during the first six months of the membership period. The adoption of Topic 606 will not have an impact on membership renewal fees, which will continue to be recognized as revenue on a straight-line basis over the twelve month membership period, until the Company has more information regarding membership renewal
99
purchasing trends. Upon adoption of Topic 606, deferred membership revenue of $3.8 million was reclassified to retained earnings on the consolidated balance sheets, resulting in an increase to the opening retained earnings balance.
Revenue recognition—Under Topic 606, the Company will continue to recognize revenue for merchandise delivered via the home-delivery channel upon delivery. Under Topic 606, revenue for merchandise delivered via all other delivery channels will be recognized upon shipment, whereas previously such revenue was recognized upon delivery. Upon adoption of Topic 606, deferred revenue (net of cost of goods sold) of $1.3 million was reclassified to retained earnings on the consolidated balance sheets, resulting in an increase to the opening retained earnings balance.
The Company adopted the practical expedient related to shipping and handling activities. Under this option, in instances where revenue is recognized for the related merchandise prior to delivery to customers (i.e., revenue recognized upon shipment), the related costs of shipping and handling activities will be accrued for in the same period. Costs of shipping and handling continue to be included in cost of goods sold.
Allowance for sales returns—In connection with adoption of Topic 606, the Company is required to recognize its allowance for sales returns on a gross basis rather than as a net liability. Upon adoption, this resulted in an increase to prepaid and other current assets (“right of return asset for merchandise”), with a corresponding increase to other current liabilities on the consolidated balance sheets, and did not impact the consolidated statements of income. As of February 2, 2019, the right of return asset for merchandise was $5.9 million.
Sales tax collection from customers—Under Topic 606, the Company has not changed its policy regarding sales tax collected from customers. Sales tax collected is not recognized as revenue but is included in accounts payable and accrued expenses on the consolidated balance sheets as it is ultimately remitted to governmental authorities.
In connection with adoption of Topic 606, the Company recorded a $6.6 million tax adjustment associated with the charges listed above to retained earnings on the consolidated balance sheets, resulting in an increase to the opening retained earnings balance.
Contract Liabilities
The Company defers revenue associated with merchandise delivered via the home-delivery channel. As the Company recognizes revenue when the merchandise is delivered to its customers, it is included as deferred revenue on the consolidated balance sheets while in-transit. Customer deposits represent payments made by customers on custom orders. At the time of order placement the Company collects deposits for all custom orders equivalent to 50% of the purchase price. Custom order deposits are recognized as revenue when a customer obtains control of the merchandise. In addition, the Company collects annual membership fees related to the RH Members Program. New membership fees are recorded as deferred revenue when collected from customers and recognized as revenue based on expected product revenues over the annual membership period, using historical trends of sales to members. Membership renewal fees are recorded as deferred revenue when collected from customers and are recognized as revenue on a straight-line basis over the membership period, or one year. The Company expects that substantially all of the deferred revenue, customer deposits and deferred membership fees as of February 2, 2019 will be recognized within the next six months as the performance obligations are satisfied.
In addition, the Company defers revenue when cash payments are received in advance of performance for unsatisfied obligations related to its gift cards and merchandise credits. Customer liabilities related to gift cards and merchandise credits was $17.2 million and $24.1 million as of February 2, 2019 and February 3, 2018, respectively. As discussed above, $6.0 million of the decrease was due to the reclassification of gift card liabilities to retained earnings upon adoption of Topic 606. During fiscal 2018, the Company recognized $21.6 million of revenue related to previous deferrals related to its gift cards and merchandise credits and recorded gift card breakage of $1.5 million. The Company expects that approximately 70% of the remaining gift card and merchandise credit liabilities will be recognized when the gift cards are redeemed by customers.
Disaggregated Revenue
The Company recognizes revenue from its stores and direct sales channels. Stores net revenues represent sales originating in retail stores, including Waterworks showrooms, and outlet stores. Direct net revenues include sales originating from the Company’s Source Books, websites, and phone orders, including its Contract business and a portion of its Trade business. During fiscal 2018, net revenues recognized from the stores and direct sales channels were $1,412.1 million and $1,093.5 million, respectively.
100
Adoption Impact on Fiscal 2018 Results
The following tables summarize the impact of adopting Topic 606 on the Company’s consolidated statement of income (in thousands):
|
|
|
Year Ended February 2, 2019 |
|
|||||||||
|
|
|
As Reported |
|
|
Adjustments |
|
|
Balances without Adoption of Topic 606 |
|
|||
|
Net revenues |
|
$ |
2,505,653 |
|
|
$ |
(9,868 |
) |
|
$ |
2,495,785 |
|
|
Cost of goods sold |
|
|
1,504,806 |
|
|
|
(3,485 |
) |
|
|
1,501,321 |
|
|
Gross profit |
|
|
1,000,847 |
|
|
|
(6,383 |
) |
|
|
994,464 |
|
|
Selling, general and administrative expenses |
|
|
711,617 |
|
|
|
(2,616 |
) |
|
|
709,001 |
|
|
Income from operations |
|
|
289,230 |
|
|
|
(3,767 |
) |
|
|
285,463 |
|
|
Other expenses |
|
|
|
|
|
|
|
|
|
|
|
|
|
Interest expense—net |
|
|
75,074 |
|
|
|
— |
|
|
|
75,074 |
|
|
Goodwill and tradename impairment |
|
|
32,086 |
|
|
|
— |
|
|
|
32,086 |
|
|
Loss on extinguishment of debt |
|
|
917 |
|
|
|
— |
|
|
|
917 |
|
|
Total other expenses |
|
|
108,077 |
|
|
|
— |
|
|
|
108,077 |
|
|
Income before income taxes |
|
|
181,153 |
|
|
|
(3,767 |
) |
|
|
177,386 |
|
|
Income tax expense |
|
|
30,514 |
|
|
|
(3,945 |
) |
|
|
26,569 |
|
|
Net income |
|
$ |
150,639 |
|
|
$ |
178 |
|
|
$ |
150,817 |
|
The following table summarizes the impact of adopting Topic 606 on certain line items of the Company’s consolidated balance sheet (in thousands):
|
|
|
As of February 2, 2019 |
|
|||||||||
|
|
|
As Reported |
|
|
Adjustments |
|
|
Balances without Adoption of Topic 606 |
|
|||
|
Prepaid expense and other current assets |
|
$ |
104,719 |
|
|
$ |
33,587 |
|
|
$ |
138,306 |
|
|
Deferred tax assets |
|
|
30,033 |
|
|
|
(6,561 |
) |
|
|
23,472 |
|
|
Accounts payable and accrued expenses |
|
|
320,441 |
|
|
|
(686 |
) |
|
|
319,755 |
|
|
Deferred revenue and customer deposits |
|
|
152,595 |
|
|
|
9,304 |
|
|
|
161,899 |
|
|
Other current liabilities |
|
|
101,347 |
|
|
|
(2,806 |
) |
|
|
98,541 |
|
|
Accumulated deficit |
|
|
(376,810 |
) |
|
|
21,214 |
|
|
|
(355,596 |
) |
101
In February 2016, the FASB issued Accounting Standards Update 2016-02—Leases, which requires a lessee to recognize a right-of-use asset and a lease liability, initially measured at the present value of the lease payments, in its balance sheet. The standard also requires a lessee to recognize a single lease cost for operating leases, calculated so that the cost of the lease is allocated over the lease term, generally on a straight-line basis. In July 2018, the FASB issued Accounting Standards Update 2018-10—Codification Improvements to Topic 842 (Leases), and Accounting Standards Update 2018-11—Leases (Topic 842)—Targeted Improvements, which (i) narrows amendments to clarify how to apply certain aspects of the new lease standard, (ii) provides entities with an additional transition method to adopt the new standard, and (iii) provides lessors with a practical expedient for separating components of a contract. Accounting Standards Update 2016-02, Accounting Standards Update 2018-10 and Accounting Standards Update 2018-11 are collectively referred to the “ASUs.”
The ASUs are effective for public companies for fiscal years beginning after December 15, 2018, including interim periods within those fiscal years. The Company adopted the ASUs, in the first quarter of fiscal 2019, using a retrospective approach and will apply the new accounting standard to each prior reporting period presented. The Company continues to evaluate the effects that the adoption of this guidance will have on its consolidated financial statements and anticipates the new guidance will significantly impact its consolidated financial statements given that the Company has a significant number of leases. Additionally, the Company anticipates that the new guidance will impact its internal controls over financial reporting, including new processes and internal controls that may be required to comply with the new lease accounting and disclosure requirements set by the new standard.
The Company continues to assess all potential impacts of the ASUs. The Company plans to elect to adopt the package of transition practical expedients, which permits the Company not to reassess its prior conclusions regarding lease identification, lease classification and initial direct costs. The Company does not expect to apply the hindsight practical expedient upon adoption. The Company plans to adopt the policy election to not separate lease and non-lease components for certain asset classes, as well as the short-term lease policy election offered under the ASUs.
The adoption of the ASUs will have a material impact on the Company’s consolidated balance sheets due to the initial recognition of right of use (“ROU”) assets and lease liabilities for the Company’s operating and finance lease arrangements, which will be partially offset by the derecognition of existing assets and financing obligations related to build-to-suit lease transactions.
The Company anticipates the adoption will have a material impact on its consolidated statements of income, specifically cost of goods sold and interest expense—net, primarily due to the change from build-to-suit lease transactions under the previous accounting guidance to the new finance lease classification treatment. The finance lease classification for these leases will generally result in a higher expense than the corresponding cash payments at the beginning of the lease term and will decline over the lease term as the liability is reduced. The ROU asset amortization portion of the expense will be recorded within cost of goods sold and the debt service (interest portion) will be recorded within interest expense—net. Additionally, the Company expects the adoption will impact its selling, general, and administrative expenses and income tax expense.
Variable lease payments, such as percent rent and rent escalations not known upon lease commencement, are not included in the determination of the minimum lease payments to recognize the ROU assets and lease liabilities, and will be expensed as incurred.
The Company expects the adoption will impact its consolidated statement of cash flows due to the effects of the finance lease classification for certain of its leases, as the guidance requires the cash payments for the principal portion of the lease to be presented in financing activities and the cash payments for the interest portion to be presented within operating activities.
As mentioned above, the adoption of the ASUs will result in the derecognition of the build-to-suit property asset (included in property and equipment—net) and the financing obligations under build-to-suit lease transactions on the consolidated balance sheets as follows (in thousands):
|
|
|
February 2, |
|
|
February 3, |
|
||
|
|
|
2019 |
|
|
2018 |
|
||
|
Build-to-suit property |
|
$ |
245,217 |
|
|
$ |
237,909 |
|
|
Financing obligations under build-to-suit lease transactions |
|
|
228,928 |
|
|
|
229,323 |
|
102
The Company preliminarily expects the adoption to result in the following amounts being recorded on its consolidated balance sheets for its operating and finance leases (in millions):
|
|
|
February 2, |
|
February 3, |
|
|
|
2019 |
|
2018 |
|
ROU assets |
|
$1,090 - $1,190 |
|
$930 - $1,030 |
|
Lease liabilities |
|
$880 - $980 |
|
$750 - $850 |
The above amounts are inclusive of a reclassification from leasehold improvement (included in property and equipment—net) to ROU assets in the range of approximately $250 million to $300 million as of February 2, 2019 and approximately $200 million to $250 million as of February 3, 2018, as well as a reclassification of deferred rent and lease incentives related to operating leases to ROU assets of $48.0 million and $48.9 million as of February 2, 2019 and February 3, 2018, respectively.
The Company is in the process of finalizing the impact of adopting the ASUs on retained earnings as of January 28, 2017, the earliest prior reporting period presented, but preliminarily expects the retrospective adoption to increase opening retained earnings within the consolidated balance sheets.
Financial Instruments
In January 2016, the FASB issued Accounting Standards Update 2016-01—Financial Instruments—Overall (Subtopic 825-10): Recognition and Measurement of Financial Assets and Financial Liabilities, which amends various aspects of the recognition, measurement, presentation and disclosure for financial instruments. The new standard is effective for fiscal years beginning after December 15, 2017, including interim periods within those fiscal years. Early adoption is permitted only for certain provisions. The Company adopted this new accounting standard in the first quarter of fiscal 2018 and such adoption did not have an impact on its consolidated financial statements.
Cash Flow: Classification and Restricted Cash
In August 2016, the FASB issued Accounting Standards Update No. 2016-15—Statement of Cash Flows (Topic 230): Classification of Certain Cash Receipts and Cash Payments. The new guidance addresses eight specific cash flow issues with the objective of reducing existing diversity in practice regarding the manner in which certain cash receipts and payments are presented and classified in the consolidated statements of cash flows. The new guidance is effective for fiscal years beginning after December 15, 2017, including interim periods within those fiscal years. Early adoption is permitted. The Company adopted this new accounting standard in the first quarter of fiscal 2018 which resulted in a change to the presentation of the loss on early extinguishment of debt on the consolidated statement of cash flows for fiscal 2017. Adoption of this new accounting standard resulted in an increase in the loss on extinguishment of debt amount in cash flows from operating activities of $3.0 million and an increase in repayments under term loans in cash flows from financing activities of $3.0 million for fiscal 2017.
In November 2016, the FASB issued Accounting Standards Update No. 2016-18—Statement of Cash Flows (Topic 230): Restricted Cash. The new guidance requires that a statement of cash flows explain the change during the period in the total of cash, cash equivalents, and amounts generally described as restricted cash or restricted cash equivalents. Amounts generally described as restricted cash and restricted cash equivalents should be included with cash and cash equivalents when reconciling the beginning-of-period and end-of-period total amounts on the statement of cash flows. The new guidance is effective for fiscal years beginning after December 15, 2017, including interim periods within those fiscal years. Early adoption is permitted. Adoption of the standard will be applied using a retrospective transition method to each period presented. The Company adopted this new accounting standard in the first quarter of fiscal 2018 which resulted in a change to the presentation of the construction related deposits on the consolidated statement of cash flows. The Company considers the construction related deposits (included in other non-current assets on the consolidated balance sheets) to be “restricted cash equivalents” and therefore, under the new accounting guidance, is required to include such deposits in beginning and ending “cash and cash equivalents and restricted cash equivalents” on the consolidated statement of cash flows. Previously, funding of the construction related deposit accounts was included within the “investing” section of the consolidated statement of cash flows and usage of the deposits was presented as a non-cash transaction. Under the new accounting guidance, funding of the construction related deposit accounts will not be presented on the consolidated statement of cash flows and the usage of the deposits will be presented within the “capital expenditures” line item under the “investing” section. Adoption of this new accounting standard resulted in an increase of the beginning and ending “cash and cash equivalents and restricted cash equivalents” amounts of $28.0 million and $7.4 million, respectively, as well as resulted in an increase in capital expenditures of $33.7 million and a decrease in construction related deposits of $14.4 million in cash flows from investing activities, and resulted in an increase in prepaid expense and other assets of $1.3 million in cash flows from operating activities for fiscal 2017. Adoption of this new accounting standard resulted in an increase of the beginning and ending “cash and cash equivalents and restricted cash equivalents” amounts of $15.4 million and $28.0 million, respectively, as well as resulted in an increase in capital
103
expenditures of $12.4 million and a decrease in construction related deposits of $23.4 million in cash flows from investing activities, and resulted in a decrease in prepaid expense and other assets of $1.6 million in cash flows from operating activities for fiscal 2016.
Income Taxes: Intra-Entity Asset Transfers
In October 2016, the FASB issued Accounting Standards Update No. 2016-16—Income Taxes (Topic 740): Intra-Entity Transfers of Assets Other Than Inventory. The new guidance requires the recognition of the income tax consequences of an intercompany asset transfer, other than transfers of inventory, when the transfer occurs. For intercompany transfers of inventory, the income tax effects will continue to be deferred until the inventory has been sold to a third party. The new guidance is effective for fiscal years beginning after December 15, 2017, including interim periods within those fiscal years. Early adoption is permitted. The Company adopted this new accounting standard in the first quarter of fiscal 2018 and such adoption did not have an impact on its consolidated financial statements.
Stock-Based Compensation
In May 2017, the FASB issued Accounting Standards Update No. 2017-09—Compensation—Stock Compensation (Topic 718): Scope of Modification Accounting. The new guidance clarifies when modification accounting should be applied for changes to terms or conditions of a share-based payment award. The new guidance is effective for fiscal years beginning after December 15, 2017, including interim periods within that reporting period, with early adoption permitted. The standard will be applied prospectively. The Company adopted this new accounting standard in the first quarter of fiscal 2018 and such adoption did not have an impact on its consolidated financial statements.
Cloud Computing
In August 2018, the FASB issued Accounting Standards Update 2018-15—Intangibles—Goodwill and Other—Internal-Use Software (Subtopic 350-40): Customer’s Accounting for Implementation Costs Incurred in a Cloud Computing Arrangement that is a Service Contract, which amends Accounting Standards Update 2015-05—Customers Accounting for Fees in a Cloud Computing Agreement. The amendments in this ASU more closely align the requirements for capitalizing implementation costs incurred in a hosting arrangement that is a service contract with the requirements for capitalizing implementation costs incurred to develop or obtain internal-use software (and hosting arrangements that include an internal use software license). The ASU is effective for fiscal years beginning after December 15, 2019, including interim periods within those fiscal years. Early adoption is permitted. The Company is currently evaluating the effects that the adoption of this new accounting standard will have on its consolidated financial statements.
NOTE 4—BUSINESS COMBINATION
On May 27, 2016, the Company acquired a controlling interest in Design Investors WW Acquisition Company, LLC, which owns the business operating under the name “Waterworks.” The purchase price of the acquisition was approximately $119.9 million consisting of $118.4 million funded with available cash and $1.5 million representing the fair value of rollover units. The rollover units, which are classified as a liability, are included in non-current liabilities on the consolidated balance sheets (refer to Note 16—Stock-Based Compensation). After the transaction, and giving effect to equity interests acquired by management in the business, the Company owns in excess of 90% of the total equity interest in Waterworks, and owns 100% of the voting equity interest.
The Company did not incur any acquisition-related costs during fiscal 2018 or fiscal 2017. In fiscal 2016, the Company incurred $2.8 million of acquisition-related costs associated with the transaction. These costs and expenses include fees associated with financial, legal and accounting advisors, and employment related costs, and are included in selling, general and administrative expenses on the consolidated statements of income.
The Company recorded a purchase price allocation adjustment of $1.9 million during the first half of fiscal 2017. The adjustment primarily related to a subset of inventory acquired for which the Company completed a fair value analysis based on the facts and circumstances that existed as of the acquisition date. Subsequent to the acquisition date, only a small portion of such inventory had been sold and therefore the impact on the Company’s results of operations for historical periods since the acquisition was insignificant.
Under purchase accounting rules, the Company valued the acquired finished goods inventory to fair value, which is defined as the estimated selling price less the sum of (a) costs of disposal and (b) a reasonable profit allowance for the Company’s selling effort. This valuation resulted in an increase in inventory carrying value of approximately $9.7 million for marketable inventory.
104
The tradename has been assigned an indefinite life and therefore is not subject to amortization. The goodwill is representative of the benefits and expected synergies from the integration of Waterworks products and Waterworks’ management and employees, which do not qualify for separate recognition as an intangible asset. A portion of the tradename and goodwill are not deductible for tax purposes.
Results of operations of Waterworks have been included in the Company’s consolidated statements of income since the May 27, 2016 acquisition date. Pro forma results of the acquired business have not been presented as the results were not considered material to the Company’s consolidated financial statements for all periods presented and would not have been material had the acquisition occurred at the beginning of fiscal 2016.
NOTE 5—PREPAID EXPENSE AND OTHER ASSETS
Prepaid expense and other current assets consist of the following (in thousands):
|
|
|
February 2, |
|
|
February 3, |
|
||
|
|
|
2019 |
|
|
2018 |
|
||
|
Insurance recovery receivable |
|
$ |
50,000 |
|
|
$ |
— |
|
|
Capitalized catalog costs |
|
|
16,178 |
|
|
|
44,122 |
|
|
Vendor deposits |
|
|
11,836 |
|
|
|
9,701 |
|
|
Right of return asset for merchandise |
|
|
5,883 |
|
|
|
— |
|
|
Federal and state tax receivable |
|
|
4,862 |
|
|
|
— |
|
|
Prepaid expense and other current assets |
|
|
15,960 |
|
|
|
14,762 |
|
|
Total prepaid expense and other current assets |
|
$ |
104,719 |
|
|
$ |
68,585 |
|
Other non-current assets consist of the following (in thousands):
|
|
|
February 2, |
|
|
February 3, |
|
||
|
|
|
2019 |
|
|
2018 |
|
||
|
Promissory note receivable, including interest |
|
$ |
5,104 |
|
|
$ |
— |
|
|
Other deposits |
|
|
5,068 |
|
|
|
4,997 |
|
|
Deferred financing fees |
|
|
3,415 |
|
|
|
4,446 |
|
|
Construction related deposits |
|
|
— |
|
|
|
7,407 |
|
|
Other non-current assets |
|
|
5,758 |
|
|
|
4,482 |
|
|
Total other non-current assets |
|
$ |
19,345 |
|
|
$ |
21,332 |
|
NOTE 6—PROPERTY AND EQUIPMENT
Property and equipment consists of the following (in thousands):
|
|
|
February 2, |
|
|
February 3, |
|
||
|
|
|
2019 |
|
|
2018 |
|
||
|
Leasehold improvements (1) |
|
$ |
614,510 |
|
|
$ |
556,443 |
|
|
Computer software |
|
|
143,776 |
|
|
|
130,890 |
|
|
Furniture, fixtures and equipment |
|
|
76,194 |
|
|
|
81,469 |
|
|
Machinery, equipment and aircraft |
|
|
54,207 |
|
|
|
52,757 |
|
|
Building and building improvements |
|
|
28,233 |
|
|
|
4,927 |
|
|
Land |
|
|
11,518 |
|
|
|
11,382 |
|
|
Build-to-suit property (2) (3) |
|
|
245,217 |
|
|
|
237,909 |
|
|
Building and equipment under capital leases |
|
|
9,343 |
|
|
|
8,060 |
|
|
Total property and equipment |
|
|
1,182,998 |
|
|
|
1,083,837 |
|
|
Less—accumulated depreciation and amortization (4) |
|
|
(319,436 |
) |
|
|
(283,139 |
) |
|
Total property and equipment—net |
|
$ |
863,562 |
|
|
$ |
800,698 |
|
|
(1) |
Leasehold improvements include construction in progress of $79.0 million and $110.4 million as of February 2, 2019 and February 3, 2018, respectively. |
|
(2) |
The Company capitalizes assets and records a corresponding non-current liability for build-to-suit lease transactions where it is considered the owner, for accounting purposes. Refer to “Lease Accounting” within Note 3—Significant Accounting Policies. |
105
|
(4) |
Includes accumulated amortization related to equipment under capital leases of $2.9 million and $2.1 million as of February 2, 2019 and February 3, 2018, respectively. |
The Company recorded depreciation expense of $74.3 million, $70.0 million and $56.9 million in fiscal 2018, fiscal 2017 and fiscal 2016, respectively.
NOTE 7—GOODWILL AND TRADENAMES, TRADEMARKS AND DOMAIN NAMES
The following sets forth the fiscal 2018 goodwill and tradenames, trademarks and domain names activity for the RH Segment and Waterworks (in thousands):
|
|
|
February 3, 2018 |
|
|
Impairment (1) |
|
|
Foreign Currency Translation |
|
|
February 2, 2019 |
|
|
||||
|
RH Segment |
|
|
|
|
|
|
|
|
|
|
|
|
|
|
|
|
|
|
Goodwill |
|
$ |
124,448 |
|
|
$ |
— |
|
|
$ |
(69 |
) |
|
$ |
124,379 |
|
|
|
Tradename, trademarks and domain names |
|
|
48,563 |
|
|
|
— |
|
|
|
— |
|
|
|
48,563 |
|
|
|
|
|
|
|
|
|
|
|
|
|
|
|
|
|
|
|
|
|
|
Waterworks |
|
|
|
|
|
|
|
|
|
|
|
|
|
|
|
|
|
|
Goodwill (2) |
|
|
17,445 |
|
|
|
(17,445 |
) |
|
|
— |
|
|
|
— |
|
|
|
Tradename (3) |
|
|
52,100 |
|
|
|
(14,641 |
) |
|
|
— |
|
|
|
37,459 |
|
|
|
(1) |
Refer to “Impairment” within Note 3—Significant Accounting Policies. |
|
(2) |
The Waterworks reporting unit goodwill is presented net of an impairment charge of $51.1 million, of which $17.4 million was recorded in fiscal 2018 and $33.7 million was recorded in fiscal 2017. |
|
(3) |
The Waterworks reporting unit tradename is presented net of an impairment charge of $14.6 million recorded in fiscal 2018. |
The following sets forth the fiscal 2017 goodwill and tradenames, trademarks and domain names activity for the RH Segment and Waterworks (in thousands):
|
|
|
January 28, 2017 |
|
|
Purchase Price Allocation Adjustment (1) |
|
|
Additions |
|
|
Impairment (2) |
|
|
Foreign Currency Translation |
|
|
February 3, 2018 |
|
||||||
|
RH Segment |
|
|
|
|
|
|
|
|
|
|
|
|
|
|
|
|
|
|
|
|
|
|
|
|
|
Goodwill |
|
$ |
124,374 |
|
|
$ |
— |
|
|
$ |
— |
|
|
$ |
— |
|
|
$ |
74 |
|
|
$ |
124,448 |
|
|
Tradename, trademarks and domain names |
|
|
48,524 |
|
|
|
— |
|
|
|
39 |
|
|
|
— |
|
|
|
— |
|
|
|
48,563 |
|
|
|
|
|
|
|
|
|
|
|
|
|
|
|
|
|
|
|
|
|
|
|
|
|
|
|
|
Waterworks |
|
|
|
|
|
|
|
|
|
|
|
|
|
|
|
|
|
|
|
|
|
|
|
|
|
Goodwill (3) |
|
|
49,229 |
|
|
|
1,916 |
|
|
|
— |
|
|
|
(33,700 |
) |
|
|
— |
|
|
|
17,445 |
|
|
Tradename |
|
|
52,100 |
|
|
|
— |
|
|
|
— |
|
|
|
— |
|
|
|
— |
|
|
|
52,100 |
|
|
(1) |
The Company recorded goodwill and tradename of $49.2 million and $52.1 million, respectively, in fiscal 2016 related to its acquisition of Waterworks. During fiscal 2017, Waterworks goodwill increased due to purchase price accounting adjustments. Refer to Note 4—Business Combination. |
|
(2) |
Refer to “Impairment” within Note 3—Significant Accounting Policies. |
|
(3) |
The Waterworks reporting unit goodwill is presented net of an impairment charge of $33.7 million recorded in fiscal 2017. |
106
NOTE 8—ACCOUNTS PAYABLE, ACCRUED EXPENSES AND OTHER CURRENT LIABILITIES
Accounts payable and accrued expenses consist of the following (in thousands):
|
|
|
February 2, |
|
|
February 3, |
|
||
|
|
|
2019 |
|
|
2018 |
|
||
|
Accounts payable |
|
$ |
183,039 |
|
|
$ |
195,313 |
|
|
Accrued compensation |
|
|
64,192 |
|
|
|
47,534 |
|
|
Accrued freight and duty |
|
|
20,787 |
|
|
|
23,757 |
|
|
Accrued sales taxes |
|
|
18,354 |
|
|
|
19,525 |
|
|
Accrued occupancy |
|
|
10,784 |
|
|
|
8,612 |
|
|
Accrued catalog costs |
|
|
10,276 |
|
|
|
9,000 |
|
|
Accrued professional fees |
|
|
2,050 |
|
|
|
3,555 |
|
|
Other accrued expenses |
|
|
10,959 |
|
|
|
11,469 |
|
|
Total accounts payable and accrued expenses |
|
$ |
320,441 |
|
|
$ |
318,765 |
|
Other current liabilities consist of the following (in thousands):
|
|
|
February 2, |
|
|
February 3, |
|
||
|
|
|
2019 |
|
|
2018 |
|
||
|
Provision for legal settlement |
|
$ |
50,000 |
|
|
$ |
— |
|
|
Allowance for sales returns |
|
|
19,821 |
|
|
|
10,565 |
|
|
Unredeemed gift card and merchandise credit liability |
|
|
17,192 |
|
|
|
24,138 |
|
|
Product recall reserve |
|
|
7,767 |
|
|
|
1,201 |
|
|
Current portion of non-current debt |
|
|
892 |
|
|
|
6,033 |
|
|
Federal and state tax payable |
|
|
— |
|
|
|
5,391 |
|
|
Other current liabilities |
|
|
5,675 |
|
|
|
3,838 |
|
|
Total other current liabilities |
|
$ |
101,347 |
|
|
$ |
51,166 |
|
NOTE 9—OTHER NON-CURRENT OBLIGATIONS
Other non-current obligations consist of the following (in thousands):
|
|
|
February 2, |
|
|
February 3, |
|
||
|
|
|
2019 |
|
|
2018 |
|
||
|
Notes payable for share repurchases |
|
$ |
18,741 |
|
|
$ |
19,390 |
|
|
Lease loss liabilities (1) |
|
|
11,992 |
|
|
|
9,684 |
|
|
Capital lease obligations—non-current |
|
|
7,720 |
|
|
|
7,509 |
|
|
Unrecognized tax benefits |
|
|
2,992 |
|
|
|
3,728 |
|
|
Deferred contract incentive (2) |
|
|
2,976 |
|
|
|
5,358 |
|
|
Rollover units and profit interests (3) |
|
|
2,637 |
|
|
|
2,211 |
|
|
Other non-current obligations |
|
|
3,288 |
|
|
|
2,996 |
|
|
Equipment security notes (4) |
|
|
— |
|
|
|
13,864 |
|
|
Promissory note (5) |
|
|
— |
|
|
|
11,627 |
|
|
Total other non-current obligations |
|
$ |
50,346 |
|
|
$ |
76,367 |
|
|
(1) |
Refer to “Impairment—Distribution Center Closures” and “Impairment—RH Contemporary Art Impairment” within Note 3—Significant Accounting Policies. |
|
(2) |
Represents the non-current portion of an incentive payment received in relation to a 5-year service agreement, which will be amortized over the term of the agreement. |
|
(3) |
Represents rollover units and profit interests associated with the acquisition of Waterworks. Refer to Note 16—Stock-Based Compensation. |
|
(4) |
Represents the non-current portion of equipment security notes secured by certain of the Company’s distribution center property and equipment. The equipment security notes were repaid in full in June 2018. As a result of the repayment, the Company incurred a $0.2 million loss on extinguishment of debt in fiscal 2018. |
|
(5) |
Represents the non-current portion of a promissory note secured by the Company’s aircraft. The promissory note was repaid in full in June 2018. As a result of the repayment, the Company incurred a $0.2 million loss on extinguishment of debt in fiscal 2018. |
107
NOTE 10—CONVERTIBLE SENIOR NOTES
0.00% Convertible Senior Notes due 2023
In June 2018, the Company issued in a private offering $300 million principal amount of 0.00% convertible senior notes due 2023 and issued an additional $35 million principal amount in connection with the overallotment option granted to the initial purchasers as part of the offering (collectively, the “2023 Notes”). The 2023 Notes are governed by the terms of an indenture between the Company and U.S. Bank National Association, as the Trustee. The 2023 Notes will mature on June 15, 2023, unless earlier purchased by the Company or converted. The 2023 Notes will not bear interest, except that the 2023 Notes will be subject to “special interest” in certain limited circumstances in the event of the failure of the Company to perform certain of its obligations under the indenture governing the 2023 Notes. The 2023 Notes are unsecured obligations and do not contain any financial covenants or restrictions on the payments of dividends, the incurrence of indebtedness or the issuance or repurchase of securities by the Company or any of its subsidiaries. Certain events are also considered “events of default” under the 2023 Notes, which may result in the acceleration of the maturity of the 2023 Notes, as described in the indenture governing the 2023 Notes.
The initial conversion rate applicable to the 2023 Notes is 5.1640 shares of common stock per $1,000 principal amount of 2023 Notes, which is equivalent to an initial conversion price of approximately $193.65 per share. The conversion rate will be subject to adjustment upon the occurrence of certain specified events, but will not be adjusted for any accrued and unpaid special interest. In addition, upon the occurrence of a “make-whole fundamental change” as defined in the indenture, the Company will, in certain circumstances, increase the conversion rate by a number of additional shares for a holder that elects to convert its 2023 Notes in connection with such make-whole fundamental change.
Prior to March 15, 2023, the 2023 Notes will be convertible only under the following circumstances: (1) during any calendar quarter commencing after September 30, 2018, if, for at least 20 trading days (whether or not consecutive) during the 30 consecutive trading day period ending on the last trading day of the immediately preceding calendar quarter, the last reported sale price of the Company’s common stock on such trading day is greater than or equal to 130% of the applicable conversion price on such trading day; (2) during the five consecutive business day period after any ten consecutive trading day period in which, for each day of that period, the trading price per $1,000 principal amount of 2023 Notes for such trading day was less than 98% of the product of the last reported sale price of the Company’s common stock and the applicable conversion rate on such trading day; or (3) upon the occurrence of specified corporate transactions. As of February 2, 2019, none of these conditions have occurred and, as a result, the 2023 Notes are not convertible as of February 2, 2019. On and after March 15, 2023, until the close of business on the second scheduled trading day immediately preceding the maturity date, holders may convert all or a portion of their 2023 Notes at any time, regardless of the foregoing circumstances. Upon conversion, the 2023 Notes will be settled, at the Company’s election, in cash, shares of the Company’s common stock, or a combination of cash and shares of the Company’s common stock. If the Company has not delivered a notice of its election of settlement method prior to the final conversion period it will be deemed to have elected combination settlement with a dollar amount per note to be received upon conversion of $1,000.
The Company may not redeem the 2023 Notes; however, upon the occurrence of a fundamental change (as defined in the indenture governing the notes), holders may require the Company to purchase all or a portion of their 2023 Notes for cash at a price equal to 100% of the principal amount of the 2023 Notes to be purchased plus any accrued and unpaid special interest to, but excluding, the fundamental change purchase date.
Under GAAP, certain convertible debt instruments that may be settled in cash on conversion are required to be separately accounted for as liability and equity components of the instrument in a manner that reflects the issuer’s non-convertible debt borrowing rate. Accordingly, in accounting for the issuance of the 2023 Notes, the Company separated the 2023 Notes into liability and equity components. The carrying amount of the liability component was calculated by measuring the fair value of a similar liability that does not have an associated convertible feature. The carrying amount of the equity component, which is recognized as a debt discount, represents the difference between the proceeds from the issuance of the 2023 Notes and the fair value of the liability component of the 2023 Notes. The excess of the principal amount of the liability component over its carrying amount (“debt discount”) will be amortized to interest expense using an effective interest rate of 6.35% over the expected life of the 2023 Notes. The equity component is not remeasured as long as it continues to meet the conditions for equity classification.
In accounting for the debt issuance costs related to the issuance of the 2023 Notes, the Company allocated the total amount incurred to the liability and equity components based on their relative values. Debt issuance costs attributable to the liability component are amortized to interest expense using the effective interest method over the expected life of the 2023 Notes, and debt issuance costs attributable to the equity component are netted with the equity component in stockholders’ equity (deficit).
Debt issuance costs related to the 2023 Notes were comprised of discounts upon original issuance of $1.7 million and third party offering costs of $4.6 million. Discounts and third party offering costs attributable to the liability component are recorded as a contra-liability and are presented net against the convertible senior notes due 2023 balance on the consolidated balance sheets. The Company recorded $0.5 million related to the amortization of debt issuance costs in fiscal 2018 related to the 2023 Notes.
108
The carrying values of the 2023 Notes, excluding the discounts upon original issuance and third party offering costs, are as follows (in thousands):
|
|
|
February 2, |
|
|
|
|
|
2019 |
|
|
|
Liability component |
|
|
|
|
|
Principal |
|
$ |
335,000 |
|
|
Less: Debt discount |
|
|
(81,311 |
) |
|
Net carrying amount |
|
$ |
253,689 |
|
|
Equity component (1) |
|
$ |
90,990 |
|
|
(1) |
Included in additional paid-in capital on the consolidated balance sheets. |
The Company recorded interest expense of $9.7 million for the amortization of the debt discount related to the 2023 Notes during fiscal 2018, respectively.
2023 Notes—Convertible Bond Hedge and Warrant Transactions
In connection with the offering of the 2023 Notes and exercise of the overallotment option in June 2018, the Company entered into convertible note hedge transactions whereby the Company has the option to purchase a total of approximately 1.7 million shares of its common stock at a price of approximately $193.65 per share. The total cost of the convertible note hedge transactions was $91.9 million. In addition, the Company sold warrants whereby the holders of the warrants have the option to purchase a total of approximately 1.7 million shares of the Company’s common stock at a price of $309.84 per share. The warrants contain certain adjustment mechanisms whereby the total number of shares to be purchased under such warrants may be increased up to a cap of 3.5 million shares of common stock (which cap may also be subject to adjustment). The Company received $51.0 million in cash proceeds from the sale of these warrants. Taken together, the purchase of the convertible note hedges and sale of the warrants are intended to offset any actual earnings dilution from the conversion of the 2023 Notes until the Company’s common stock is above approximately $309.84 per share. As these transactions meet certain accounting criteria, the convertible note hedges and warrants are recorded in stockholders’ equity (deficit), are not accounted for as derivatives and are not remeasured each reporting period. The net costs incurred in connection with the convertible note hedge and warrant transactions were recorded as a reduction to additional paid-in capital on the consolidated balance sheets.
The Company recorded a deferred tax liability of $22.3 million in connection with the debt discount associated with the 2023 Notes and recorded a deferred tax asset of $22.5 million in connection with the convertible note hedge transactions. The deferred tax liability and deferred tax asset are recorded in deferred tax assets on the consolidated balance sheets.
0.00% Convertible Senior Notes due 2020
In June 2015, the Company issued in a private offering $250 million principal amount of 0.00% convertible senior notes due 2020 and, in July 2015, the Company issued an additional $50 million principal amount pursuant to the exercise of the overallotment option granted to the initial purchasers as part of its June 2015 offering (collectively, the “2020 Notes”). The 2020 Notes are governed by the terms of an indenture between the Company and U.S. Bank National Association, as the Trustee. The 2020 Notes will mature on July 15, 2020, unless earlier purchased by the Company or converted. The 2020 Notes will not bear interest, except that the 2020 Notes will be subject to “special interest” in certain limited circumstances in the event of the failure of the Company to perform certain of its obligations under the indenture governing the 2020 Notes. The 2020 Notes are unsecured obligations and do not contain any financial covenants or restrictions on the payments of dividends, the incurrence of indebtedness or the issuance or repurchase of securities by the Company or any of its subsidiaries. Certain events are also considered “events of default” under the 2020 Notes, which may result in the acceleration of the maturity of the 2020 Notes, as described in the indenture governing the 2020 Notes. The 2020 Notes are guaranteed by the Company’s primary operating subsidiary, Restoration Hardware, Inc., as Guarantor. The guarantee is the unsecured obligation of the Guarantor and is subordinated to the Guarantor’s obligations from time to time with respect to its credit agreement and ranks equal in right of payment with respect to Guarantor’s other obligations.
The initial conversion rate applicable to the 2020 Notes is 8.4656 shares of common stock per $1,000 principal amount of 2020 Notes, which is equivalent to an initial conversion price of approximately $118.13 per share. The conversion rate will be subject to adjustment upon the occurrence of certain specified events, but will not be adjusted for any accrued and unpaid special interest. In addition, upon the occurrence of a “make-whole fundamental change” as defined in the indenture, the Company will, in certain circumstances, increase the conversion rate by a number of additional shares for a holder that elects to convert its 2020 Notes in connection with such make-whole fundamental change.
109
Prior to March 15, 2020, the 2020 Notes will be convertible only under the following circumstances: (1) during any calendar quarter commencing after September 30, 2015, if, for at least 20 trading days (whether or not consecutive) during the 30 consecutive trading day period ending on the last trading day of the immediately preceding fiscal quarter, the last reported sale price of the Company’s common stock on such trading day is greater than or equal to 130% of the applicable conversion price on such trading day; (2) during the five consecutive business day period after any ten consecutive trading day period in which, for each day of that period, the trading price per $1,000 principal amount of 2020 Notes for such trading day was less than 98% of the product of the last reported sale price of the Company’s common stock and the applicable conversion rate on such trading day; or (3) upon the occurrence of specified corporate transactions. As of February 2, 2019, none of these conditions have occurred and, as a result, the 2020 Notes are not convertible as of February 2, 2019. On and after March 15, 2020, until the close of business on the second scheduled trading day immediately preceding the maturity date, holders may convert all or a portion of their 2020 Notes at any time, regardless of the foregoing circumstances. Upon conversion, the 2020 Notes will be settled, at the Company’s election, in cash, shares of the Company’s common stock, or a combination of cash and shares of the Company’s common stock. If the Company has not delivered a notice of its election of settlement method prior to the final conversion period it will be deemed to have elected combination settlement with a dollar amount per note to be received upon conversion of $1,000.
The Company may not redeem the 2020 Notes; however, upon the occurrence of a fundamental change (as defined in the indenture governing the notes), holders may require the Company to purchase all or a portion of their 2020 Notes for cash at a price equal to 100% of the principal amount of the 2020 Notes to be purchased plus any accrued and unpaid special interest to, but excluding, the fundamental change purchase date.
Under GAAP, certain convertible debt instruments that may be settled in cash on conversion are required to be separately accounted for as liability and equity components of the instrument in a manner that reflects the issuer’s non-convertible debt borrowing rate. Accordingly, in accounting for the issuance of the 2020 Notes, the Company separated the 2020 Notes into liability and equity components. The carrying amount of the liability component was calculated by measuring the fair value of a similar liability that does not have an associated convertible feature. The carrying amount of the equity component, which is recognized as a debt discount, represents the difference between the proceeds from the issuance of the 2020 Notes and the fair value of the liability component of the 2020 Notes. The debt discount will be amortized to interest expense using an effective interest rate of 6.47% over the expected life of the 2020 Notes. The equity component is not remeasured as long as it continues to meet the conditions for equity classification.
In accounting for the debt issuance costs related to the issuance of the 2020 Notes, the Company allocated the total amount incurred to the liability and equity components based on their relative values. Debt issuance costs attributable to the liability component are amortized to interest expense using the effective interest method over the expected life of the 2020 Notes, and debt issuance costs attributable to the equity component are netted with the equity component in stockholders’ equity (deficit).
Debt issuance costs related to the 2020 Notes were comprised of discounts upon original issuance of $3.8 million and third party offering costs of $2.3 million. Discounts and third party offering costs attributable to the liability component are recorded as a contra-liability and are presented net against the convertible senior notes due 2020 balance on the consolidated balance sheets. The Company recorded $1.1 million, $1.0 million and $1.0 million related to the amortization of debt issuance costs in fiscal 2018, fiscal 2017 and fiscal 2016, respectively, related to the 2020 Notes.
The carrying values of the 2020 Notes, excluding the discounts upon original issuance and third party offering costs, are as follows (in thousands):
|
|
|
February 2, |
|
|
February 3, |
|
||
|
|
|
2019 |
|
|
2018 |
|
||
|
Liability component |
|
|
|
|
|
|
|
|
|
Principal |
|
$ |
300,000 |
|
|
$ |
300,000 |
|
|
Less: Debt discount |
|
|
(27,081 |
) |
|
|
(44,135 |
) |
|
Net carrying amount |
|
$ |
272,919 |
|
|
$ |
255,865 |
|
|
Equity component (1) |
|
$ |
84,003 |
|
|
$ |
84,003 |
|
|
(1) |
Included in additional paid-in capital on the consolidated balance sheets. |
The Company recorded interest expense of $17.1 million, $16.0 million and $15.0 million for the amortization of the debt discount related to the 2020 Notes during fiscal 2018, fiscal 2017 and fiscal 2016, respectively.
110
2020 Notes—Convertible Bond Hedge and Warrant Transactions
In connection with the offering of the 2020 Notes in June 2015 and the exercise in full of the overallotment option in July 2015, the Company entered into convertible note hedge transactions whereby the Company has the option to purchase a total of approximately 2.5 million shares of its common stock at a price of approximately $118.13 per share. The total cost of the convertible note hedge transactions was $68.3 million. In addition, the Company sold warrants whereby the holders of the warrants have the option to purchase a total of approximately 2.5 million shares of the Company’s common stock at a price of $189.00 per share. The warrants contain certain adjustment mechanisms whereby the total number of shares to be purchased under such warrants may be increased up to a cap of 5.1 million shares of common stock (which cap may also be subject to adjustment). The Company received $30.4 million in cash proceeds from the sale of these warrants. Taken together, the purchase of the convertible note hedges and sale of the warrants are intended to offset any actual earnings dilution from the conversion of the 2020 Notes until the Company’s common stock is above approximately $189.00 per share. As these transactions meet certain accounting criteria, the convertible note hedges and warrants are recorded in stockholders’ equity (deficit), are not accounted for as derivatives and are not remeasured each reporting period. The net costs incurred in connection with the convertible note hedge and warrant transactions were recorded as a reduction to additional paid-in capital on the consolidated balance sheets.
The Company recorded a deferred tax liability of $32.8 million in connection with the debt discount associated with the 2020 Notes and recorded a deferred tax asset of $26.6 million in connection with the convertible note hedge transactions. The deferred tax liability and deferred tax asset are recorded in non-current deferred tax assets on the consolidated balance sheets.
The provision for income taxes in fiscal 2017 included $1.1 million of income tax benefit as a result of the Tax Act for the provisional re-measurement of the deferred tax asset and liability related to the 2020 Notes for the reduction in the U.S. corporate income tax rate from 35% to 21%.
0.00% Convertible Senior Notes due 2019
On June 18, 2014, the Company issued $350 million principal amount of 0.00% convertible senior notes due 2019 (the “2019 Notes”) in a private offering. The 2019 Notes are governed by the terms of an indenture between the Company and U.S. Bank National Association, as the Trustee. The 2019 Notes will mature on June 15, 2019, unless earlier purchased by the Company or converted. The 2019 Notes will not bear interest, except that the 2019 Notes will be subject to “special interest” in certain limited circumstances in the event of the failure of the Company to perform certain of its obligations under the indenture governing the 2019 Notes. The 2019 Notes are unsecured obligations and do not contain any financial covenants or restrictions on the payments of dividends, the incurrence of indebtedness or the issuance or repurchase of securities by the Company or any of its subsidiaries. Certain events are also considered “events of default” under the 2019 Notes, which may result in the acceleration of the maturity of the 2019 Notes, as described in the indenture governing the 2019 Notes.
The initial conversion rate applicable to the 2019 Notes is 8.6143 shares of common stock per $1,000 principal amount of 2019 Notes, which is equivalent to an initial conversion price of approximately $116.09 per share. The conversion rate will be subject to adjustment upon the occurrence of certain specified events, but will not be adjusted for any accrued and unpaid special interest. In addition, upon the occurrence of a “make-whole fundamental change,” the Company will, in certain circumstances, increase the conversion rate by a number of additional shares for a holder that elects to convert its 2019 Notes in connection with such make-whole fundamental change.
Prior to March 15, 2019, the 2019 Notes will be convertible only under the following circumstances: (1) during any calendar quarter commencing after September 30, 2014, if, for at least 20 trading days (whether or not consecutive) during the 30 consecutive trading day period ending on the last trading day of the immediately preceding fiscal quarter, the last reported sale price of the Company’s common stock on such trading day is greater than or equal to 130% of the applicable conversion price on such trading day; (2) during the five consecutive business day period after any ten consecutive trading day period in which, for each day of that period, the trading price per $1,000 principal amount of 2019 Notes for such trading day was less than 98% of the product of the last reported sale price of the Company’s common stock and the applicable conversion rate on such trading day; or (3) upon the occurrence of specified corporate transactions. As of February 2, 2019, none of these conditions have occurred and, as a result, the 2019 Notes are not convertible as of February 2, 2019. On and after March 15, 2019, until the close of business on the second scheduled trading day immediately preceding the maturity date, holders may convert all or a portion of their 2019 Notes at any time, regardless of the foregoing circumstances. Upon conversion, the 2019 Notes will be settled, at the Company’s election, in cash, shares of the Company’s common stock, or a combination of cash and shares of the Company’s common stock. If the Company has not delivered a notice of its election of settlement method prior to the final conversion period it will be deemed to have elected combination settlement with the specified dollar amount of $1,000.
111
The Company may not redeem the 2019 Notes; however, upon the occurrence of a fundamental change (as defined in the indenture governing the notes), holders may require the Company to purchase all or a portion of their 2019 Notes for cash at a price equal to 100% of the principal amount of the 2019 Notes to be purchased plus any accrued and unpaid special interest to, but excluding, the fundamental change purchase date.
Under GAAP, certain convertible debt instruments that may be settled in cash on conversion are required to be separately accounted for as liability and equity components of the instrument in a manner that reflects the issuer’s non-convertible debt borrowing rate. Accordingly, in accounting for the issuance of the 2019 Notes, the Company separated the 2019 Notes into liability and equity components. The carrying amount of the liability component was calculated by measuring the fair value of a similar liability that does not have an associated convertible feature. The carrying amount of the equity component, which is recognized as a debt discount, represents the difference between the proceeds from the issuance of the 2019 Notes and the fair value of the liability component of the 2019 Notes. The debt discount will be amortized to interest expense using an effective interest rate of 4.51% over the expected life of the 2019 Notes. The equity component is not remeasured as long as it continues to meet the conditions for equity classification.
In accounting for the debt issuance costs related to the issuance of the 2019 Notes, the Company allocated the total amount incurred to the liability and equity components based on their relative values. Debt issuance costs attributable to the liability component are amortized to interest expense using the effective interest method over the expected life of the 2019 Notes, and debt issuance costs attributable to the equity component are netted with the equity component in stockholders’ equity (deficit).
Debt issuance costs related to the 2019 Notes were comprised of discounts and commissions payable to the initial purchasers of $4.4 million and third party offering costs of $1.0 million. Discounts, commissions payable to the initial purchasers and third party offering costs attributable to the liability component were recorded as a contra-liability and are presented net against the convertible senior notes balance on the consolidated balance sheets. The Company recorded $0.9 million, $0.9 million and $0.8 million related to the amortization of debt issuance costs in fiscal 2018, fiscal 2017 and fiscal 2016, respectively, related to the 2019 Notes.
The carrying values of the 2019 Notes, excluding the discounts and commissions payable to the initial purchasers and third party offering costs, are as follows (in thousands):
|
|
|
February 2, |
|
|
February 3, |
|
||
|
|
|
2019 |
|
|
2018 |
|
||
|
Liability component |
|
|
|
|
|
|
|
|
|
Principal |
|
$ |
350,000 |
|
|
$ |
350,000 |
|
|
Less: Debt discount |
|
|
(5,854 |
) |
|
|
(20,988 |
) |
|
Net carrying amount |
|
$ |
344,146 |
|
|
$ |
329,012 |
|
|
Equity component (1) |
|
$ |
70,482 |
|
|
$ |
70,482 |
|
|
(1) |
Included in additional paid-in capital on the consolidated balance sheets. |
The Company recorded interest expense of $15.1 million, $14.5 million and $13.8 million for the amortization of the debt discount related to the 2019 Notes in fiscal 2018, fiscal 2017 and fiscal 2016, respectively.
2019 Notes—Convertible Bond Hedge and Warrant Transactions
In connection with the offering of the 2019 Notes, the Company entered into convertible note hedge transactions whereby the Company has the option to purchase a total of approximately 3.0 million shares of its common stock at a price of approximately $116.09 per share. The total cost of the convertible note hedge transactions was $73.3 million. In addition, the Company sold warrants whereby the holders of the warrants have the option to purchase a total of approximately 3.0 million shares of the Company’s common stock at a price of $171.98 per share. The warrants contain certain adjustment mechanisms whereby the total number of shares to be purchased under such warrants may be increased up to a cap of 6.0 million shares of common stock (which cap may also be subject to adjustment). The Company received $40.4 million in cash proceeds from the sale of these warrants. Taken together, the purchase of the convertible note hedges and sale of the warrants are intended to offset any actual dilution from the conversion of the 2019 Notes and to effectively increase the overall conversion price from $116.09 per share to $171.98 per share. As these transactions meet certain accounting criteria, the convertible note hedges and warrants are recorded in stockholders’ equity (deficit), are not accounted for as derivatives and are not remeasured each reporting period. The net costs incurred in connection with the convertible note hedge and warrant transactions were recorded as a reduction to additional paid-in capital on the consolidated balance sheets.
112
The Company recorded a deferred tax liability of $27.5 million in connection with the debt discount associated with the 2019 Notes and recorded a deferred tax asset of $28.6 million in connection with the convertible note hedge transactions. The deferred tax liability and deferred tax assets are included in non-current deferred tax assets on the consolidated balance sheets.
The provision for income taxes in fiscal 2017 included $0.1 million of income tax expense as a result of the Tax Act for the provisional re-measurement of the deferred tax asset and liability related to the 2019 Notes for the reduction in the U.S. corporate income tax rate from 35% to 21%.
NOTE 11—CREDIT FACILITIES
The outstanding balances under the Company’s credit facilities were as follows (in thousands):
|
|
|
February 2, |
|
|
February 3, |
|
||||||||||||||||||
|
|
|
2019 |
|
|
2018 |
|
||||||||||||||||||
|
|
|
Outstanding |
|
|
Unamortized Debt |
|
|
Net Carrying |
|
|
Outstanding |
|
|
Unamortized Debt |
|
|
Net Carrying |
|
||||||
|
|
|
Amount |
|
|
Issuance Costs |
|
|
Amount |
|
|
Amount |
|
|
Issuance Costs |
|
|
Amount |
|
||||||
|
Asset based credit facility |
|
$ |
57,500 |
|
|
$ |
— |
|
|
$ |
57,500 |
|
|
$ |
199,970 |
|
|
$ |
— |
|
|
$ |
199,970 |
|
|
LILO term loan |
|
|
— |
|
|
|
— |
|
|
|
— |
|
|
|
80,000 |
|
|
|
(501 |
) |
|
|
79,499 |
|
|
Total credit facilities |
|
$ |
57,500 |
|
|
$ |
— |
|
|
$ |
57,500 |
|
|
$ |
279,970 |
|
|
$ |
(501 |
) |
|
$ |
279,469 |
|
Asset Based Credit Facility & LILO Term Loan
In August 2011, Restoration Hardware, Inc., along with its Canadian subsidiary, Restoration Hardware Canada, Inc., entered into a credit agreement with Bank of America, N.A., as administrative agent, and certain other lenders.
On June 28, 2017, Restoration Hardware, Inc. entered into an eleventh amended and restated credit agreement among Restoration Hardware, Inc., Restoration Hardware Canada, Inc., various subsidiaries of RH named therein as borrowers or guarantors, the lenders party thereto and Bank of America, N.A. as administrative agent and collateral agent (the “credit agreement”). The credit agreement has a revolving line of credit with availability of up to $600.0 million, of which $10.0 million is available to Restoration Hardware Canada, Inc., and includes a $200.0 million accordion feature under which the revolving line of credit may be expanded by agreement of the parties from $600.0 million to up to $800 million if and to the extent the lenders revise their credit commitments to encompass a larger facility. In addition, the credit agreement establishes an $80.0 million LILO term loan facility.
The Company incurred $3.9 million of deferred financing fees related to the credit agreement, which are included in other non-current assets on the consolidated balance sheets, and will be amortized on a straight line basis over the life of the revolving line of credit, which has a maturity date of June 28, 2022. As a result of the credit agreement, unamortized deferred financing fees of $0.1 million related to the previous facility were expensed during fiscal 2017 and $1.1 million related to the previous facility will be amortized over the life of the new revolving line of credit.
In June 2018, the Company repaid the LILO term loan in full. As a result of the repayment, the Company incurred a $0.5 million loss on extinguishment of debt in fiscal 2018, which represents the acceleration of amortization of debt issuance costs. The Company did not incur any prepayment penalties upon the early extinguishment of the LILO term loan.
On June 12, 2018, Restoration Hardware, Inc. entered into a First Amendment (the “First Amendment”) to credit agreement. The First Amendment (i) changes the credit agreement’s definition of “Eligible In-Transit Inventory” to clarify the requirements to be fulfilled by the borrowers with respect to such in-transit inventory, and (ii) clarifies that no Default or Event of Default was caused by any prior non-compliance with such requirements with respect to in-transit inventory. Eligible In-Transit Inventory consists of inventory being shipped from vendor locations outside of the United States. Qualifying in-transit inventory is included within the Company’s borrowing base for eligible collateral for purposes of determining the amount of borrowing available to borrowers under the credit agreement.
On November 23, 2018, Restoration Hardware, Inc. entered into a Consent and Second Amendment (the “Second Amendment”) to the credit agreement. The Second Amendment includes certain clarifying changes to among other things: (a) address the processing of payments from insurance proceeds in connection with casualty or other insured losses with respect to property or assets of a Loan Party, and (b) add an additional category of permitted restricted payment to allow the lead borrower to make annual restricted payments of up to $3 million per fiscal year to cover payments of certain administrative and other obligations of RH in the ordinary course of business.
113
The availability of credit at any given time under the credit agreement is limited by reference to a borrowing base formula based upon numerous factors, including the value of eligible inventory and eligible accounts receivable. As a result of the borrowing base formula, actual borrowing availability under the revolving line of credit could be less than the stated amount of the revolving line of credit (as reduced by the actual borrowings and outstanding letters of credit under the revolving line of credit). All obligations under the credit agreement are secured by substantially all of the assets, including accounts receivable, inventory, intangible assets, property, equipment, goods and fixtures of Restoration Hardware, Inc., Restoration Hardware Canada, Inc., RH US, LLC, Waterworks Operating Co., LLC and Waterworks IP Co., LLC.
Borrowings under the revolving line of credit are subject to interest, at the borrowers’ option, at either the bank’s reference rate or LIBOR (or, in the case of the revolving line of credit, the Bank of America “BA” Rate or the Canadian Prime Rate, as such terms are defined in the credit agreement, for Canadian borrowings denominated in Canadian dollars or the United States Index Rate or LIBOR for Canadian borrowings denominated in United States dollars) plus an applicable margin rate, in each case.
The credit agreement contains various restrictive covenants, including, among others, limitations on the ability to incur liens, make loans or other investments, incur additional debt, issue additional equity, merge or consolidate with or into another person, sell assets, pay dividends or make other distributions, or enter into transactions with affiliates, along with other restrictions and limitations typical to credit agreements of this type and size. As of February 2, 2019, Restoration Hardware, Inc. was in compliance with all applicable covenants of the credit agreement.
In addition, under the credit agreement, the Company is required to meet specified financial ratios in order to undertake certain actions, and the Company may be required to maintain certain levels of excess availability or meet a specified consolidated fixed-charge coverage ratio (“FCCR”). The trigger for the FCCR occurs if the domestic availability under the revolving line of credit is less than the greater of (i) $40.0 million and (ii) 10% of the sum of (a) the lesser of (x) the aggregate revolving commitments under the credit agreement and (y) the aggregate revolving borrowing base, plus (b) the lesser of (x) the then outstanding amount of the LILO term loan or (y) the LILO term loan borrowing base. If the availability under the credit agreement is less than the foregoing amount, then Restoration Hardware, Inc. is required to maintain an FCCR of at least one to one.
The credit agreement requires a daily sweep of all cash receipts and collections to prepay the loans under the agreement while (i) an event of default exists or (ii) the availability under the revolving line of credit for extensions of credit is less than the greater of (A) $40.0 million and (B) 10% of the sum of (a) the lesser of (x) the aggregate revolving commitments under the credit agreement and (y) the aggregate revolving borrowing base, plus (b) the lesser of (x) the then outstanding amount of the LILO term loan or (y) the LILO term loan borrowing base.
As of February 2, 2019, Restoration Hardware, Inc. had $57.5 million in outstanding borrowings and $378.9 million of availability under the revolving line of credit, net of $13.6 million in outstanding letters of credit. As a result of the consolidated FCCR restriction that limits the last 10% of borrowing availability, actual incremental borrowing available to the Company and the other affiliated parties under the revolving line of credit was approximately $333.9 million as of February 2, 2019.
Second Lien Credit Agreement
On July 7, 2017, Restoration Hardware, Inc., a wholly-owned subsidiary of RH, entered into a credit agreement (the “second lien credit agreement”), dated as of July 7, 2017, among Restoration Hardware, Inc., as lead borrower, the guarantors party thereto, the lenders party thereto, each of whom are funds and accounts managed or advised by Apollo Capital Management, L.P., and its affiliated investment managers, and Wilmington Trust, National Association as administrative agent and collateral agent with respect to an initial term loan in an aggregate principal amount equal to $100.0 million with a maturity date of January 7, 2023 (the “second lien term loan”). The Company incurred $3.6 million of debt issuance costs related to the second lien credit agreement. The second lien term loan of $100.0 million was repaid in full on October 10, 2017. As a result of the repayment, the Company incurred a $4.9 million loss on extinguishment of debt in fiscal 2017, which includes a prepayment penalty of $3.0 million and acceleration of amortization of debt issuance costs of $1.9 million.
The second lien term loan bore interest at an annual rate generally based on LIBOR plus 8.25%. This rate was a floating rate that reset periodically based upon changes in LIBOR rates during the life of the second lien term loan. At the date of borrowing, the rate was set at one month LIBOR plus 8.25%.
114
All obligations under the second lien term loan were secured by a second lien security interest in assets of the loan parties including inventory, receivables and certain types of intellectual property. The second lien security interest was granted with respect to substantially the same collateral that secures the credit agreement. The second lien ranked junior in priority and is subordinated to the first lien in favor of the lenders with respect to the credit agreement.
The second lien credit agreement contained various restrictive and affirmative covenants generally in line with the covenants and restrictions contained in the credit agreement including required financial reporting, limitations on the ability to incur liens, make loans or other investments, incur additional debt, make certain restricted payments, or enter into transactions with affiliates, along with other restrictions and limitations typical to credit agreements of this type and size.
The second lien credit agreement also contained a financial ratio covenant not found in the credit agreement based upon a senior secured leverage ratio of consolidated secured debt to consolidated earnings before interest, taxes, depreciation and amortization (“EBITDA”).
The second lien credit agreement also contained a consolidated fixed charge coverage ratio generally based on the same formulation set forth in the credit agreement such that the borrower may not make certain “restricted payments” in the event that certain ratios were not met and contained certain events of default and other customary terms and conditions for a second lien credit agreement.
Intercreditor Agreement
On July 7, 2017, in connection with the second lien credit agreement, Restoration Hardware, Inc. entered into an intercreditor agreement (the “intercreditor agreement”) with the administrative agent and collateral agent under the credit agreement and the administrative agent and collateral agent under the second lien credit agreement. The intercreditor agreement established various customary inter-lender terms, including, without limitation, with respect to priority of liens, permitted actions by each party, application of proceeds, exercise of remedies in case of default, releases of liens and certain limitations on the amendment of the credit agreement and the second lien credit agreement without the consent of the other party. The intercreditor agreement was terminated upon repayment of the second lien term loan on October 10, 2017.
NOTE 12—FAIR VALUE OF FINANCIAL INSTRUMENTS
Financial Assets and Liabilities
Certain financial assets and liabilities are required to be carried at fair value. Fair value is the price that would be received to sell an asset, or paid to transfer a liability, in an orderly transaction between market participants at the measurement date. In determining the fair value, the Company utilizes market data or assumptions that it believes market participants would use in pricing the asset or liability, which would maximize the use of observable inputs and minimize the use of unobservable inputs to the extent possible, including assumptions about risk and the risks inherent in the inputs of the valuation technique.
The degree of judgment used in measuring the fair value of financial instruments generally correlates to the level of pricing observability. Pricing observability is impacted by a number of factors, including the type of financial instrument, whether the financial instrument is new to the market and not yet established and the characteristics specific to the transaction. Financial instruments with readily available active quoted prices for which fair value can be measured generally will have a higher degree of pricing observability and a lesser degree of judgment used in measuring fair value. Conversely, financial instruments rarely traded or not quoted will generally have less, or no, pricing observability and a higher degree of judgment used in measuring fair value.
The Company’s financial assets and liabilities measured and reported at fair value are classified and disclosed in one of the following categories:
|
|
• |
Level 1—Quoted prices are available in active markets for identical investments as of the reporting date. |
|
|
• |
Level 2—Pricing inputs are other than quoted prices in active markets, which are either directly or indirectly observable as of the reporting date, and fair value is determined through the use of models or other valuation methodologies. |
|
|
• |
Level 3—Pricing inputs are unobservable for the investment and include situations where there is little, if any, market activity for the investment. The inputs used in the determination of fair value require significant management judgment or estimation. |
A financial instrument’s categorization within the fair value hierarchy is based upon the lowest level of input that is significant to the fair value measurement.
115
Amounts reported as cash and equivalents, receivables, and accounts payable and accrued expenses approximate fair value due to the short-term nature of activity within these accounts. The estimated fair value of the asset based credit facility approximates cost as the interest rate associated with the facility is variable and resets frequently. The estimated fair value and carrying value of the 2019 Notes, 2020 Notes and 2023 Notes were as follows (in thousands):
|
|
|
February 2, |
|
|
February 3, |
|
||||||||||
|
|
|
2019 |
|
|
2018 |
|
||||||||||
|
|
|
Fair Value |
|
|
Carrying Value (1) |
|
|
Fair Value |
|
|
Carrying Value (1) |
|
||||
|
Convertible senior notes due 2019 |
|
$ |
334,756 |
|
|
$ |
344,146 |
|
|
$ |
324,866 |
|
|
$ |
329,012 |
|
|
Convertible senior notes due 2020 |
|
|
260,258 |
|
|
|
272,919 |
|
|
|
261,047 |
|
|
|
255,865 |
|
|
Convertible senior notes due 2023 |
|
|
230,684 |
|
|
|
253,689 |
|
|
|
— |
|
|
|
— |
|
|
(1) |
Carrying value represents the principal amount less the equity component of the 2019 Notes, 2020 Notes and 2023 Notes classified in stockholders’ equity (deficit), and does not exclude the discounts upon original issuance, discounts and commissions payable to the initial purchasers and third party offering costs, as applicable. |
The fair value of each of the 2019 Notes, 2020 Notes and 2023 Notes was determined based on inputs that are observable in the market or that could be derived from, or corroborated with, observable market data, including the trading price of the Company’s convertible notes, when available, the Company’s stock price and interest rates based on similar debt issued by parties with credit ratings similar to the Company (Level 2).
Nonfinancial Assets and Liabilities
The fair value of the Waterworks reporting unit was determined based on unobservable (Level 3) inputs and valuation techniques, as discussed in “Impairment” within Note 3—Significant Accounting Policies.
NOTE 13—INCOME TAXES
The United States enacted the Tax Cuts and Jobs Act (the “Tax Act”) on December 22, 2017, which had a significant impact to the Company’s provision for income taxes as of and for the years ended February 2, 2019 and February 3, 2018. The Tax Act included a number of changes to existing U.S. tax laws that impact the Company, including the reduction of the U.S. corporate income tax rate from 35% to 21% for tax years beginning after December 31, 2017. The Tax Act transitions U.S. international taxation from a worldwide system to a modified territorial system and includes base erosion prevention measures on non-U.S. earnings, which has the effect of subjecting certain earnings of the Company's foreign subsidiaries to U.S. taxation. The Tax Act provided for a one-time transition tax on indefinitely reinvested foreign earnings, as well as prospective changes which impacted the Company beginning in fiscal 2018, including the elimination of certain domestic deductions, additional limitations on executive compensation deductions and taxation of global intangible low-taxed income (“GILTI”).
The Company recognized the estimated income tax effects of the Tax Act in its fiscal 2017 financial statements in accordance with Staff Accounting Bulletin No. 118—Income Tax Accounting Implications of the TCJA (“SAB 118”), which provides SEC staff guidance for the application of ASC Topic 740—Income Taxes, in the reporting period in which the Tax Act was signed into law. As of February 2, 2019, the Company has completed its accounting for the tax effects of enactment of the Tax Act. The changes to U.S. tax laws as a result of the Tax Act, which had the most significant impact on the Company’s provision for income taxes are as follows:
Reduction of the U.S. Corporate Income Tax Rate
The Company measures deferred tax assets and liabilities using enacted tax rates that will apply in the years in which the temporary differences are expected to be recovered or paid. Accordingly, the Company’s deferred tax assets and liabilities were re-measured to reflect the reduction in the U.S. corporate income tax rate from 35% to 21%, resulting in a provisional $6.0 million increase in income tax expense for the year ended February 3, 2018 and a corresponding provisional $6.0 million decrease in net deferred tax assets as of February 3, 2018. The Company completed the accounting for re-measurement of its deferred tax assets and liabilities as of February 2, 2019, and recorded $0.5 million to income tax expense and a corresponding $0.5 million decrease in net deferred tax assets as of February 2, 2019. The cumulative impact to the Company’s provision for income tax expense in fiscal year 2017 and 2018 for the re-measurement of the Company’s deferred tax assets and liabilities as result of the Tax Act was $6.5 million.
116
Transition Tax on Foreign Earnings
The Company recognized a provisional income tax expense of $1.0 million for the year ended February 3, 2018 related to the one-time transition tax on indefinitely reinvested foreign earnings. The Company completed its computation of transition tax liability in 2018 and did not recognize additional income tax expense or benefit for the year ended February 2, 2019. The cumulative impact to the Company’s provision for income tax expense for the one-time transition tax on indefinitely reinvested foreign earnings as result of the Tax Act was $1.0 million.
Global Intangible Low-Taxed Income
The Tax Act subjects a U.S. shareholder to tax on GILTI earned by certain foreign subsidiaries. The FASB Staff Q&A, Topic 740, No. 5, Accounting for Global Intangible Low-Taxed Income, states that an entity can make an accounting policy election to either recognize deferred taxes for temporary basis differences expected to reverse as GILTI in future years or to provide for the tax expense related to GILTI in the year the tax is incurred as a period expense. Due to the fact that the Company was still evaluating the GILTI provisions as of February 3, 2018, no GILTI-related deferred amounts were recorded in fiscal 2017. After further consideration in fiscal 2018, the Company has elected to account for GILTI as a period cost in the year the tax is incurred, which did not have an impact on the Company’s fiscal 2018 results.
The following is a summary of the income before income taxes (in thousands):
|
|
|
Year Ended |
|
|||||||||
|
|
|
February 2, |
|
|
February 3, |
|
|
January 28, |
|
|||
|
|
|
2019 |
|
|
2018 |
|
|
2017 |
|
|||
|
Domestic |
|
$ |
178,016 |
|
|
$ |
28,859 |
|
|
$ |
8,370 |
|
|
Foreign |
|
|
3,137 |
|
|
|
1,292 |
|
|
|
184 |
|
|
Total income before income taxes |
|
$ |
181,153 |
|
|
$ |
30,151 |
|
|
$ |
8,554 |
|
The following is a summary of the income tax expense (benefit) (in thousands):
|
|
|
Year Ended |
|
|||||||||
|
|
|
February 2, |
|
|
February 3, |
|
|
January 28, |
|
|||
|
|
|
2019 |
|
|
2018 |
|
|
2017 |
|
|||
|
Current |
|
|
|
|
|
|
|
|
|
|
|
|
|
Federal |
|
$ |
24,012 |
|
|
$ |
18,593 |
|
|
$ |
751 |
|
|
State |
|
|
6,275 |
|
|
|
2,761 |
|
|
|
2,410 |
|
|
Foreign |
|
|
1,270 |
|
|
|
933 |
|
|
|
694 |
|
|
Total current tax expense |
|
|
31,557 |
|
|
|
22,287 |
|
|
|
3,855 |
|
|
Deferred |
|
|
|
|
|
|
|
|
|
|
|
|
|
Federal |
|
|
(465 |
) |
|
|
6,042 |
|
|
|
2,109 |
|
|
State |
|
|
(731 |
) |
|
|
(355 |
) |
|
|
(2,414 |
) |
|
Foreign |
|
|
153 |
|
|
|
(3 |
) |
|
|
(397 |
) |
|
Total deferred tax expense (benefit) |
|
|
(1,043 |
) |
|
|
5,684 |
|
|
|
(702 |
) |
|
Total income tax expense |
|
$ |
30,514 |
|
|
$ |
27,971 |
|
|
$ |
3,153 |
|
117
A reconciliation of the federal statutory tax rate to the Company’s effective tax rate is as follows:
|
|
|
Year Ended |
|
|||||||||
|
|
|
February 2, |
|
|
February 3, |
|
|
January 28, |
|
|||
|
|
|
2019 |
|
|
2018 |
|
|
2017 |
|
|||
|
Provision at federal statutory tax rate |
|
|
21.0 |
% |
|
|
33.7 |
% |
|
|
35.0 |
% |
|
State income taxes—net of federal tax impact |
|
|
2.1 |
|
|
|
4.8 |
|
|
|
4.8 |
|
|
Goodwill impairment |
|
|
1.6 |
|
|
|
17.9 |
|
|
|
— |
|
|
Valuation allowance |
|
|
0.3 |
|
|
|
1.1 |
|
|
|
0.9 |
|
|
Meals and entertainment |
|
|
0.2 |
|
|
|
1.5 |
|
|
|
5.0 |
|
|
Other permanent items |
|
|
0.2 |
|
|
|
1.3 |
|
|
|
2.8 |
|
|
Aircraft expenses |
|
|
0.1 |
|
|
|
3.6 |
|
|
|
3.3 |
|
|
Tax rate adjustments |
|
|
0.1 |
|
|
|
(0.6 |
) |
|
|
(5.8 |
) |
|
Stock compensation—excess benefits |
|
|
(8.8 |
) |
|
|
(20.9 |
) |
|
|
— |
|
|
Non-deductible stock-based compensation |
|
|
— |
|
|
|
26.7 |
|
|
|
— |
|
|
Federal statutory tax rate change |
|
|
— |
|
|
|
20.1 |
|
|
|
— |
|
|
Foreign income inclusion—transition tax |
|
|
— |
|
|
|
3.3 |
|
|
|
— |
|
|
Net adjustments to tax accruals and other |
|
|
— |
|
|
|
1.4 |
|
|
|
1.2 |
|
|
Foreign income |
|
|
— |
|
|
|
(0.9 |
) |
|
|
(4.2 |
) |
|
Donation of appreciated property |
|
|
— |
|
|
|
(0.2 |
) |
|
|
(8.7 |
) |
|
Transaction costs |
|
|
— |
|
|
|
— |
|
|
|
2.6 |
|
|
Effective tax rate |
|
|
16.8 |
% |
|
|
92.8 |
% |
|
|
36.9 |
% |
Significant components of the Company’s deferred tax assets and liabilities are as follows (in thousands):
|
|
|
February 2, |
|
|
February 3, |
|
||
|
|
|
2019 |
|
|
2018 |
|
||
|
Non-current deferred tax assets (liabilities) |
|
|
|
|
|
|
|
|
|
Stock-based compensation |
|
$ |
22,721 |
|
|
$ |
25,047 |
|
|
Deferred lease credits |
|
|
20,900 |
|
|
|
18,355 |
|
|
Accrued expense |
|
|
16,657 |
|
|
|
10,488 |
|
|
Inventory |
|
|
14,735 |
|
|
|
16,132 |
|
|
Net operating loss carryforwards |
|
|
1,654 |
|
|
|
1,584 |
|
|
Property and equipment |
|
|
(27,583 |
) |
|
|
(21,869 |
) |
|
Tradenames, trademarks and intangibles |
|
|
(12,386 |
) |
|
|
(14,991 |
) |
|
Prepaid expense and other |
|
|
(4,209 |
) |
|
|
(12,379 |
) |
|
State tax benefit |
|
|
(2,250 |
) |
|
|
(2,394 |
) |
|
Convertible senior notes |
|
|
(1,054 |
) |
|
|
(1,890 |
) |
|
Deferred revenue |
|
|
(152 |
) |
|
|
3,313 |
|
|
Other |
|
|
2,618 |
|
|
|
3,105 |
|
|
Non-current deferred tax assets |
|
|
31,651 |
|
|
|
24,501 |
|
|
Valuation allowance |
|
|
(1,618 |
) |
|
|
(1,190 |
) |
|
Net non-current deferred tax assets |
|
$ |
30,033 |
|
|
$ |
23,311 |
|
A reconciliation of the valuation allowance is as follows (in thousands):
|
|
|
Year Ended |
|
|||||||||
|
|
|
February 2, |
|
|
February 3, |
|
|
January 28, |
|
|||
|
|
|
2019 |
|
|
2018 |
|
|
2017 |
|
|||
|
Balance at beginning of fiscal year |
|
$ |
1,190 |
|
|
$ |
760 |
|
|
$ |
158 |
|
|
Net changes in deferred tax assets and liabilities |
|
|
428 |
|
|
|
430 |
|
|
|
602 |
|
|
Balance at end of fiscal year |
|
$ |
1,618 |
|
|
$ |
1,190 |
|
|
$ |
760 |
|
The Company has recorded deferred tax assets and liabilities based upon estimates of their realizable value, such estimates are based upon likely future tax consequences. In assessing the need for a valuation allowance, the Company considers both positive and
118
negative evidence related to the likelihood of realization of the deferred tax assets. If, based on the weight of available evidence, it is more likely than not that the deferred tax assets will not be realized, the Company records a valuation allowance.
As of February 2, 2019 and February 3, 2018, the Company had $1.6 million and $1.2 million, respectively, in valuation allowances against deferred tax assets in certain state and foreign jurisdictions due to historical losses.
As of February 2, 2019, the Company had state net operating loss carryovers of $4.0 million and foreign net operating loss carryovers of $7.7 million. The state net operating loss carryovers will begin to expire in 2022, and the foreign net operating loss carryovers have an indefinite carryforward. Internal Revenue Code Section 382 and similar state rules place a limitation on the amount of taxable income which can be offset by net operating loss carryforwards after a change in ownership (generally greater than 50% change in ownership). The Company cannot give any assurances that it will not undergo an ownership change in the future resulting in further limitations on utilization of net operating losses.
A reconciliation of the exposures related to unrecognized tax benefits is as follows (in thousands):
|
|
|
Year Ended |
|
|||||||||
|
|
|
February 2, |
|
|
February 3, |
|
|
January 28, |
|
|||
|
|
|
2019 |
|
|
2018 |
|
|
2017 |
|
|||
|
Balance at beginning of fiscal year |
|
$ |
8,152 |
|
|
$ |
2,190 |
|
|
$ |
921 |
|
|
Gross increases—prior period tax positions |
|
|
239 |
|
|
|
5,491 |
|
|
|
53 |
|
|
Gross increases—current period tax positions |
|
|
375 |
|
|
|
471 |
|
|
|
1,216 |
|
|
Lapses in statute of limitations |
|
|
(307 |
) |
|
|
— |
|
|
|
— |
|
|
Balance at end of fiscal year |
|
$ |
8,459 |
|
|
$ |
8,152 |
|
|
$ |
2,190 |
|
As of February 2, 2019, the Company has $8.5 million of unrecognized tax benefits, of which $7.3 million would reduce income tax expense and the effective tax rate, if recognized. The remaining unrecognized tax benefits would offset other deferred tax assets, if recognized. In October 2017, the Company filed an amended federal tax return claiming a $5.4 million refund, however, no income tax benefit was recorded during fiscal 2017 or fiscal 2018 given the technical nature and amount of the refund claim. An income tax benefit related to this refund claim could be recorded in a future period upon settlement with the respective taxing authority. As of February 2, 2019, the Company has $0.4 million of exposures related to unrecognized tax benefits that are expected to decrease in the next 12 months.
The Company accounts for interest and penalties related to exposures as a component of income tax expense. The Company had interest accruals of $0.5 million associated with exposures as of both February 2, 2019, and February 3, 2018, respectively.
The Company is subject to taxation in the United States and various states and foreign jurisdictions. As of February 2, 2019, the Company is subject to examination by the tax authorities for fiscal 2014 through fiscal 2017. With few exceptions, as of February 2, 2019, the Company is no longer subject to U.S. federal, state, local, or foreign examinations by tax authorities for years before fiscal 2014.
NOTE 14—NET INCOME PER SHARE
The weighted-average shares used for net income per share are presented in the table below.
|
|
|
Year Ended |
|
|||||||||
|
|
|
February 2, |
|
|
February 3, |
|
|
January 28, |
|
|||
|
|
|
2019 |
|
|
2018 |
|
|
2017 |
|
|||
|
Weighted-average shares—basic |
|
|
21,613,678 |
|
|
|
27,053,616 |
|
|
|
40,691,483 |
|
|
Effect of dilutive stock-based awards |
|
|
4,567,303 |
|
|
|
2,199,592 |
|
|
|
235,357 |
|
|
Effect of dilutive convertible senior notes (1) |
|
|
352,244 |
|
|
|
— |
|
|
|
— |
|
|
Weighted-average shares—diluted |
|
|
26,533,225 |
|
|
|
29,253,208 |
|
|
|
40,926,840 |
|
|
(1) |
The 2019 Notes, 2020 Notes and 2023 Notes have an impact on the Company’s dilutive share count beginning at stock prices of $116.09 per share, $118.13 per share and $193.65 per share, respectively. |
119
The following number of options and restricted stock units were excluded from the calculation of diluted net income per share because their inclusion would have been anti-dilutive:
|
|
|
Year Ended |
|
|||||||||
|
|
|
February 2, |
|
|
February 3, |
|
|
January 28, |
|
|||
|
|
|
2019 |
|
|
2018 |
|
|
2017 |
|
|||
|
Options |
|
|
351,145 |
|
|
|
2,895,471 |
|
|
|
7,243,697 |
|
|
Restricted stock units |
|
|
2,625 |
|
|
|
229,308 |
|
|
|
609,676 |
|
|
Total anti-dilutive stock-based awards |
|
|
353,770 |
|
|
|
3,124,779 |
|
|
|
7,853,373 |
|
NOTE 15—SHARE REPURCHASES AND SHARE RETIREMENTS
Fiscal 2018 $700 Million Share Repurchase Program
On October 10, 2018, the Company’s Board of Directors authorized a share repurchase program of up to $700 million (the “Fiscal 2018 $700 Million Repurchase Program”). Under the Fiscal 2018 $700 Million Repurchase Program, the Company repurchased approximately 2.0 million shares of its common stock at an average price of $122.10 per share, for an aggregate repurchase amount of approximately $250 million, during fiscal 2018. As of February 2, 2019, there was $450 million available under the Fiscal 2018 $700 Million Repurchase Program. In March 2019, the Board of Directors replenished the amount of such repurchase program to the original amount of $700 million.
Fiscal 2017 $700 Million Share Repurchase Program
On May 2, 2017, the Company’s Board of Directors authorized a share repurchase program of up to $700 million (the “Fiscal 2017 $700 Million Repurchase Program”). Under the Fiscal 2017 $700 Million Repurchase Program, the Company repurchased approximately 12.4 million shares of its common stock at an average price of $56.60 per share, for an aggregate repurchase amount of approximately $700 million, during the three months ended July 29, 2017. As the Fiscal 2017 $700 Million Repurchase Program was completed during the three months ended July 29, 2017, there will be no repurchases in future periods under this repurchase authorization.
Fiscal 2017 $300 Million Share Repurchase Program
On February 21, 2017, the Company’s Board of Directors authorized a share repurchase program of up to $300 million (the “Fiscal 2017 $300 Million Repurchase Program”). Under the Fiscal 2017 $300 Million Repurchase Program, the Company repurchased approximately 7.8 million shares of its common stock at an average price of $38.24 per share, for an aggregate repurchase amount of approximately $300 million, during the three months ended April 29, 2017. As the Fiscal 2017 $300 Million Repurchase Program was completed during the three months ended April 29, 2017, there will be no repurchases in future periods under this repurchase authorization.
Share Repurchases Under Equity Plans
As of February 2, 2019 and February 3, 2018, the aggregate unpaid principal amount of the notes payable for share repurchases of $19.6 million and $19.4 million, respectively. As of February 2, 2019, $0.9 million and $18.7 million were included in other current liabilities and other non-current obligations on the consolidated balance sheets. As of February 3, 2018, $19.4 million was included in other non-current obligations. The Company recorded interest expense on the outstanding notes of $1.0 million in each of fiscal 2018, fiscal 2017 and fiscal 2016.
Of the $19.6 million and $19.4 million notes payable for share repurchases outstanding as of February 2, 2019 and February 3, 2018, respectively, $15.5 million was due to a current board member of the Company.
Share Retirements
In fiscal 2018, the Company retired 22,267,711 shares of its common stock related to shares it had repurchased under the Fiscal 2017 $300 Million Repurchase Program, Fiscal 2017 $700 Million Repurchase Program and Fiscal 2018 $700 Million Repurchase Program. As a result of this retirement, the Company reclassified a total of $1,250.3 million from treasury stock, of which $591.5 million was allocated to additional paid-in capital and $658.8 million was allocated to retained earnings (accumulated deficit) on the consolidated balance sheets and consolidated statements of shareholders’ equity (deficit) as of February 2, 2019. There was no impact on the consolidated statements of income or cash flows related to this share retirement activity.
120
In fiscal 2017, the Company retired 294,888 shares of its common stock related to shares it had repurchased under the Company’s equity plans. As a result of this retirement, the Company reclassified a total of $19.5 million from treasury stock, all of which was allocated to additional paid-in capital on the consolidated balance sheets and consolidated statements of shareholders’ equity (deficit) as of February 3, 2018. There was no impact on the consolidated statements of income or cash flows related to this share retirement activity.
NOTE 16—STOCK-BASED COMPENSATION
The Company estimates the value of equity grants based upon an OPM and recognizes this estimated value as compensation expense over the vesting periods. The Company recognizes expense associated with performance-based awards when it becomes probable that the performance condition will be met. Once it becomes probable that an award will vest, the Company recognizes compensation expense equal to the number of shares which are probable to vest multiplied by the fair value of the related shares measured at the grant date.
Stock-based compensation expense is included in selling, general and administrative expenses on the consolidated statements of income. The Company recorded stock-based compensation expense of $24.0 million, $50.7 million and $29.2 million in fiscal 2018, fiscal 2017 and fiscal 2016, respectively. No stock-based compensation cost has been capitalized in the accompanying consolidated financial statements.
2012 Stock Incentive Plan and 2012 Stock Option Plan
The Restoration Hardware 2012 Stock Incentive Plan (the “Stock Incentive Plan”) was adopted on November 1, 2012. The Stock Incentive Plan provides for the grant of incentive stock options to the Company’s employees, non-qualified stock options, stock appreciation rights, restricted stock, restricted stock units, dividend equivalent rights, cash-based awards and any combination thereof to the Company’s employees, directors and consultants and the Company’s parent and subsidiary corporations’ employees, directors and consultants.
The Restoration Hardware 2012 Stock Option Plan (the “Option Plan”) was adopted on November 1, 2012 and on such date 6,829,041 fully vested options were granted under this plan to certain of the Company’s employees and advisors. Aside from these options granted on November 1, 2012, no other awards will be granted under the Option Plan.
As of February 3, 2018, there were a total of 495,653 shares issuable under the Stock Incentive Plan. On February 5, 2018, an additional 430,347 shares became issuable under the Stock Incentive Plan in accordance with the Stock Incentive Plan evergreen provision, increasing the total number of shares issuable under the Stock Incentive Plan to 926,000. Awards under the plans reduce the number of shares available for future issuance. Cancellations and forfeitures of awards previously granted under the Stock Incentive Plan increase the number of shares available for future issuance. Cancellations and forfeitures of awards previously granted under the Option Plan are immediately retired and are no longer available for future issuance.
The number of shares available for future issuance under the Stock Incentive Plan as of February 2, 2019 was 1,419,552. Shares issued as a result of award exercises under the Stock Incentive Plan and Option Plan will be funded with the issuance of new shares. On February 4, 2019, an additional 409,556 shares became issuable under the Stock Incentive Plan in accordance with the Stock Incentive Plan evergreen provision.
2012 Stock Incentive Plan and 2012 Stock Option Plan—Stock Options
A summary of stock option activity under the Stock Incentive Plan and the Option Plan for fiscal 2018 is as follows:
|
|
|
Options |
|
|
Weighted-Average Exercise Price |
|
||
|
Outstanding—February 3, 2018 |
|
|
8,616,578 |
|
|
$ |
50.31 |
|
|
Granted |
|
|
428,350 |
|
|
|
123.13 |
|
|
Exercised |
|
|
(882,272 |
) |
|
|
49.90 |
|
|
Cancelled |
|
|
(663,240 |
) |
|
|
51.91 |
|
|
Outstanding—February 2, 2019 |
|
|
7,499,416 |
|
|
$ |
54.37 |
|
121
The fair value of stock options issued was estimated on the date of grant using the following assumptions:
|
|
|
Year Ended |
|
|||||||||
|
|
|
February 2, |
|
|
February 3, |
|
|
January 28, |
|
|||
|
|
|
2019 |
|
|
2018 |
|
|
2017 |
|
|||
|
Expected volatility |
|
|
54.7 |
% |
|
|
48.3 |
% |
|
|
44.9 |
% |
|
Expected life (years) |
|
|
6.7 |
|
|
|
9.3 |
|
|
|
6.5 |
|
|
Risk-free interest rate |
|
|
2.9 |
% |
|
|
2.2 |
% |
|
|
1.4 |
% |
|
Dividend yield |
|
|
— |
|
|
|
— |
|
|
|
— |
|
A summary of additional information about stock options is as follows:
|
|
|
Year Ended |
|
|||||||||
|
|
|
February 2, |
|
|
February 3, |
|
|
January 28, |
|
|||
|
|
|
2019 |
|
|
2018 |
|
|
2017 |
|
|||
|
Weighted-average fair value per share of stock options granted |
|
$ |
69.60 |
|
|
$ |
24.24 |
|
|
$ |
15.88 |
|
|
Aggregate intrinsic value of stock options exercised (in thousands) |
|
|
77,311 |
|
|
|
27,362 |
|
|
|
1,238 |
|
|
Fair value of stock options vested (in thousands) |
|
|
13,915 |
|
|
|
38,402 |
|
|
|
13,726 |
|
Information about stock options outstanding, vested or expected to vest, and exercisable as of February 2, 2019 is as follows:
|
|
|
Options Outstanding |
|
|
Options Exercisable |
|
||||||||||||||
|
Range of Exercise Prices |
|
Number of Options |
|
|
Weighted- Average Remaining Contractual Life (in years) |
|
|
Weighted- Average Exercise Price |
|
|
Number of Options |
|
|
Weighted- Average Exercise Price |
|
|||||
|
$25.39 - $44.52 |
|
|
1,541,706 |
|
|
|
6.83 |
|
|
$ |
34.54 |
|
|
|
583,526 |
|
|
$ |
33.17 |
|
|
$45.21 - $45.82 |
|
|
29,540 |
|
|
|
8.56 |
|
|
|
45.23 |
|
|
|
4,140 |
|
|
|
45.24 |
|
|
$46.50 - $46.50 |
|
|
2,976,826 |
|
|
|
3.74 |
|
|
|
46.50 |
|
|
|
2,976,826 |
|
|
|
46.50 |
|
|
$47.53 - $61.30 |
|
|
1,331,277 |
|
|
|
7.58 |
|
|
|
52.69 |
|
|
|
1,216,457 |
|
|
|
51.99 |
|
|
$64.65 - $90.92 |
|
|
1,219,817 |
|
|
|
4.77 |
|
|
|
77.54 |
|
|
|
1,089,780 |
|
|
|
76.52 |
|
|
$91.69 - $159.00 |
|
|
400,250 |
|
|
|
8.94 |
|
|
|
124.97 |
|
|
|
27,650 |
|
|
|
93.63 |
|
|
Total |
|
|
7,499,416 |
|
|
|
5.52 |
|
|
$ |
54.37 |
|
|
|
5,898,379 |
|
|
$ |
52.08 |
|
|
Vested or expected to vest |
|
|
6,988,863 |
|
|
|
5.34 |
|
|
$ |
52.86 |
|
|
|
|
|
|
|
|
|
The aggregate intrinsic value of options outstanding, options vested or expected to vest, and options exercisable as of February 2, 2019 was $597.3 million, $565.9 million, and $481.1 million, respectively. Stock options exercisable as of February 2, 2019 had a weighted-average remaining contractual life of 5.02 years.
The Company recorded stock-based compensation expense for stock options of $13.6 million, $37.5 million and $16.3 million in fiscal 2018, fiscal 2017 and fiscal 2016, respectively. The fiscal 2017 expense of $37.5 million includes the $23.9 million of expense associated with the option grant to Mr. Friedman in May 2017. Refer to Chairman and Chief Executive Officer Option Grant below. As of February 2, 2019, the total unrecognized compensation expense related to unvested options was $22.0 million, which is expected to be recognized on a straight-line basis over a weighted-average period of 2.62 years.
122
2012 Stock Incentive Plan—Restricted Stock Awards
The Company grants restricted stock awards, which include restricted stock and restricted stock units, to its employees and members of its Board of Directors. A summary of restricted stock award activity for fiscal 2018 is as follows:
|
|
|
Awards |
|
|
Weighted- Average Grant Date Fair Value |
|
|
Intrinsic Value |
|
|||
|
Outstanding—February 3, 2018 |
|
|
802,713 |
|
|
$ |
52.65 |
|
|
|
|
|
|
Granted |
|
|
12,005 |
|
|
|
111.38 |
|
|
|
|
|
|
Released |
|
|
(194,974 |
) |
|
|
58.87 |
|
|
|
|
|
|
Cancelled |
|
|
(204,275 |
) |
|
|
50.68 |
|
|
|
|
|
|
Outstanding—February 2, 2019 |
|
|
415,469 |
|
|
$ |
52.40 |
|
|
$ |
55,523,277 |
|
A summary of additional information about restricted stock awards is as follows:
|
|
|
Year Ended |
|
|||||||||
|
|
|
February 2, |
|
|
February 3, |
|
|
January 28, |
|
|||
|
|
|
2019 |
|
|
2018 |
|
|
2017 |
|
|||
|
Weighted-average fair value per share of awards granted |
|
$ |
111.38 |
|
|
$ |
55.31 |
|
|
$ |
40.18 |
|
|
Grant date fair value of awards released (in thousands) |
|
|
11,477 |
|
|
|
16,839 |
|
|
|
5,170 |
|
The Company recorded stock-based compensation expense for restricted stock awards of $10.0 million, $12.8 million and $12.6 million in fiscal 2018, fiscal 2017 and fiscal 2016, respectively. As of February 2, 2019, the total unrecognized compensation expense related to unvested restricted stock awards was $10.1 million, which is expected to be recognized on a straight-line basis over a weighted-average period of 2.11 years.
Chairman and Chief Executive Officer Option Grant
On May 2, 2017, the Company’s Board of Directors granted Mr. Friedman an option to purchase 1,000,000 shares of the Company’s common stock with an exercise price equal to $50 per share.
The option contains dual-condition restrictions consisting of both time-based service restrictions over four years and performance-based restrictions linked to achieving the Company’s common stock price objectives of $100, $125 and $150 per share. The option is fully vested on the date of grant but the shares underlying the option remain subject to transfer restrictions to the extent the performance-based and time-based requirements have not been met. The option resulted in a non-cash stock compensation charge of $23.9 million in fiscal 2017, which is included in the $37.5 million stock-based compensation expense for stock options recorded in fiscal 2017 discussed above.
Time-Based Restrictions
The time-based restrictions are measured over an initial four year service period from the date of the award and these restrictions will lapse at the end of each of these first four years at a rate of 250,000 shares per year if (i) Mr. Friedman remains employed at the end of such year, and (ii) the stock price goals have been achieved in such year as described further below.
Performance-Based Restrictions
The stock price objectives are measured each year and are set at prices for the Company’s common stock of $100, $125 and $150 per share. If all three stock price objectives are met in the first performance year, restrictions will lapse as to 250,000 shares in aggregate at the end of such year, with 83,333 shares tied to a $100 price per share, 83,333 shares tied to a $125 price per share and 83,334 shares tied to a $150 price per share.
The same price performance tests are applied in the second year of performance such that restrictions will lapse for an additional 250,000 shares at the end of the second year and then again as to an additional 250,000 shares at the end of each of the third and fourth years so long as Mr. Friedman remains employed at the end of each year.
To the extent that any of the price performance objectives is not reached within one of these first four performance years, the stock price objective can be achieved in any subsequent year until the 8th anniversary of the date of grant.
123
2012 Stock Incentive Plan—Grant to Waterworks Associates
On May 27, 2016, the date of the Company’s acquisition of Waterworks, the Company granted stock options to certain Waterworks associates under the Stock Incentive Plan to purchase 322,784 shares of its common stock, with an exercise price of $33.54 per share, which is equal to the closing price of the Company’s common stock on the date of grant. These options are fully vested as of the date of grant but any shares issued upon exercise of such options will be subject to selling restrictions which are scheduled to lapse in five equal installments on the first, second, third, fourth and fifth anniversaries of the grant date. The fully vested options resulted in a non-cash stock-based compensation charge of $3.7 million in fiscal 2016, which is included in the $16.3 million stock-based compensation expense for stock options recorded in fiscal 2016 discussed above.
Rollover Units
In connection with the acquisition of Waterworks, $1.5 million rollover units in the Waterworks subsidiary (the “Rollover Units”) were recorded as part of the transaction. The Rollover Units are subject to the terms of the Waterworks LLC agreement, including redemption rights at an amount equal to the greater of (i) the $1.5 million remitted as consideration in the business combination or (ii) an amount based on the percentage interest represented in the overall valuation of the Waterworks subsidiary (the “Appreciation Rights”). The Appreciation Rights are measured at fair value and are subject to fair value measurements during the expected life of the Rollover Units, with changes to fair value recorded in the consolidated statements of income. The fair value of the Appreciation Rights is determined based on an OPM. The Company did not record any expense related to the Appreciation Rights during fiscal 2018, fiscal 2017 or fiscal 2016. As of both February 2, 2019 and February 3, 2018, the liability associated with the Rollover Units and related Appreciation Rights was $1.5 million, which is included in other non-current obligations on the consolidated balance sheets.
Profit Interests
In connection with the acquisition of Waterworks, profit interests units in the Waterworks subsidiary (the “Profit Interests”) were issued to certain Waterworks associates. The Profit Interests are measured at their grant date fair value and expensed on a straight-line basis over their expected life, or five years. The Profit Interests are subject to fair value measurements during their expected life, with changes to fair value recorded in the consolidated statements of income. The fair value of the Profit Interests is determined based on an OPM. The Company recorded $0.4 million, $0.4 million and $0.3 million related to the Profit Interests in fiscal 2018, fiscal 2017 and fiscal 2016, respectively, which is included in selling, general and administrative expenses on the consolidated statements of income. As of February 2, 2019 and February 3, 2018, the liability associated with the Profit Interests was $1.1 million and $0.7 million, respectively, which is included in other non-current obligations on the consolidated balance sheets.
NOTE 17—EMPLOYEE BENEFIT PLANS
The Company has a 401(k) plan for its employees who meet certain service and age requirements. Participants may contribute up to 50% of their salaries limited to the maximum allowed by the Internal Revenue Service regulations. The Company, at its discretion, may contribute funds to the 401(k) plan. The Company made no contributions to the 401(k) plan during fiscal 2018, fiscal 2017, or fiscal 2016.
NOTE 18—RELATED PARTY TRANSACTIONS
Aircraft Time Sharing Agreement
On March 29, 2016, Restoration Hardware, Inc., a wholly-owned subsidiary of the Company entered into an Amended and Restated Aircraft Time Sharing Agreement (the “Time Sharing Agreement”) with Gary Friedman, its Chairman and Chief Executive Officer. The Time Sharing Agreement governs use of any of the Company’s aircraft (“Corporate Aircraft”) by Mr. Friedman for personal trips and provides that Mr. Friedman will lease such Corporate Aircraft and pay Restoration Hardware, Inc. an amount equal to the aggregate actual expenses of each personal use flight based on the variable costs of the flight, with the amount of such lease payments not to exceed the maximum payment level established under the Federal Aviation Administration rules. Mr. Friedman maintains a deposit with the Company, to be used towards payment of amounts due under the Time Sharing Agreement. The amount of the deposit is immaterial to the consolidated financial statements.
NOTE 19—COMMITMENTS AND CONTINGENCIES
Leases
The Company leases certain property consisting of retail and outlet stores, corporate offices, distribution centers and equipment. A majority of the Company’s leases expire at various dates through fiscal 2035. The Company has a lease for one Gallery location that
124
expires in fiscal 2058. The stores, distribution centers and corporate office leases generally provide that the Company assumes the maintenance and all or a portion of the property tax obligations on the leased property. Most store leases also provide for minimum annual rent payments, with provisions for additional rent based on a percentage of sales, after meeting certain sales thresholds, and for payment of certain expenses.
The aggregate future minimum rent payments under leases in effect as of February 2, 2019, are as follows (in thousands):
|
Lease agreements accounted for as: |
|
Capital Leases (1) |
|
|
Operating Leases |
|
|
Build-to-Suit |
|
|
Total |
|
||||
|
2019 |
|
$ |
2,042 |
|
|
$ |
83,426 |
|
|
$ |
37,629 |
|
|
$ |
123,097 |
|
|
2020 |
|
|
1,943 |
|
|
|
75,133 |
|
|
|
41,693 |
|
|
|
118,769 |
|
|
2021 |
|
|
1,444 |
|
|
|
62,889 |
|
|
|
45,267 |
|
|
|
109,600 |
|
|
2022 |
|
|
1,267 |
|
|
|
55,654 |
|
|
|
47,744 |
|
|
|
104,665 |
|
|
2023 |
|
|
1,317 |
|
|
|
52,409 |
|
|
|
48,875 |
|
|
|
102,601 |
|
|
Thereafter |
|
|
6,571 |
|
|
|
284,185 |
|
|
|
481,941 |
|
|
|
772,697 |
|
|
Minimum lease commitments |
|
|
14,584 |
|
|
$ |
613,696 |
|
|
$ |
703,149 |
|
|
$ |
1,331,429 |
|
|
Less—amount representing interest |
|
|
(5,790 |
) |
|
|
|
|
|
|
|
|
|
|
|
|
|
Present value of capital lease obligations |
|
|
8,794 |
|
|
|
|
|
|
|
|
|
|
|
|
|
|
Less—current capital lease obligations |
|
|
(1,074 |
) |
|
|
|
|
|
|
|
|
|
|
|
|
|
Non-current capital lease obligations |
|
$ |
7,720 |
|
|
|
|
|
|
|
|
|
|
|
|
|
|
(1) |
The current and non-current capital lease obligations are included in other current liabilities and other non-current obligations, respectively, on the consolidated balance sheets. |
Lease payments that depend on factors that are not measurable at the inception of the lease, such as future sales volume, represent contingent rent expense and are excluded from minimum lease payments and included in the determination of total rent expense when it is probable that the expense has been incurred and the amount is reasonably estimable. Future payments for insurance, real estate taxes and repair and maintenance to which the Company is obligated are excluded from minimum lease payments. Minimum rent payments and contingent rent expense under lease agreements accounted for as operating leases and as build-to-suit lease transactions are as follows (in thousands):
|
|
|
Year Ended |
|
|||||||||
|
|
|
February 2, |
|
|
February 3, |
|
|
January 28, |
|
|||
|
|
|
2019 |
|
|
2018 |
|
|
2017 |
|
|||
|
Lease agreements accounted for as operating leases |
|
|
|
|
|
|
|
|
|
|
|
|
|
Minimum rent |
|
$ |
84,651 |
|
|
$ |
91,152 |
|
|
$ |
87,520 |
|
|
Contingent rent |
|
|
7,023 |
|
|
|
8,063 |
|
|
|
7,140 |
|
|
Total operating leases |
|
$ |
91,674 |
|
|
$ |
99,215 |
|
|
$ |
94,660 |
|
|
Lease agreements accounted for as build-to-suit lease transactions (1) |
|
|
|
|
|
|
|
|
|
|
|
|
|
Minimum rent |
|
$ |
35,465 |
|
|
$ |
32,256 |
|
|
$ |
16,066 |
|
|
Contingent rent |
|
|
1,562 |
|
|
|
833 |
|
|
|
726 |
|
|
Total build-to-suit lease transactions |
|
$ |
37,027 |
|
|
$ |
33,089 |
|
|
$ |
16,792 |
|
|
(1) |
As described in Note 3—Significant Accounting Policies, the cash payments made under leases accounted for as build-to-suit lease transactions are allocated to land rent expense and treated as debt service payments (a portion to interest expense and a portion to financing obligation). Minimum rent payments recognized as interest expense within the consolidated statements of income were $20.3 million, $15.4 million and $12.1 million in fiscal 2018, fiscal 2017 and fiscal 2016, respectively. Minimum rent payments allocated to the financing obligations under build-to-suit lease transactions within the consolidated balance sheets were $7.5 million, $10.2 million and $0.4 million in fiscal 2018, fiscal 2017 and fiscal 2016, respectively. Minimum rent payments allocated to deferred rent amortization was $0.5 million in fiscal 2018. The remaining minimum rent payments of $7.2 million, $6.7 million and $3.6 million in fiscal 2018, fiscal 2017 and fiscal 2016, respectively, represent land rent expense and were included in cost of goods sold on the consolidated statements of income. Contingent rent under build-to-suit lease transactions is recognized as interest expense on the consolidated statements of income. |
In addition to the above, the non-cash rent benefit recognized on the consolidated statements of income was $2.6 million and $1.0 million in fiscal 2018 and fiscal 2017, respectively, and the non-cash rent expense recognized on the consolidated statements of
125
income was $1.2 million in fiscal 2016. Non-cash rent represents the straight-line impact and amortization of tenant allowances under operating leases and land rent expense recorded for build-to-suit lease transactions prior to cash payments occurring under the leases.
Commitments
The Company had no material off balance sheet commitments as of February 2, 2019.
Contingencies
The Company is involved in lawsuits, claims and proceedings incident to the ordinary course of its business. These disputes are increasing in number as the business expands and the Company grows larger. Litigation is inherently unpredictable. As a result, the outcome of matters in which the Company is involved could result in unexpected expenses and liability that could adversely affect the Company’s operations. In addition, any claims against the Company, whether meritorious or not, could be time consuming, result in costly litigation, require significant amounts of management time and result in the diversion of significant operational resources.
The Company reviews the need for any loss contingency reserves and establishes reserves when, in the opinion of management, it is probable that a matter would result in liability, and the amount of loss, if any, can be reasonably estimated. Generally, in view of the inherent difficulty of predicting the outcome of those matters, particularly in cases in which claimants seek substantial or indeterminate damages, it is not possible to determine whether a liability has been incurred or to reasonably estimate the ultimate or minimum amount of that liability until the case is close to resolution, in which case no reserve is established until that time. When and to the extent that the Company does establish a reserve, there can be no assurance that any such recorded liability for estimated losses will be for the appropriate amount, and actual losses could be higher or lower than what the Company accrues from time to time. The Company believes that the ultimate resolution of its current matters will not have a material adverse effect on its consolidated financial statements.
Securities Class Action
On February 2, 2017, City of Miami General Employees’ & Sanitation Employees’ Retirement Trust filed a class action complaint in the United States District Court, Northern District of California, against the Company, Gary Friedman, and Karen Boone. On March 16, 2017, Peter J. Errichiello, Jr. filed a similar class action complaint in the same forum and against the same parties. On April 26, 2017, the court consolidated the two actions. The consolidated action is captioned In re RH, Inc. Securities Litigation. An amended consolidated complaint was filed in June 2017 asserting claims under sections 10(b) and 20(a) of the Securities Exchange Act of 1934, as amended (the “Exchange Act”). The complaint asserts claims purportedly on behalf of a class of purchasers of Company common stock from March 26, 2015 to June 8, 2016. The alleged misstatements relate to statements regarding the roll out of the RH Modern product line and the Company’s inventory levels. The complaint seeks class certification, monetary damages, and other appropriate relief, including an award of costs and attorneys’ fees. On March 21, 2019, the Company and the individual defendants in the case entered into a binding memorandum of understanding to settle the case based on an aggregate settlement amount of $50 million. The memorandum of understanding contemplates that the parties will enter into a settlement agreement, which will be subject to customary conditions including court approval following notice to the Company’s shareholders, and a hearing at which time the court will consider the fairness, reasonableness and adequacy of the settlement. If a settlement is finally approved by the court, it will resolve all of the claims that were or could have been brought in the action. The Company continues to believe that the claims in the lawsuits are without merit and, to the extent the settlement is not finalized the Company would defend against them vigorously. The Company maintains insurance for claims of this nature. As a result of signing the memorandum of understanding and the potential liability becoming probable and estimable, the Company has recorded a provision for legal settlement for $50.0 million within other current liabilities on the consolidated balance sheets as of February 2, 2019. Additionally, the Company has recorded a litigation insurance recovery receivable of $50.0 million as of February 2, 2019 within prepaid expense and other current assets on the consolidated balance sheets, which represents the estimated insurance claims proceeds from the Company’s insurance carriers.
Shareholder Derivative Lawsuit
On April 24, 2018, purported Company shareholder David Magnani filed a purported shareholder derivative suit in the United States District Court, Northern District of California, captioned Magnani v. Friedman et al. (No. 18-cv-02452). On June 29, 2018, Hosrof Izmirliyan filed a similar purported shareholder derivative complaint in the same forum, captioned Izmirliyan v. Friedman et al. (No. 18-cv-03930). On July 29, 2018, the court consolidated both derivative actions, and the consolidated action is captioned In re RH Shareholder Derivative Litigation. On August 24, 2018, plaintiffs filed an amended complaint that names RH as a nominal defendant and Gary Friedman, Karen Boone, Carlos Alberini, Keith Belling, Eri Chaya, Mark Demilio, Katie Mitic, Ali Rowghani and Leonard Schlesinger as defendants. The allegations substantially track those in the securities class action described above. Plaintiffs bring claims against all individual defendants under Section 14(a) of the Exchange Act, as well as claims for breach of fiduciary duty, unjust enrichment, and waste of corporate assets. The plaintiffs also allege insider trading and misappropriation of
126
information claims against two of the individual defendants. The amended complaint seeks monetary damages, corporate governance changes, restitution, and an award of costs and attorneys’ fees. The Company believes that plaintiffs lack standing to bring this derivative action. On September 28, 2018, the Company filed a motion to stay proceedings and a motion to dismiss the consolidated complaint. On January 23, 2019, the court granted the motion to stay the case.
NOTE 20—SEGMENT REPORTING
The Company defines reportable and operating segments on the same basis that it uses to evaluate performance internally by the CODM. The Company has determined that the Chief Executive Officer is its CODM. As of February 2, 2019, the Company had two operating segments: RH Segment and Waterworks. The two operating segments include all sales channels accessed by the Company’s customers, including sales through catalogs, websites, stores and the commercial channel.
The Company’s two operating segments are strategic business units that offer products for the home furnishings customer. While RH Segment and Waterworks have a shared management team and customer base, the Company has determined that their results cannot be aggregated as they do not share similar economic characteristics, as well as due to other quantitative factors.
The Company uses operating income to evaluate segment profitability. Operating income is defined as net income before interest expense—net, goodwill and tradename impairment, loss on extinguishment of debt and income tax expense.
Prior to the Waterworks acquisition, the Company had one reportable segment. As the Company’s acquisition of Waterworks was completed on May 27, 2016, reportable segment financial information for Waterworks below represents thirty-five weeks of results for fiscal 2016, whereas the RH Segment results represent fifty-two weeks for fiscal 2016. The results for fiscal 2017 include fifty-three weeks for both the RH Segment and Waterworks and the results for fiscal 2018 include fifty-two weeks for both the RH Segment and Waterworks.
Segment Information
The following table presents the statements of income metrics reviewed by the CODM to evaluate performance internally or as required under ASC 280—Segment Reporting (in thousands):
|
|
|
Year Ended |
|
|||||||||||||||||||||||||||||||||
|
|
|
February 2, |
|
|
February 3, |
|
|
January 28, |
|
|||||||||||||||||||||||||||
|
|
|
2019 |
|
|
2018 |
|
|
2017 |
|
|||||||||||||||||||||||||||
|
|
|
RH Segment |
|
|
Waterworks |
|
|
Total |
|
|
RH Segment |
|
|
Waterworks |
|
|
Total |
|
|
RH Segment |
|
|
Waterworks |
|
|
Total |
|
|||||||||
|
Net revenues |
|
$ |
2,375,472 |
|
|
$ |
130,181 |
|
|
$ |
2,505,653 |
|
|
$ |
2,319,332 |
|
|
$ |
120,842 |
|
|
$ |
2,440,174 |
|
|
$ |
2,060,044 |
|
|
$ |
74,827 |
|
|
$ |
2,134,871 |
|
|
Gross profit |
|
|
949,307 |
|
|
|
51,540 |
|
|
|
1,000,847 |
|
|
|
801,999 |
|
|
|
47,068 |
|
|
|
849,067 |
|
|
|
656,191 |
|
|
|
23,596 |
|
|
|
679,787 |
|
|
Depreciation and amortization |
|
|
69,608 |
|
|
|
4,738 |
|
|
|
74,346 |
|
|
|
65,666 |
|
|
|
4,469 |
|
|
|
70,135 |
|
|
|
54,480 |
|
|
|
2,515 |
|
|
|
56,995 |
|
The following table presents the balance sheet metrics as required under ASC 280—Segment Reporting (in thousands):
|
|
|
February 2, |
|
|
February 3, |
|
||||||||||||||||||
|
|
|
2019 |
|
|
2018 |
|
||||||||||||||||||
|
|
|
RH Segment |
|
|
Waterworks |
|
|
Total |
|
|
RH Segment |
|
|
Waterworks |
|
|
Total |
|
||||||
|
Goodwill (1) |
|
$ |
124,379 |
|
|
$ |
— |
|
|
$ |
124,379 |
|
|
$ |
124,448 |
|
|
$ |
17,445 |
|
|
$ |
141,893 |
|
|
Tradenames, trademarks and domain names (2) |
|
|
48,563 |
|
|
|
37,459 |
|
|
|
86,022 |
|
|
|
48,563 |
|
|
|
52,100 |
|
|
|
100,663 |
|
|
Total assets |
|
|
1,707,101 |
|
|
|
98,933 |
|
|
|
1,806,034 |
|
|
|
1,608,290 |
|
|
|
124,576 |
|
|
|
1,732,866 |
|
|
(1) |
The Waterworks reporting unit goodwill is presented net of an impairment charge of $51.1 million, of which $17.4 million was recorded in fiscal 2018 and $33.7 million was recorded in fiscal 2017. |
|
(2) |
The Waterworks reporting unit tradename is presented net of an impairment charge of $14.6 million recorded in fiscal 2018. |
The Company uses segment operating income to evaluate segment performance and allocate resources. Segment operating income excludes (i) severance costs associated with a reorganizations, including the closures of distribution centers and the Dallas customer call center as part of the Company’s supply chain reorganization, (ii) asset impairments and lease losses, (iii) disposals of inventory and property and equipment, lease related charges, inventory transfer costs and other costs and adjustments associated with distribution center closures, (iv) product recall accruals and adjustments, (v) non-cash amortization of the inventory fair value adjustment recorded in connection with the acquisition of Waterworks, (vi) a favorable legal settlement, net of legal expenses, (vii) a non-cash compensation charge related to a fully vested option grant made to Mr. Friedman in May 2017, (viii) the release of the
127
remaining reserve for potential claims regarding anti-dumping duties which the Company believes have lapsed, (ix) the gain on sale of building and land for one of the Company’s previously owned retail galleries, (x) charges incurred for the estimated cumulative impact of coupons redeemed in connection with a legal claim, (xi) impairment recorded due to the Company committing to a plan to sell its aircraft and (xii) costs incurred in connection with the acquisition of Waterworks including professional fees. These items are excluded from segment operating income in order to provide better transparency of segment operating results. Accordingly, these items are not presented by segment because they are excluded from the segment profitability measure that management reviews.
The following table presents segment operating income (loss) and consolidated income before income taxes (in thousands):
|
|
|
Year Ended |
|
|||||||||
|
|
|
February 2, |
|
|
February 3, |
|
|
January 28 |
|
|||
|
|
|
2019 |
|
|
2018 |
|
|
2017 |
|
|||
|
Operating income: |
|
|
|
|
|
|
|
|
|
|
|
|
|
RH Segment |
|
$ |
306,068 |
|
|
$ |
173,414 |
|
|
$ |
105,274 |
|
|
Waterworks |
|
|
(1,155 |
) |
|
|
(2,116 |
) |
|
|
(2,360 |
) |
|
Reorganization related costs |
|
|
(9,977 |
) |
|
|
(949 |
) |
|
|
(5,698 |
) |
|
Asset impairments and lease losses |
|
|
(7,218 |
) |
|
|
(4,417 |
) |
|
|
(12,743 |
) |
|
Distribution center closures |
|
|
(1,778 |
) |
|
|
(4,846 |
) |
|
|
— |
|
|
Recall accrual |
|
|
(1,619 |
) |
|
|
(7,707 |
) |
|
|
(4,615 |
) |
|
Impact of inventory step-up |
|
|
(380 |
) |
|
|
(2,527 |
) |
|
|
(6,835 |
) |
|
Legal settlement |
|
|
5,289 |
|
|
|
— |
|
|
|
— |
|
|
Non-cash compensation |
|
|
— |
|
|
|
(23,872 |
) |
|
|
(3,672 |
) |
|
Anti-dumping exposure |
|
|
— |
|
|
|
2,202 |
|
|
|
— |
|
|
Gain on sale of building and land |
|
|
— |
|
|
|
2,119 |
|
|
|
— |
|
|
Legal claim |
|
|
— |
|
|
|
— |
|
|
|
(8,701 |
) |
|
Aircraft impairment |
|
|
— |
|
|
|
— |
|
|
|
(4,767 |
) |
|
Acquisition related costs |
|
|
— |
|
|
|
— |
|
|
|
(2,847 |
) |
|
Income from operations |
|
|
289,230 |
|
|
|
131,301 |
|
|
|
53,036 |
|
|
Interest expense—net |
|
|
75,074 |
|
|
|
62,570 |
|
|
|
44,482 |
|
|
Goodwill and tradename impairment |
|
|
32,086 |
|
|
|
33,700 |
|
|
|
— |
|
|
Loss on extinguishment of debt |
|
|
917 |
|
|
|
4,880 |
|
|
|
— |
|
|
Income before income taxes |
|
$ |
181,153 |
|
|
$ |
30,151 |
|
|
$ |
8,554 |
|
The Company classifies its sales into furniture and non-furniture product lines. Furniture includes both indoor and outdoor furniture. Non-furniture includes lighting, textiles, fittings, fixtures, surfaces, accessories and home décor. Net revenues in each category were as follows (in thousands):
|
|
|
Year Ended |
|
|||||||||
|
|
|
February 2, |
|
|
February 3, |
|
|
January 28, |
|
|||
|
|
|
2019 |
|
|
2018 |
|
|
2017 |
|
|||
|
Furniture |
|
$ |
1,625,553 |
|
|
$ |
1,543,404 |
|
|
$ |
1,334,526 |
|
|
Non-furniture |
|
|
880,100 |
|
|
|
896,770 |
|
|
|
800,345 |
|
|
Total net revenues |
|
$ |
2,505,653 |
|
|
$ |
2,440,174 |
|
|
$ |
2,134,871 |
|
The Company is domiciled in the United States and primarily operates its retail and outlet stores in the United States. As of February 2, 2019, the Company operates 4 retail and 2 outlet stores in Canada and 1 retail store in the U.K. Revenues from Canadian and U.K. operations, and the long-lived assets in Canada and the U.K., are not material to the Company. Canada and U.K. geographic revenues are based upon revenues recognized at the retail store locations in the respective country.
No single customer accounted for more than 10% of the Company’s revenues in fiscal 2018, fiscal 2017 or fiscal 2016.
NOTE 21—SUBSEQUENT EVENT
On March 21, 2019, the Company entered into a binding memorandum of understanding to settle the securities class action case based on an aggregate settlement amount of $50 million. Refer to “Securities Class Action” within Note 19—Commitments and Contingencies. The memorandum of understanding contemplates that the parties will enter into a settlement agreement, which will be subject to customary conditions including court approval following notice to the Company’s shareholders, and a hearing at which time
128
the court will consider the fairness, reasonableness and adequacy of the settlement. If a settlement is finally approved by the court, it will resolve all of the claims that were or could have been brought in the action. The Company maintains insurance for claims of this nature. As a result of signing the memorandum of understanding and the potential liability becoming probable and estimable, the Company has recorded a litigation insurance recovery receivable of $50.0 million within prepaid expense and other current assets on the consolidated balance sheets as of February 2, 2019, which represents the estimated insurance claims proceeds from the Company’s insurance carriers, and a provision for legal settlement of $50.0 million within other current liabilities on the consolidated balance sheets as of February 2, 2019.
NOTE 22—SELECTED QUARTERLY FINANCIAL DATA (UNAUDITED)
Quarterly financial data for fiscal 2018 and fiscal 2017 are set forth below (in thousands, except share and per share amounts):
|
|
|
Three Months Ended |
|
|||||||||||||
|
|
|
May 5, |
|
|
August 4, |
|
|
November 3, |
|
|
February 2, |
|
||||
|
Fiscal 2018 |
|
2018 |
|
|
2018 |
|
|
2018 |
|
|
2019 |
|
||||
|
Net revenues |
|
$ |
557,406 |
|
|
$ |
640,798 |
|
|
$ |
636,558 |
|
|
$ |
670,891 |
|
|
Gross profit |
|
|
212,035 |
|
|
|
271,600 |
|
|
|
254,511 |
|
|
|
262,701 |
|
|
Net income |
|
|
28,059 |
|
|
|
64,042 |
|
|
|
22,411 |
|
|
|
36,127 |
|
|
Weighted-average shares used in computing basic net income per share |
|
|
21,545,025 |
|
|
|
21,925,702 |
|
|
|
22,082,141 |
|
|
|
20,901,841 |
|
|
Basic net income per share |
|
$ |
1.30 |
|
|
$ |
2.92 |
|
|
$ |
1.01 |
|
|
$ |
1.73 |
|
|
Weighted-average shares used in computing diluted net income per share |
|
|
25,230,228 |
|
|
|
27,496,561 |
|
|
|
27,703,319 |
|
|
|
25,702,791 |
|
|
Diluted net income per share |
|
$ |
1.11 |
|
|
$ |
2.33 |
|
|
$ |
0.81 |
|
|
$ |
1.41 |
|
|
|
|
Three Months Ended |
|
|||||||||||||
|
|
|
April 29, |
|
|
July 29, |
|
|
October 28, |
|
|
February 3, |
|
||||
|
Fiscal 2017 |
|
2017 |
|
|
2017 |
|
|
2017 |
|
|
2018 |
|
||||
|
Net revenues |
|
$ |
562,080 |
|
|
$ |
615,326 |
|
|
$ |
592,473 |
|
|
$ |
670,295 |
|
|
Gross profit |
|
|
170,256 |
|
|
|
205,813 |
|
|
|
214,325 |
|
|
|
258,673 |
|
|
Net income (loss) |
|
|
(3,370 |
) |
|
|
(7,862 |
) |
|
|
13,151 |
|
|
|
261 |
|
|
Weighted-average shares used in computing basic net income (loss) per share |
|
|
37,609,516 |
|
|
|
28,398,307 |
|
|
|
21,221,848 |
|
|
|
21,418,283 |
|
|
Basic net income (loss) per share |
|
$ |
(0.09 |
) |
|
$ |
(0.28 |
) |
|
$ |
0.62 |
|
|
$ |
0.01 |
|
|
Weighted-average shares used in computing diluted net income (loss) per share |
|
|
37,609,516 |
|
|
|
28,398,307 |
|
|
|
23,535,617 |
|
|
|
25,666,174 |
|
|
Diluted net income (loss) per share |
|
$ |
(0.09 |
) |
|
$ |
(0.28 |
) |
|
$ |
0.56 |
|
|
$ |
0.01 |
|
129
None.
Evaluation of Disclosure Controls and Procedures
Our management, with the participation of our Chief Executive Officer and President, Chief Financial and Administrative Officer, evaluated the effectiveness of our disclosure controls and procedures (as defined in Rule 13a-15(e) under the Securities Exchange Act of 1934, as amended) as of the end of the period covered by this annual report. Based on that evaluation, our Chief Executive Officer and President, Chief Financial and Administrative Officer have concluded that as of the end of the period covered by this report our disclosure controls and procedures were effective to provide reasonable assurance that information required to be disclosed by us in reports that we file or submit under the Securities Exchange Act of 1934, as amended, is recorded, processed, summarized and reported within the time periods specified in the SEC’s rules and forms, and include controls and procedures designed to ensure that the information required to be disclosed by us in such reports is accumulated and communicated to our management, including our Chief Executive Officer and President, Chief Financial and Administrative Officer, as appropriate, to allow timely decisions regarding required disclosures.
Management’s Report on Internal Control Over Financial Reporting
Our management is responsible for establishing and maintaining adequate internal control over financial reporting, as defined in Exchange Act Rule 13a-15(f). Management conducted an assessment of our internal control over financial reporting as of February 2, 2019 based on the framework established by the Committee of Sponsoring Organizations of the Treadway Commission in Internal Control—Integrated Framework (2013). Based on the assessment, management concluded that our internal control over financial reporting was effective as of February 2, 2019. The effectiveness of the Company’s internal control over financial reporting as of February 2, 2019 has been audited by PricewaterhouseCoopers LLP, an independent registered public accounting firm, as stated in their report which is included herein.
Changes in Internal Control Over Financial Reporting
There were no changes in our internal control over financial reporting that occurred during our most recent fiscal quarter that has materially affected, or are reasonably likely to materially affect, our internal control over financial reporting. During fiscal year 2018, we implemented key system functionality and modified our internal controls to ensure we adequately assessed the impact of the new accounting standard related to leases which is effective in the first fiscal quarter of 2019.
Limitations on Effectiveness of Controls and Procedures and Internal Control over Financial Reporting
In designing and evaluating the disclosure controls and procedures and internal control over financial reporting, management recognizes that any controls and procedures, no matter how well designed and operated, can provide only reasonable assurance of achieving the desired control objectives. In addition, the design of disclosure controls and procedures and internal control over financial reporting must reflect the fact that there are resource constraints and that management is required to apply judgment in evaluating the benefits of possible controls and procedures relative to their costs.
Appointment of Chief Financial Officer and Chief Accounting Officer
As previously disclosed on a Current Report on Form 8-K filed by the Company on March 5, 2019, effective immediately after the filing of this Annual Report on Form 10-K, Ryno Blignaut’s resignation as President, Chief Financial and Administrative Officer, including his role of Principal Financial Officer and Principal Accounting Officer will become effective. In connection with Mr. Blignaut stepping down, the Board of Directors has appointed effective immediately after the filing of this Annual Report on Form 10-K (i) Jack Preston as Chief Financial Officer and Principal Financial Officer of the Company and (ii) Glenda Citragno as Chief Accounting Officer and Principal Accounting Officer of the Company. As previously reported, Mr. Blignaut has indicated to RH that his resignation (i) is not the result of any dispute or disagreement with RH’s accounting principles or practices or financial statements and disclosures, and (ii) is motivated by personal reasons related to health considerations.
Jack Preston, age 44, serves as our Chief Financial Officer and leads all financial functions including strategic and financial planning, accounting, treasury, tax, internal audit and investor relations across the Company’s multiple businesses and brands. Mr.
130
Preston served as RH’s Senior Vice President, Finance and Chief Strategy Officer from August 2014 to March 2019, and Senior Vice President, Finance and Strategy from April 2013 to August 2014. Prior to RH, Mr. Preston worked for Bank of America Merrill Lynch for over 12 years, where he most recently served as a director in the consumer and retail investment banking group. Mr. Preston holds a bachelor of commerce degree from the Sauder School of Business at the University of British Columbia.
Glenda Citragno, age 54, serves as our Senior Vice President and Chief Accounting Officer, and leads the technical accounting matters for the company including SEC reporting, accounting, enterprise systems and tax. Ms. Citragno joined RH in July of 2012. Ms. Citragno has over 30 years of professional accounting and finance experience with prior roles with Art.com, ZANTAZ, ADP, ProBusiness Services Inc. and VeriFone, Inc. Ms. Citragno worked as an auditor for the public accounting firm Ernst & Young, LLP and is a Certified Public Accountant. Ms. Citragno holds a B.A. in Business Economics with an emphasis in Accounting from the University of California, Santa Barbara.
In connection with the appointment of Mr. Preston as Chief Financial Officer, the Company has entered into a Compensation Protection Agreement with Mr. Preston, the form of which is filed as Exhibit 10.11 to this Annual Report on Form 10-K. The Compensation Protection Agreement provides generally that, in the event of termination of such officer’s employment by the Company without “Cause” or in the event of termination of employment by such officer for “Good Reason” (as such terms are defined in the Compensation Protection Agreement), the Company would pay severance in an amount equal to base salary compensation for a compensation protection period of 12 months after employment termination so long as such officer does not engage in certain restricted activities during such time period. The Compensation Projection Agreement also provides for the payment of a prior year bonus or a pro rata amount of current year bonus based on the date of employment termination and the Company achieving the performance metrics in any such bonus arrangement and the payment of certain costs related to COBRA benefits during such compensation protection period. The foregoing is only a summary of the material terms of the Compensation Protection Agreement and does not purport to be complete, and is qualified in its entirety by reference to the form of Compensation Protection Agreement, the form of which is filed as Exhibit 10.11 to this Annual Report on Form 10-K and is incorporated by reference herein.
No family relationship exists between either Mr. Preston or Ms. Citragno and any of RH’s directors or executive officers.
There are no related-party transactions in which Mr. Preston or any of his immediate family members or Ms. Citragno or any of her immediate family members has an interest that would require disclosure under Item 404(a) of Regulation S-K.
Fiscal 2018 $700 Million Share Repurchase Program
In October 2018, our Board of Directors authorized a share repurchase program in an aggregate amount of $700 million of which (x) $250.0 million in share repurchases were completed in fiscal 2018, and (y) the $700 million authorization amount was replenished by the Board of Directors in March 2019.
131
The information required by this item will be contained in our definitive Proxy Statement for the 2019 Annual Meeting of Stockholders (the “Proxy Statement”) and is incorporated herein by reference.
The information required by this item will be contained in our Proxy Statement and is incorporated herein by reference.
|
Item 12. |
Security Ownership of Certain Beneficial Owners and Management and Related Stockholder Matters |
The information required by this item will be contained in our Proxy Statement and is incorporated herein by reference.
The information required by this item will be contained in our Proxy Statement and is incorporated herein by reference.
The information required by this item will be contained in our Proxy Statement and is incorporated herein by reference.
132
|
|
(a) |
The following documents are filed as part of this Annual Report on Form 10-K: |
|
|
1. |
Consolidated Financial Statements |
The following financial statements are included in Part II, Item 8 of this Annual Report on Form 10-K:
|
|
• |
Report of Independent Registered Public Accounting Firm on Consolidated Financial Statements |
|
|
• |
Consolidated Balance Sheets as of February 2, 2019 and February 3, 2018 |
|
|
• |
Consolidated Statements of Income for the fiscal years ended February 2, 2019, February 3, 2018 and January 28, 2017 |
|
|
• |
Consolidated Statements of Comprehensive Income for the fiscal years ended February 2, 2019, February 3, 2018 and January 28, 2017 |
|
|
• |
Consolidated Statements of Stockholders’ Equity (Deficit) for the fiscal years ended February 2, 2019, February 3, 2018 and January 28, 2017 |
|
|
• |
Consolidated Statements of Cash Flows for the fiscal years ended February 2, 2019, February 3, 2018 and January 28, 2017 |
|
|
• |
Notes to the Consolidated Financial Statements |
|
|
2. |
Financial Statement Schedules |
Separate financial statement schedules have been omitted either because they are not applicable or because the required information is included in the consolidated financial statements or notes described in Item 15(a)(1) above.
|
|
3. |
Exhibits |
The Exhibits listed in the Index to Exhibits, which appears immediately before the signature page and is incorporated herein by reference, are filed or incorporated by reference as part of this Annual Report on Form 10-K.
The Company has elected not to include summary information.
133
|
|
|
|
|
|
|
Incorporated by Reference |
|
|
|
|
||
|
Exhibit Number |
|
Exhibit Description |
|
Form |
|
File Number |
|
Date of First Filing |
|
Exhibit Number |
|
Filed Herewith |
|
|
|
|
|
|
|
|
|
|
|
|
|
|
|
3.1 |
|
|
10-K |
|
001-35720 |
|
March 29, 2017 |
|
3.1 |
|
|
|
|
|
|
|
|
|
|
|
|
|
|
|
|
|
|
3.2 |
|
|
8-K |
|
001-35720 |
|
March 3, 2017 |
|
3.1 |
|
|
|
|
|
|
|
|
|
|
|
|
|
|
|
|
|
|
4.1 |
|
|
10-K |
|
001-35720 |
|
March 29, 2017 |
|
4.1 |
|
|
|
|
|
|
|
|
|
|
|
|
|
|
|
|
|
|
4.2 |
|
|
8-K |
|
001-35720 |
|
June 24, 2014 |
|
4.1 |
|
|
|
|
|
|
|
|
|
|
|
|
|
|
|
|
|
|
4.3 |
|
|
8-K |
|
001-35720 |
|
June 24, 2015 |
|
4.1 |
|
|
|
|
|
|
|
|
|
|
|
|
|
|
|
|
|
|
4.4 |
|
|
8-K |
|
001-35720 |
|
June 19, 2018 |
|
4.1 |
|
|
|
|
|
|
|
|
|
|
|
|
|
|
|
|
|
|
4.5 |
|
|
10-Q |
|
001-35720 |
|
September 5, 2018 |
|
4.2 |
|
|
|
|
|
|
|
|
|
|
|
|
|
|
|
|
|
|
10.1 |
|
|
S-1/A |
|
333-176767 |
|
October 23, 2012 |
|
10.4 |
|
|
|
|
|
|
|
|
|
|
|
|
|
|
|
|
|
|
10.2* |
|
|
8-K |
|
001-35720 |
|
July 3, 2013 |
|
10.1 |
|
|
|
|
|
|
|
|
|
|
|
|
|
|
|
|
|
|
10.3* |
|
|
10-K |
|
001-35720 |
|
April 29, 2013 |
|
10.9 |
|
|
|
|
|
|
|
|
|
|
|
|
|
|
|
|
|
|
10.4* |
|
|
S-8 |
|
333-184716 |
|
November 2, 2012 |
|
4.2 |
|
|
|
|
|
|
|
|
|
|
|
|
|
|
|
|
|
|
10.5* |
|
|
S-8 |
|
333-184716 |
|
November 2, 2012 |
|
4.3 |
|
|
|
|
|
|
|
|
|
|
|
|
|
|
|
|
|
|
10.6* |
|
|
S-8 |
|
333-184716 |
|
November 2, 2012 |
|
4.4 |
|
|
|
|
|
|
|
|
|
|
|
|
|
|
|
|
|
|
10.7* |
|
|
10-Q |
|
001-35720 |
|
December 17, 2013 |
|
10.2 |
|
|
|
|
|
|
|
|
|
|
|
|
|
|
|
|
|
|
10.8* |
|
|
10-K |
|
001-35720 |
|
March 31, 2014 |
|
10.17 |
|
|
|
|
|
|
|
|
|
|
|
|
|
|
|
|
|
|
10.9* |
|
Notice of Stock Option Award and Stock Option Award Agreement by and between RH and Gary Friedman. |
|
8-K |
|
001-35720 |
|
May 3, 2017 |
|
10.1 |
|
|
134
|
|
|
|
|
|
|
Incorporated by Reference |
|
|
|
|
||
|
Exhibit Number |
|
Exhibit Description |
|
Form |
|
File Number |
|
Date of First Filing |
|
Exhibit Number |
|
Filed Herewith |
|
|
|
|
|
|
|
|
|
|
|
|
|
|
|
10.10* |
|
|
10-Q |
|
001-35720 |
|
September 9, 2017 |
|
10.2 |
|
|
|
|
|
|
|
|
|
|
|
|
|
|
|
|
|
|
10.11* |
|
Form of Compensation Protection Agreement for Section 16 Presidents. |
|
10-K |
|
001-35720 |
|
March 29, 2018 |
|
10.11 |
|
|
|
|
|
|
|
|
|
|
|
|
|
|
|
|
|
10.12 |
|
|
8-K |
|
001-35720 |
|
June 24, 2014 |
|
10.1 |
|
|
|
|
|
|
|
|
|
|
|
|
|
|
|
|
|
|
10.13 |
|
|
8-K |
|
001-35720 |
|
June 24, 2014 |
|
10.2 |
|
|
|
|
|
|
|
|
|
|
|
|
|
|
|
|
|
|
10.14 |
|
|
8-K |
|
001-35720 |
|
June 24, 2014 |
|
10.3 |
|
|
|
|
|
|
|
|
|
|
|
|
|
|
|
|
|
|
10.15 |
|
|
8-K |
|
001-35720 |
|
June 24, 2014 |
|
10.4 |
|
|
|
|
|
|
|
|
|
|
|
|
|
|
|
|
|
|
10.16 |
|
|
8-K |
|
001-35720 |
|
June 24, 2015 |
|
10.1 |
|
|
|
|
|
|
|
|
|
|
|
|
|
|
|
|
|
|
10.17 |
|
|
8-K |
|
001-35720 |
|
June 24, 2015 |
|
10.2 |
|
|
|
|
|
|
|
|
|
|
|
|
|
|
|
|
|
|
10.18 |
|
|
8-K |
|
001-35720 |
|
June 19, 2018 |
|
10.1 |
|
|
|
|
|
|
|
|
|
|
|
|
|
|
|
|
|
|
10.19 |
|
|
8-K |
|
001-35720 |
|
June 19, 2018 |
|
10.2 |
|
|
|
|
|
|
|
|
|
|
|
|
|
|
|
|
|
|
10.20 |
|
|
10-K |
|
001-35720 |
|
March 30, 2016 |
|
10.13 |
|
|
|
|
|
|
|
|
|
|
|
|
|
|
|
|
|
|
10.21 |
|
|
8-K |
|
001-35720 |
|
July 3, 2017 |
|
10.1 |
|
|
|
|
|
|
|
|
|
|
|
|
|
|
|
|
|
|
10.22 |
|
|
10-Q |
|
001-35720 |
|
June 12, 2018 |
|
10.1 |
|
|
|
|
|
|
|
|
|
|
|
|
|
|
|
|
|
135
|
|
|
|
|
|
|
Incorporated by Reference |
|
|
|
|
||
|
Exhibit Number |
|
Exhibit Description |
|
Form |
|
File Number |
|
Date of First Filing |
|
Exhibit Number |
|
Filed Herewith |
|
|
|
8-K |
|
001-35720 |
|
November 23, 2018 |
|
10.1 |
|
|
||
|
|
|
|
|
|
|
|
|
|
|
|
|
|
|
10.24 |
|
|
8-K |
|
001-35720 |
|
July 13, 2017 |
|
10.1 |
|
|
|
|
|
|
|
|
|
|
|
|
|
|
|
|
|
|
10.25 |
|
|
8-K |
|
001-35720 |
|
July 13, 2017 |
|
10.2 |
|
|
|
|
|
|
|
|
|
|
|
|
|
|
|
|
|
|
21.1 |
|
|
— |
|
— |
|
— |
|
— |
|
X |
|
|
|
|
|
|
|
|
|
|
|
|
|
|
|
|
23.1 |
|
|
— |
|
— |
|
— |
|
— |
|
X |
|
|
|
|
|
|
|
|
|
|
|
|
|
|
|
|
24.1 |
|
|
— |
|
— |
|
— |
|
— |
|
X |
|
|
|
|
|
|
|
|
|
|
|
|
|
|
|
|
31.1 |
|
|
— |
|
— |
|
— |
|
— |
|
X |
|
|
|
|
|
|
|
|
|
|
|
|
|
|
|
|
31.2 |
|
|
— |
|
— |
|
— |
|
— |
|
X |
|
|
|
|
|
|
|
|
|
|
|
|
|
|
|
|
32.1 |
|
|
— |
|
— |
|
— |
|
— |
|
X |
|
|
|
|
|
|
|
|
|
|
|
|
|
|
|
|
32.2 |
|
|
— |
|
— |
|
— |
|
— |
|
X |
|
|
|
|
|
|
|
|
|
|
|
|
|
|
|
|
101.INS |
|
XBRL Instance Document |
|
— |
|
— |
|
— |
|
— |
|
X |
|
|
|
|
|
|
|
|
|
|
|
|
|
|
|
101.SCH |
|
XBRL Taxonomy Extension Schema Document |
|
— |
|
— |
|
— |
|
— |
|
X |
|
|
|
|
|
|
|
|
|
|
|
|
|
|
|
101.CAL |
|
XBRL Taxonomy Extension Calculation Linkbase Document |
|
— |
|
— |
|
— |
|
— |
|
X |
|
|
|
|
|
|
|
|
|
|
|
|
|
|
|
101.DEF |
|
XBRL Extension Definition |
|
— |
|
— |
|
— |
|
— |
|
X |
|
|
|
|
|
|
|
|
|
|
|
|
|
|
|
101.LAB |
|
XBRL Taxonomy Extension Label Linkbase Document |
|
— |
|
— |
|
— |
|
— |
|
X |
|
|
|
|
|
|
|
|
|
|
|
|
|
|
|
101.PRE |
|
XBRL Taxonomy Extension Presentation Linkbase Document |
|
— |
|
— |
|
— |
|
— |
|
X |
|
* |
Indicates management contract or compensatory plan or arrangement. |
136
Pursuant to the requirements of Section 13 or 15(d) of the Securities Exchange Act of 1934, the registrant has duly caused this report to be signed on its behalf by the undersigned, thereunto duly authorized.
|
RH |
||
|
|
|
|
|
By: |
|
/s/ Gary Friedman |
|
|
|
Gary Friedman Chairman of the Board of Directors and Chief Executive Officer |
Date: March 29, 2019
Know all persons by these presents, that each person whose signature appears below constitutes and appoints Gary Friedman and Ryno Blignaut, and each of them, as such person’s true and lawful attorneys-in-fact and agents, with full power of substitution and resubstitution, for such person and in such person’s name, place and stead, in any and all capacities, to sign any and all amendments to this annual report on Form 10-K, and to file the same, with all exhibits thereto, and all other documents in connection therewith, with the Securities and Exchange Commission, granting unto each said attorneys-in-fact and agents, and each of them, full power and authority to do and perform each and every act and thing requisite and necessary to be done in connection therewith, as fully to all intents and purposes as such person might or could do in person, hereby ratifying and confirming all that said attorneys-in-fact and agents, or any of them or their or such person’s substitute or substitutes, may lawfully do or cause to be done by virtue thereof.
Pursuant to the requirements of the Securities Exchange Act of 1934, this report has been signed below by the following persons on behalf of the Registrant and in the capacities on March 29th, 2019.
|
/s/ Gary Friedman |
|
/s/ Ryno Blignaut |
|
Gary Friedman Chairman of the Board of Directors and Chief Executive Officer (Principal Executive Officer) |
|
Ryno Blignaut President, Chief Financial and Administrative Officer (Principal Financial Officer and Principal Accounting Officer) |
|
|
|
|
|
/s/ Carlos Alberini |
|
/s/ Keith Belling |
|
Carlos Alberini Director |
|
Keith Belling Director |
|
|
|
|
|
/s/ Eri Chaya |
|
/s/ Mark Demilio |
|
Eri Chaya Director |
|
Mark Demilio Director |
|
|
|
|
|
/s/ Hilary Krane |
|
/s/ Katie Mitic |
|
Hilary Krane Director |
|
Katie Mitic Director |
|
|
|
|
|
/s/ Ali Rowghani |
|
/s/ Leonard Schlesinger |
|
Ali Rowghani Director |
|
Leonard Schlesinger Director |
137